 22
22peptides
spectra
0.000 | 0.000
0.429 | 0.433
0.000 | 0.000
0.166 | 0.176
0.056 | 0.066
0.000 | 0.000
0.334 | 0.337
0.000 | 0.000
| Plot | Mito | Lyso | Perox | ER | Golgi | PM | Cytosol | Nucleus | |||||
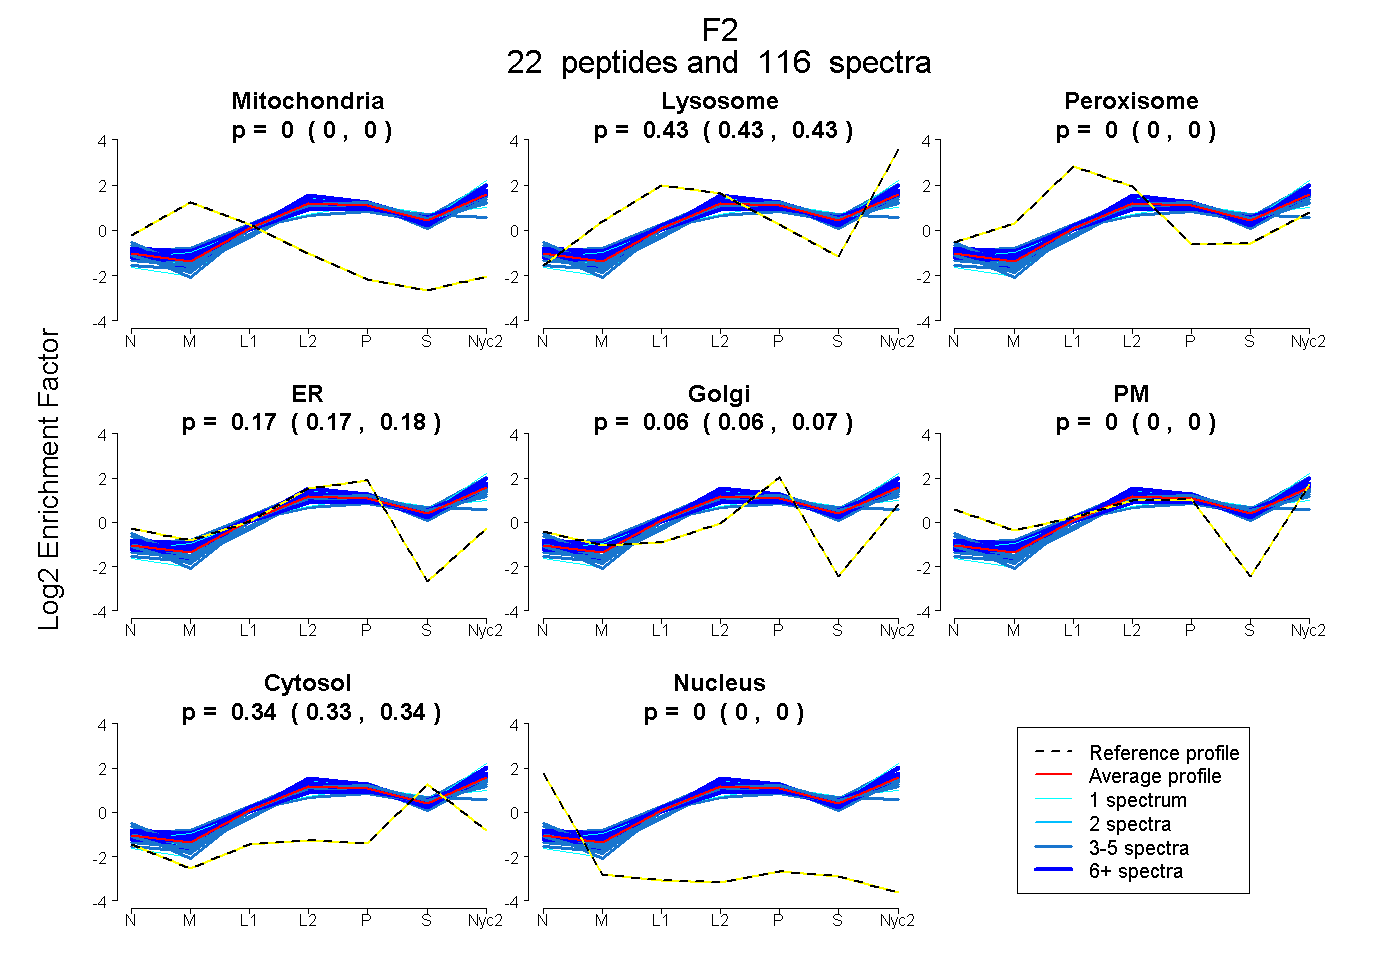
| Expt A |
22 peptides |
116 spectra |
|
0.000 0.000 | 0.000 |
0.432 0.429 | 0.433 |
0.000 0.000 | 0.000 |
0.172 0.166 | 0.176 |
0.062 0.056 | 0.066 |
0.000 0.000 | 0.000 |
0.335 0.334 | 0.337 |
0.000 0.000 | 0.000 |
| 3 spectra, ETFMDCLEGR | 0.000 | 0.357 | 0.000 | 0.290 | 0.019 | 0.000 | 0.334 | 0.000 | ||
| 9 spectra, LVQNFCR | 0.000 | 0.463 | 0.000 | 0.222 | 0.022 | 0.000 | 0.293 | 0.000 | ||
| 1 spectrum, WYQMGIVSWGEGCDR | 0.000 | 0.408 | 0.000 | 0.251 | 0.000 | 0.000 | 0.341 | 0.000 | ||
| 8 spectra, YQNFDPEVK | 0.000 | 0.468 | 0.000 | 0.147 | 0.076 | 0.000 | 0.310 | 0.000 | ||
| 14 spectra, IYIHPR | 0.000 | 0.453 | 0.000 | 0.110 | 0.156 | 0.000 | 0.281 | 0.000 | ||
| 3 spectra, ENLSPPLGECLLER | 0.000 | 0.429 | 0.000 | 0.229 | 0.000 | 0.000 | 0.342 | 0.000 | ||
| 4 spectra, SPQELLCGASLISDR | 0.000 | 0.245 | 0.011 | 0.282 | 0.000 | 0.000 | 0.462 | 0.000 | ||
| 3 spectra, ANSGFLEELR | 0.000 | 0.450 | 0.000 | 0.240 | 0.044 | 0.000 | 0.266 | 0.000 | ||
| 1 spectrum, DLALLK | 0.000 | 0.514 | 0.000 | 0.000 | 0.156 | 0.000 | 0.331 | 0.000 | ||
| 3 spectra, ISMLEK | 0.000 | 0.502 | 0.000 | 0.016 | 0.143 | 0.000 | 0.339 | 0.000 | ||
| 5 spectra, IVEGWDAEK | 0.000 | 0.429 | 0.000 | 0.022 | 0.166 | 0.000 | 0.383 | 0.000 | ||
| 1 spectrum, QTVTSLLQAGYK | 0.000 | 0.547 | 0.000 | 0.064 | 0.123 | 0.000 | 0.265 | 0.000 | ||
| 3 spectra, ITDNMFCAGFK | 0.000 | 0.443 | 0.000 | 0.259 | 0.000 | 0.000 | 0.298 | 0.000 | ||
| 4 spectra, GDACEGDSGGPFVMK | 0.000 | 0.361 | 0.000 | 0.129 | 0.087 | 0.044 | 0.379 | 0.000 | ||
| 7 spectra, YGFYTHVFR | 0.000 | 0.450 | 0.000 | 0.064 | 0.116 | 0.000 | 0.370 | 0.000 | ||
| 11 spectra, VTGWGNLR | 0.000 | 0.507 | 0.000 | 0.126 | 0.105 | 0.000 | 0.262 | 0.000 | ||
| 5 spectra, ELLDSYIDGR | 0.000 | 0.461 | 0.000 | 0.141 | 0.055 | 0.000 | 0.342 | 0.000 | ||
| 9 spectra, GIAPWQVMLFR | 0.000 | 0.489 | 0.000 | 0.077 | 0.122 | 0.000 | 0.312 | 0.000 | ||
| 5 spectra, YTVCDSVR | 0.000 | 0.348 | 0.000 | 0.264 | 0.000 | 0.000 | 0.388 | 0.000 | ||
| 4 spectra, VIDQHR | 0.000 | 0.316 | 0.000 | 0.106 | 0.064 | 0.140 | 0.376 | 0.000 | ||
| 12 spectra, TTDAEFHTFFDER | 0.000 | 0.445 | 0.000 | 0.182 | 0.069 | 0.000 | 0.303 | 0.000 | ||
| 1 spectrum, KPVPFSDYIHPVCLPDK | 0.000 | 0.347 | 0.000 | 0.187 | 0.002 | 0.000 | 0.465 | 0.000 |
| Plot | Mito | Lyso or Perox | ER | Golgi | PM | Cytosol | Nucleus | ||||||
| Expt B |
9 peptides |
32 spectra |
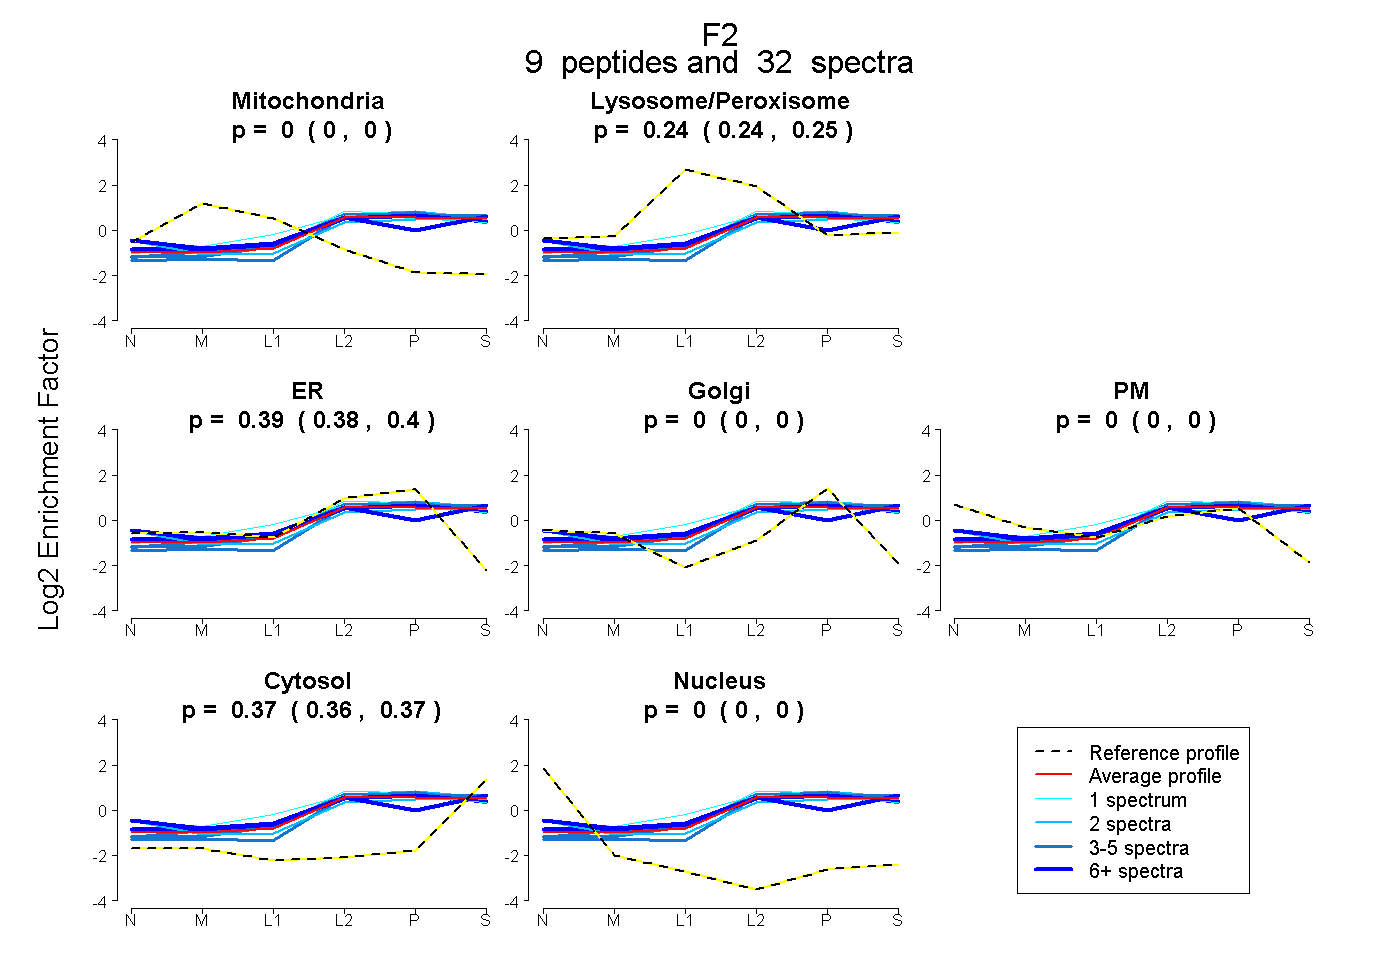 |
0.000 0.000 | 0.000 |
0.243 0.236 | 0.249 |
0.391 0.384 | 0.397 |
0.000 0.000 | 0.000 |
0.000 0.000 | 0.000 |
0.365 0.361 | 0.369 |
0.000 0.000 | 0.000 |
|||
| Plot | Lyso | Other | |||||||||||
| Expt C |
22 peptides |
170 spectra |
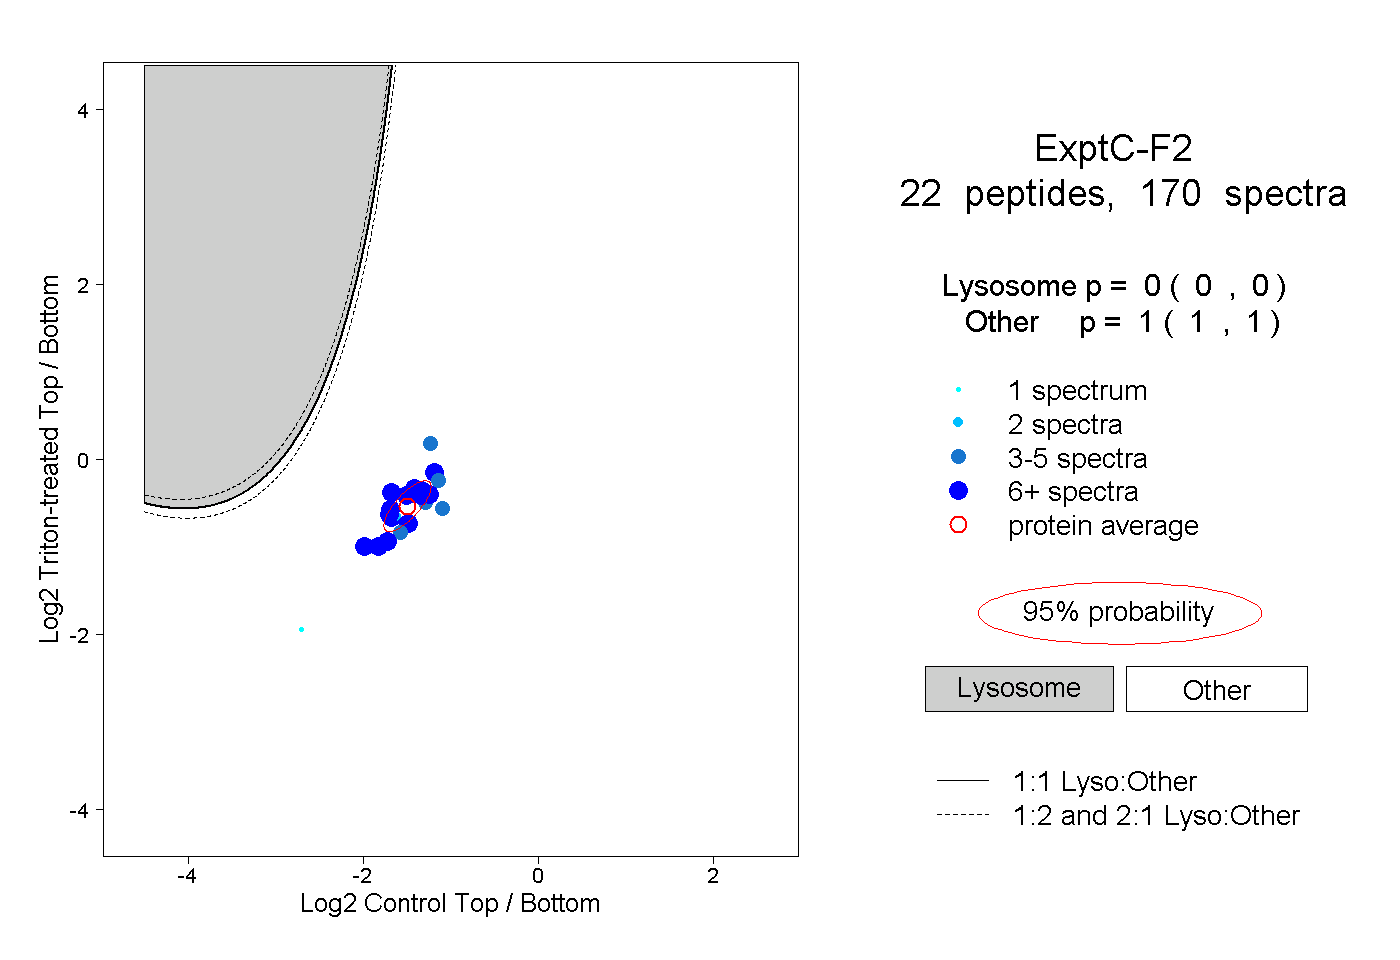 |
0.000 0.000 | 0.000 |
1.000 1.000 | 1.000 |
||||||||
| Plot | Lyso | Other | |||||||||||
| Expt D |
12 peptides |
27 spectra |
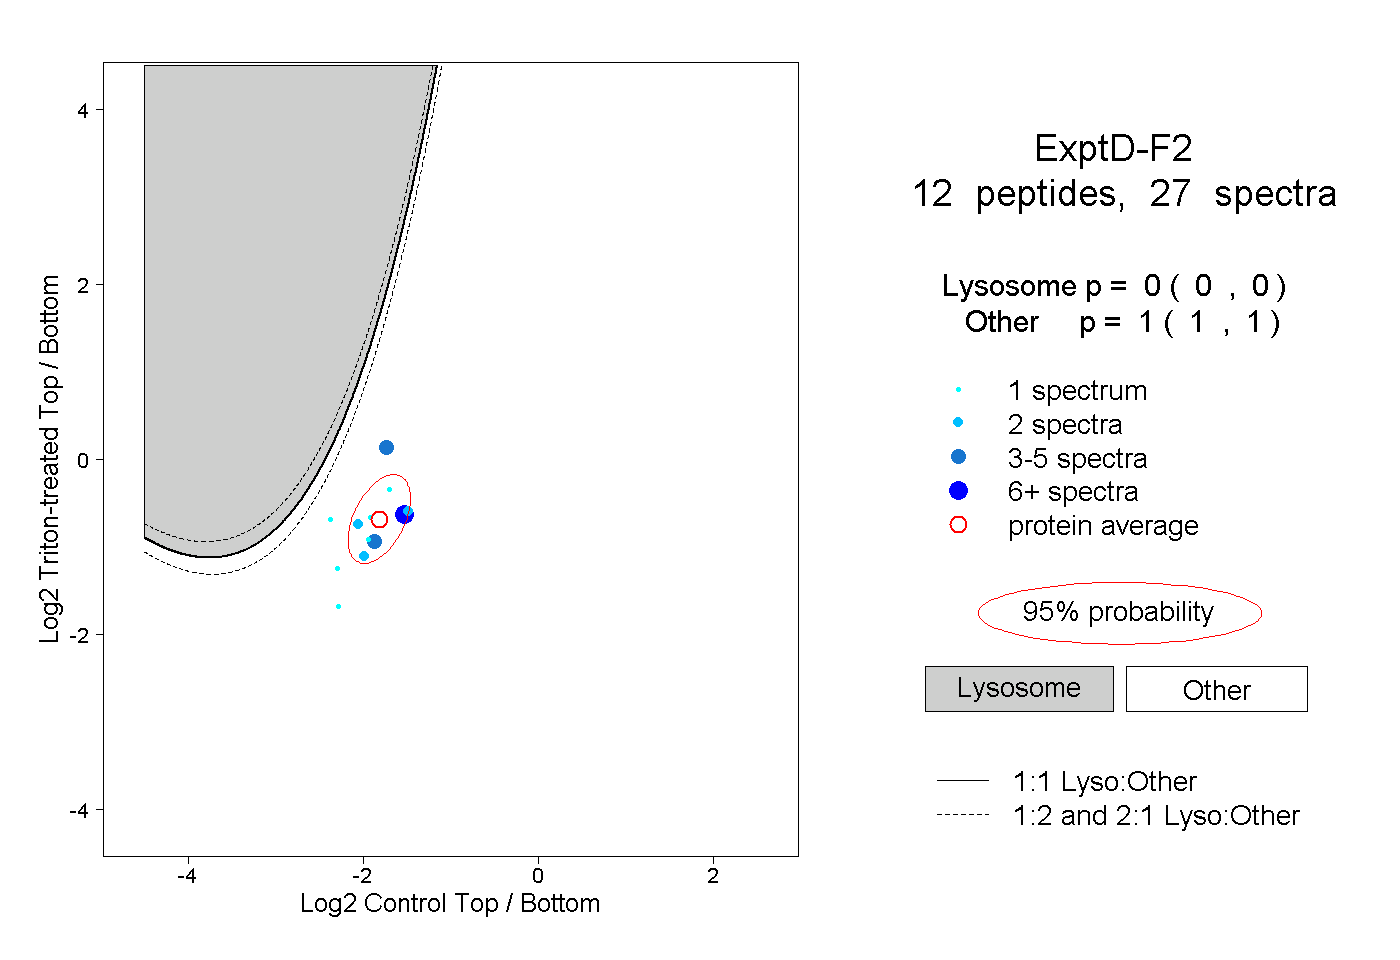 |
0.000 0.000 | 0.000 |
1.000 1.000 | 1.000 |