F2
[ENSRNOP00000022233]
Main page
| | | Plot |
Mito |
Lyso |
|
Perox |
ER |
Golgi |
PM |
Cytosol |
Nucleus |
|
| Expt A |
 22
22
peptides |
116
spectra |
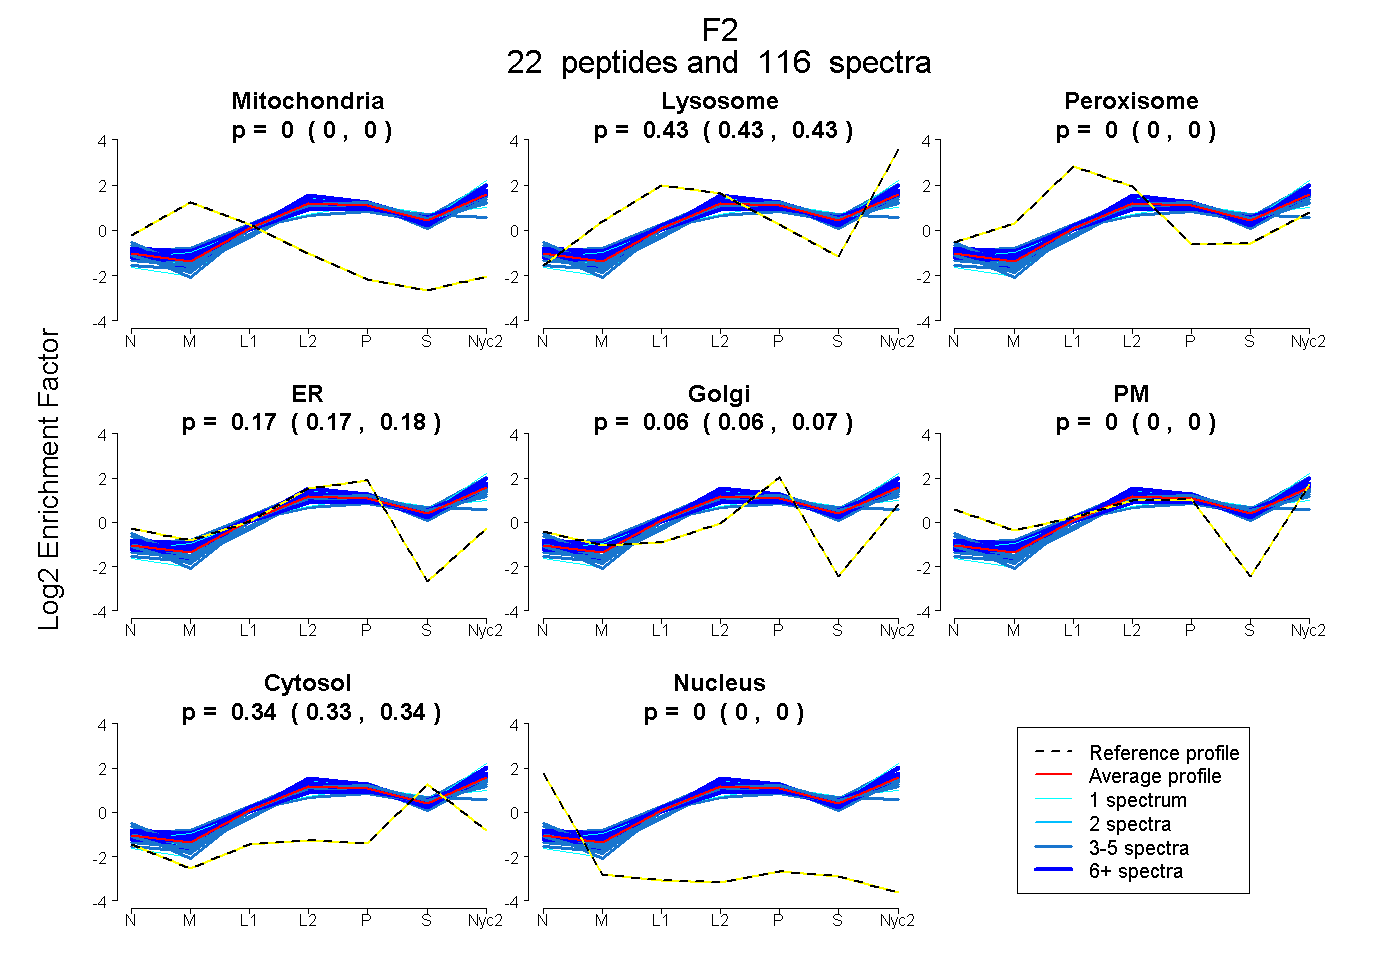 |
0.000
0.000 | 0.000 |
0.432
0.429 | 0.433 |
|
0.000
0.000 | 0.000 |
0.172
0.166 | 0.176 |
0.062
0.056 | 0.066 |
0.000
0.000 | 0.000 |
0.335
0.334 | 0.337 |
0.000
0.000 | 0.000 |
|
| | | Plot |
Mito |
|
Lyso or Perox |
|
ER |
Golgi |
PM |
Cytosol |
Nucleus |
|
| Expt B |
9
peptides |
32
spectra |
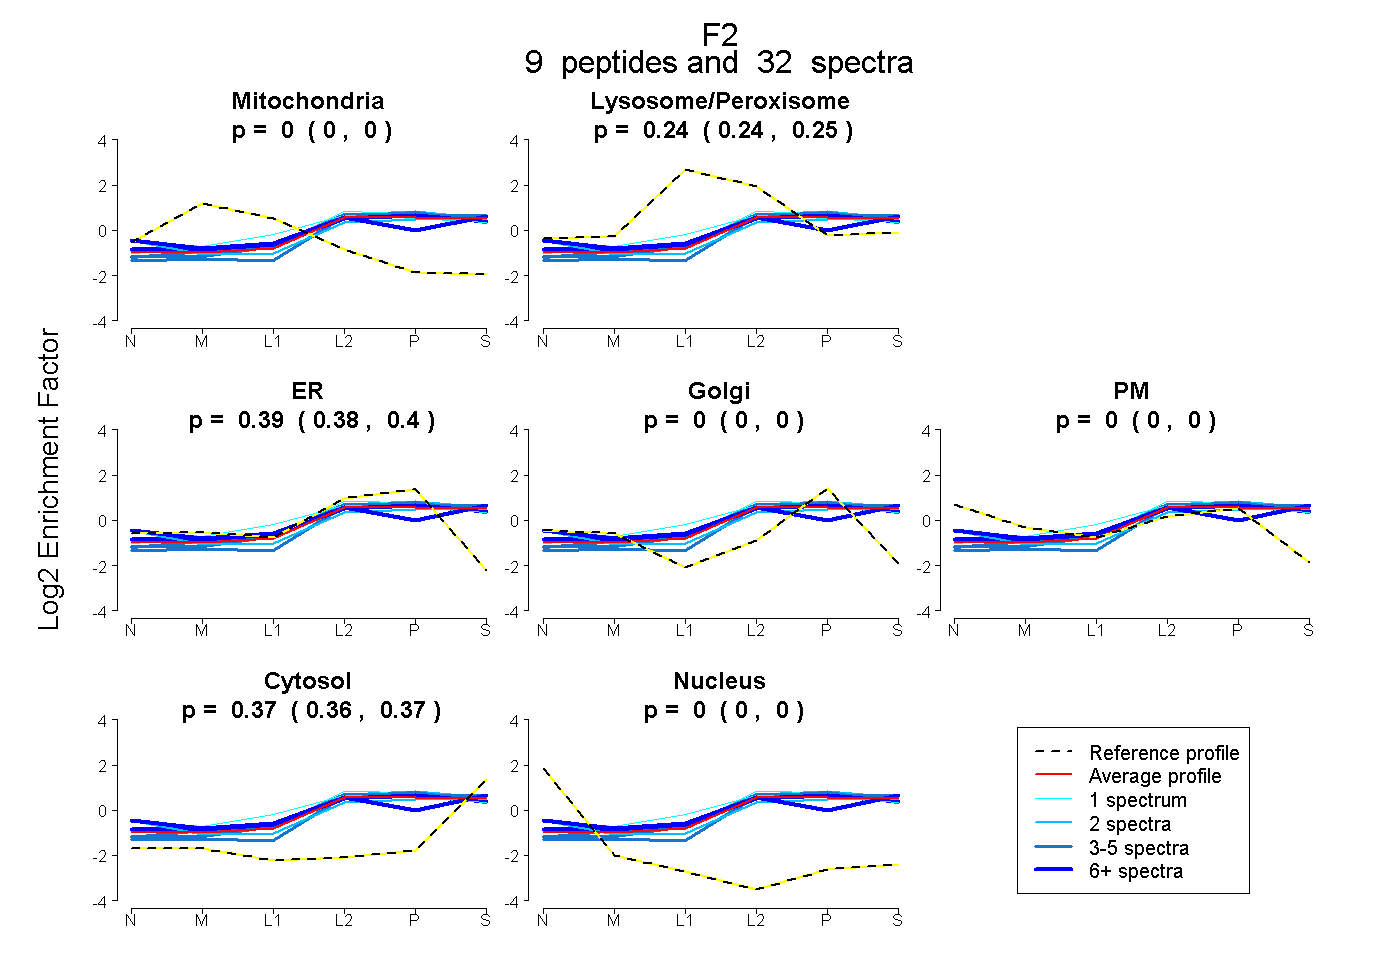 |
0.000
0.000 | 0.000 |
|
0.243
0.236 | 0.249 |
|
0.391
0.384 | 0.397 |
0.000
0.000 | 0.000 |
0.000
0.000 | 0.000 |
0.365
0.361 | 0.369 |
0.000
0.000 | 0.000 |
|
| 4 spectra, ETFMDCLEGR |
0.000 |
|
0.146 |
|
0.427 |
0.000 |
0.000 |
0.427 |
0.000 |
|
| 4 spectra, LVQNFCR |
0.000 |
|
0.261 |
|
0.373 |
0.000 |
0.000 |
0.365 |
0.000 |
|
| 6 spectra, YGFYTHVFR |
0.000 |
|
0.340 |
|
0.194 |
0.000 |
0.087 |
0.379 |
0.000 |
|
| 2 spectra, VTGWGNLR |
0.000 |
|
0.241 |
|
0.281 |
0.113 |
0.000 |
0.365 |
0.000 |
|
| 5 spectra, IYIHPR |
0.000 |
|
0.228 |
|
0.434 |
0.000 |
0.000 |
0.338 |
0.000 |
|
| 2 spectra, ELLDSYIDGR |
0.000 |
|
0.123 |
|
0.484 |
0.000 |
0.000 |
0.393 |
0.000 |
|
| 1 spectrum, VIDQHR |
0.000 |
|
0.441 |
|
0.095 |
0.239 |
0.000 |
0.225 |
0.000 |
|
| 1 spectrum, IVEGWDAEK |
0.000 |
|
0.248 |
|
0.438 |
0.000 |
0.000 |
0.314 |
0.000 |
|
| 7 spectra, TTDAEFHTFFDER |
0.000 |
|
0.267 |
|
0.375 |
0.026 |
0.000 |
0.332 |
0.000 |
|
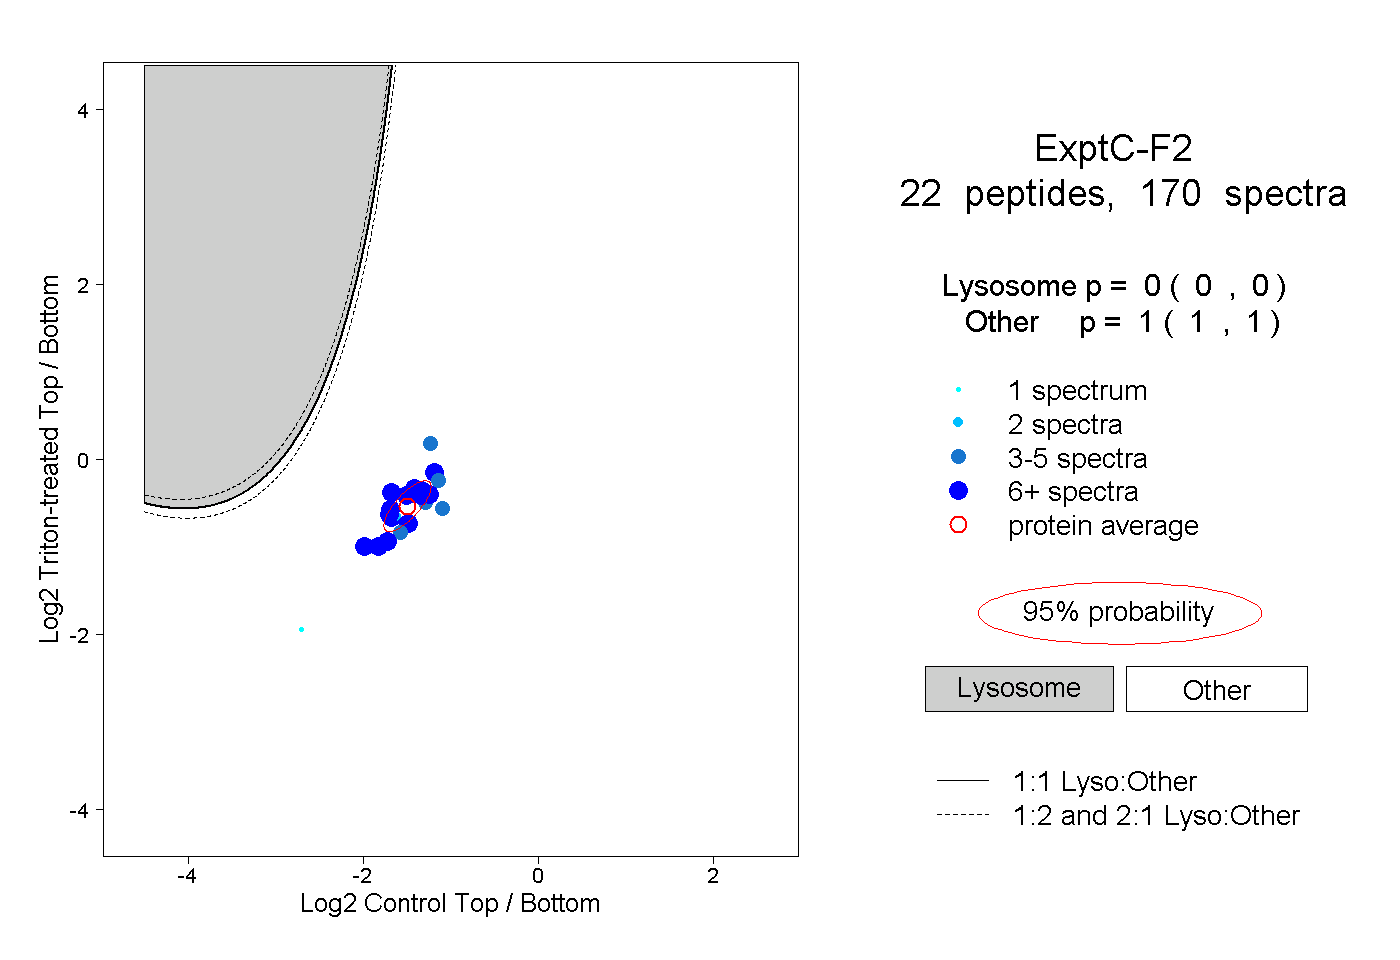
| | | Plot |
|
Lyso |
|
|
|
|
|
|
|
Other |
| Expt C |
22
peptides |
170
spectra |
 |
|
0.000
0.000 | 0.000 |
|
|
|
|
|
|
|
1.000
1.000 | 1.000 |
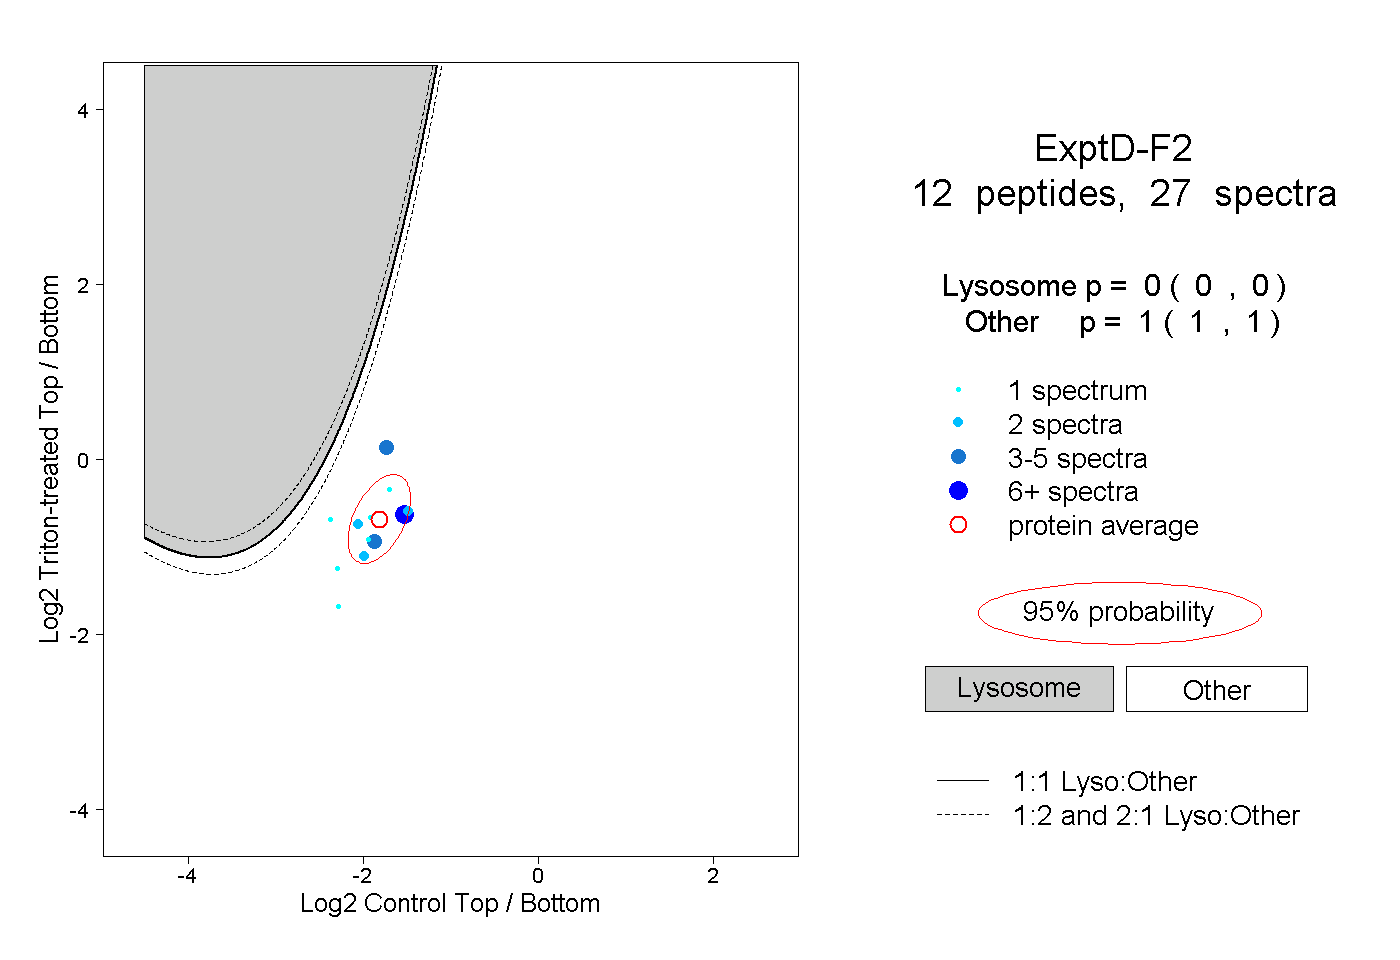
| | | Plot |
|
Lyso |
|
|
|
|
|
|
|
Other |
| Expt D |
12
peptides |
27
spectra |
 |
|
0.000
0.000 | 0.000 |
|
|
|
|
|
|
|
1.000
1.000 | 1.000 |