 6
6peptides
spectra
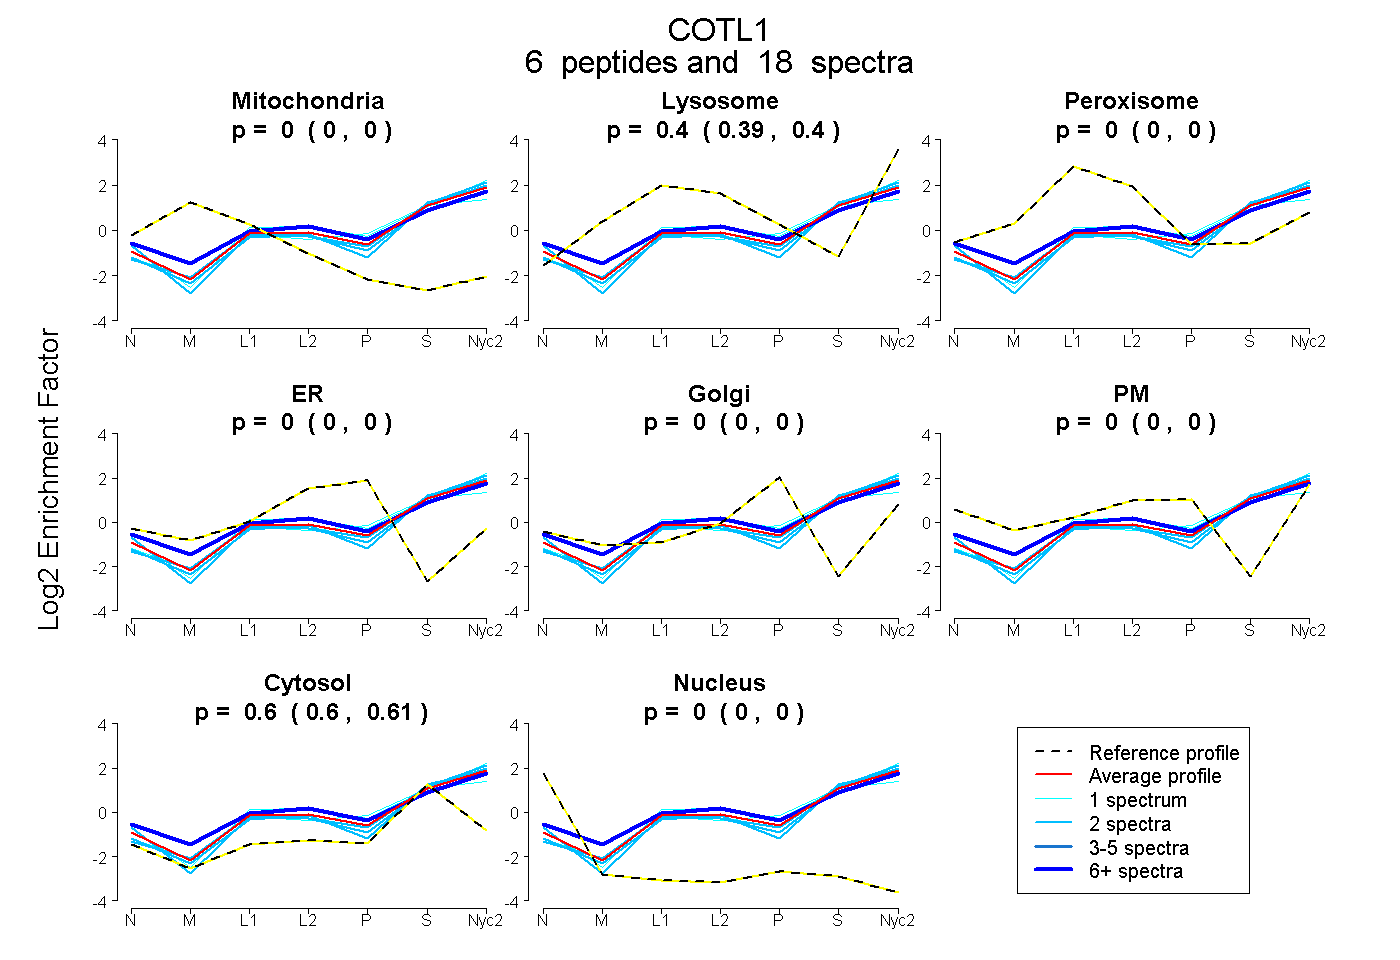
0.000 | 0.000
0.389 | 0.403
0.000 | 0.000
0.000 | 0.000
0.000 | 0.000
0.000 | 0.000
0.596 | 0.609
0.000 | 0.000
4peptides
spectra
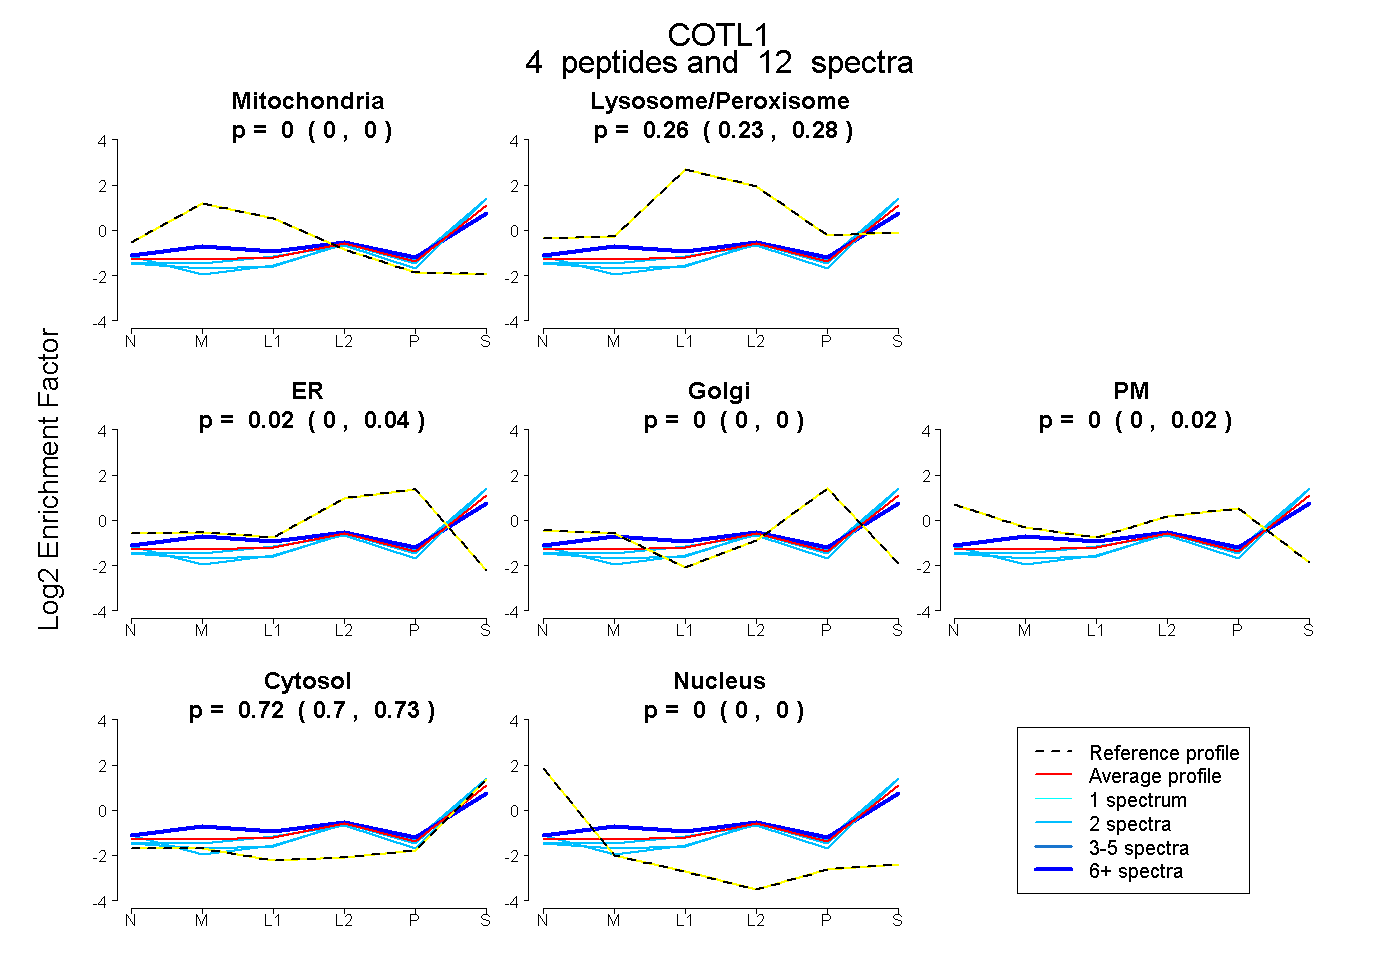
0.000 | 0.000
0.233 | 0.275
0.000 | 0.042
0.000 | 0.000
0.000 | 0.016
0.704 | 0.734
0.000 | 0.000
6peptides
spectra
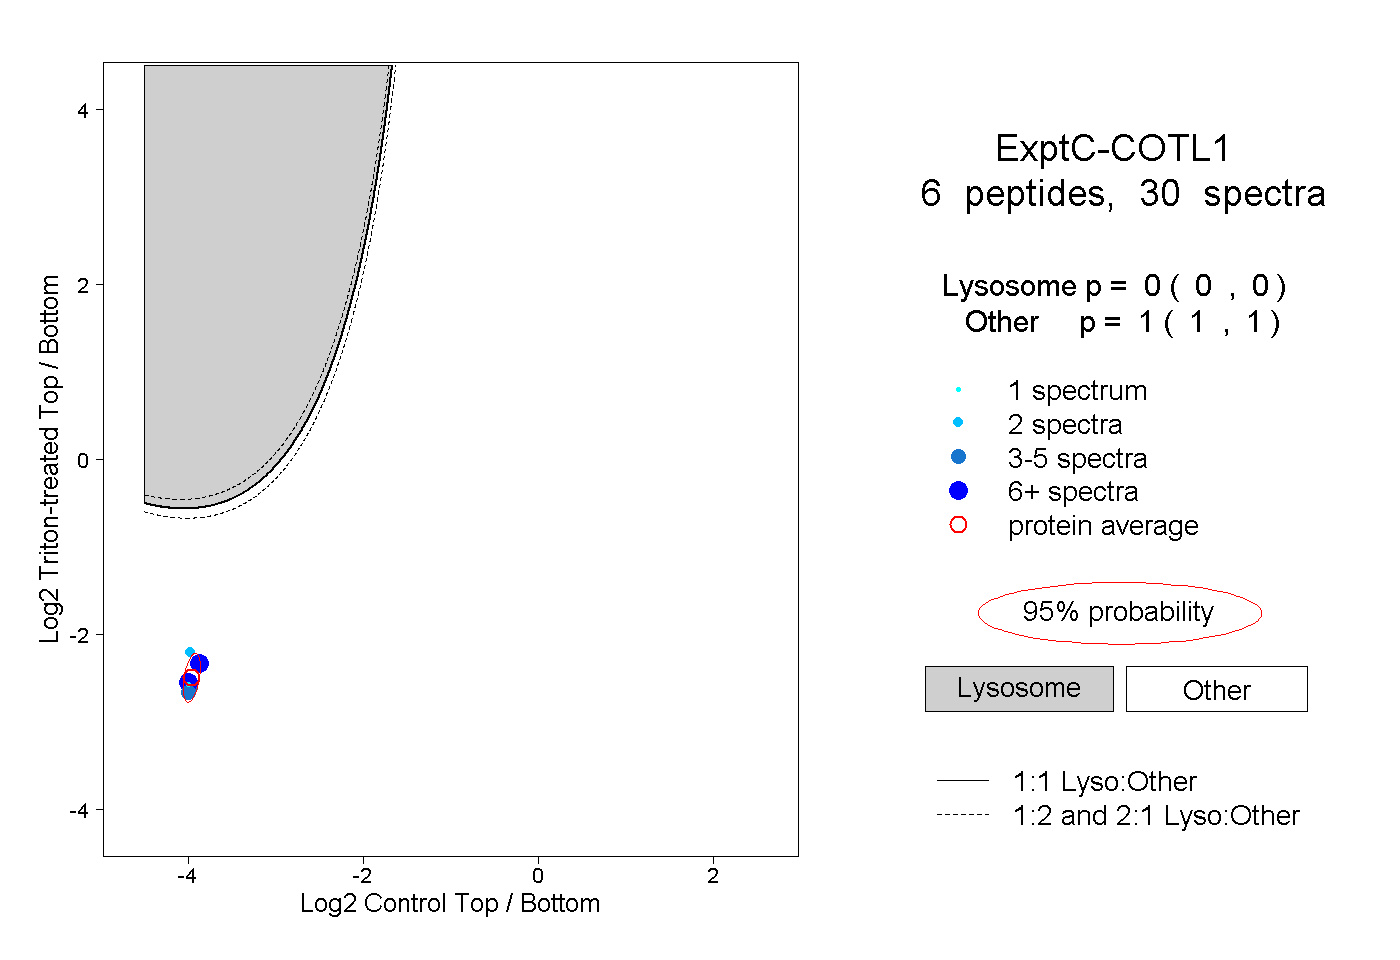
0.000 | 0.000
1.000 | 1.000
2peptides
spectra
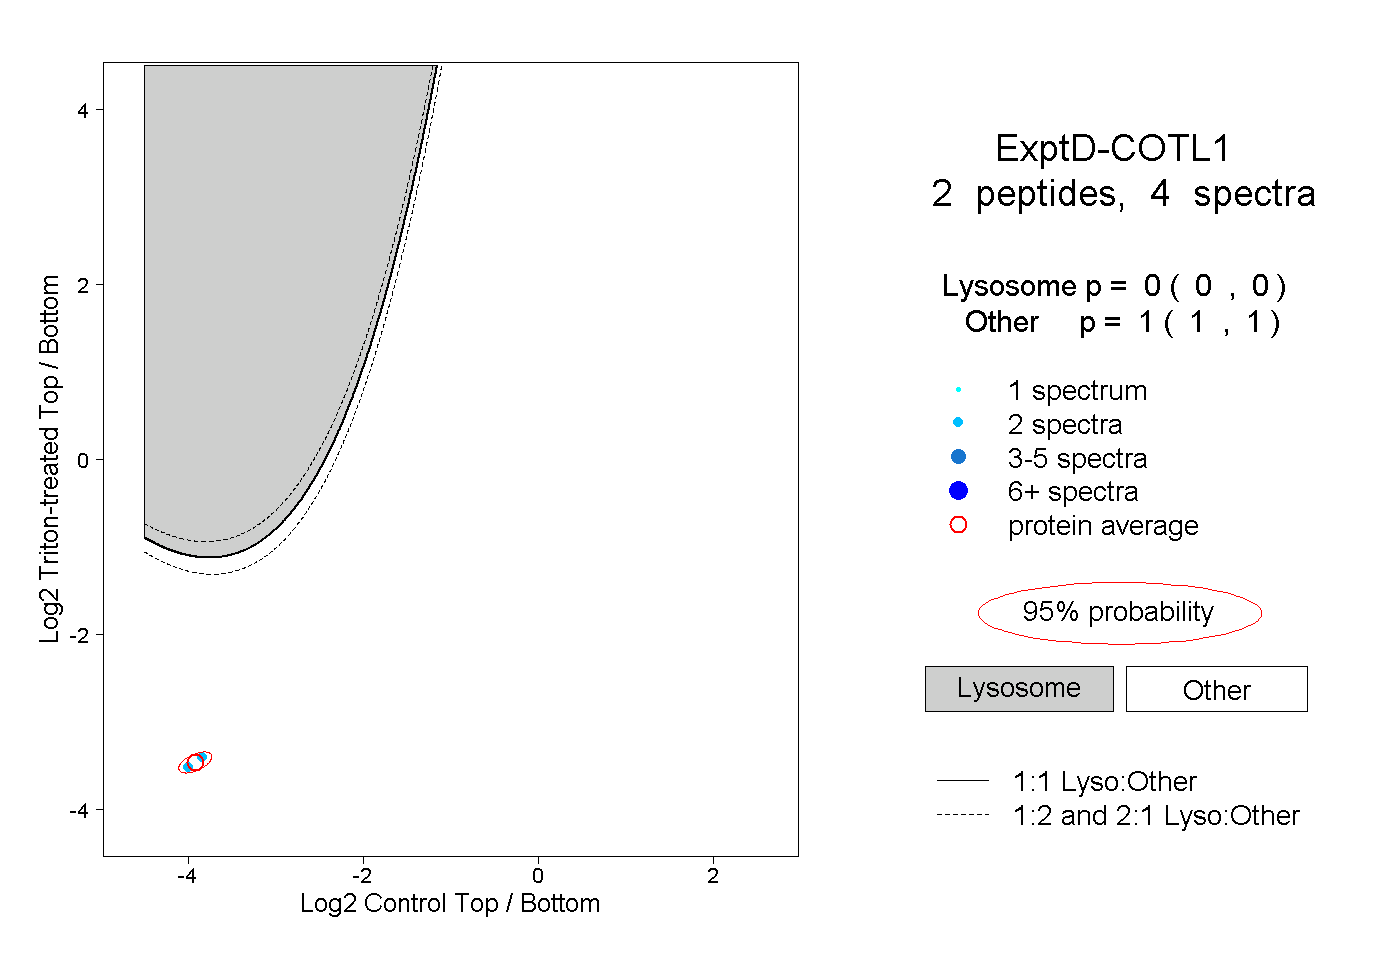
0.000 | 0.000
1.000 | 1.000