COTL1
[ENSRNOP00000021954]
Main page
| | | Plot |
Mito |
Lyso |
|
Perox |
ER |
Golgi |
PM |
Cytosol |
Nucleus |
|
| Expt A |
 6
6
peptides |
18
spectra |
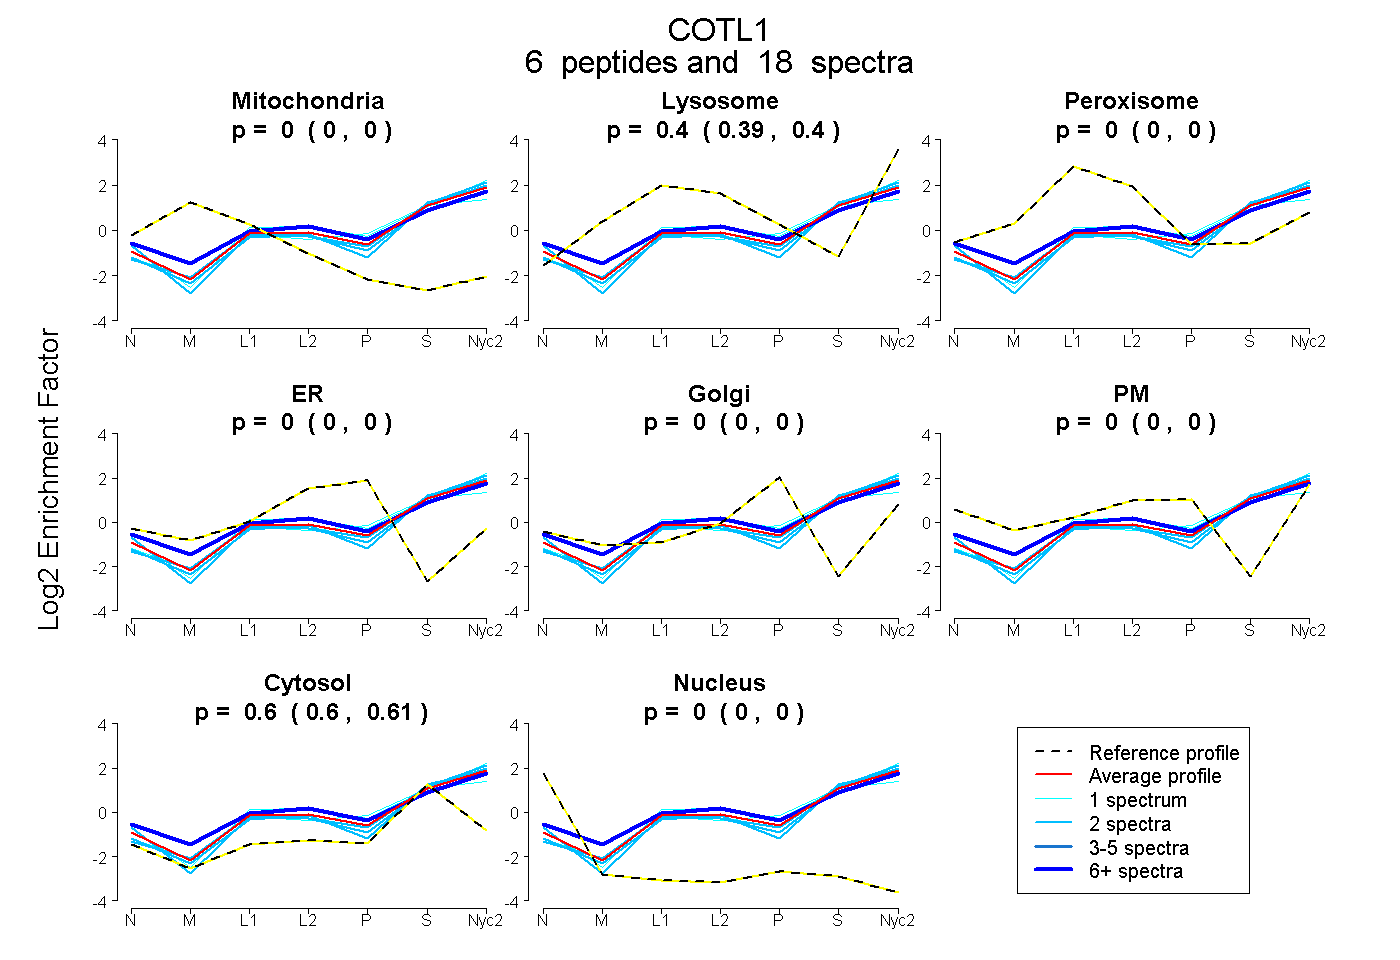 |
0.000
0.000 | 0.000 |
0.397
0.389 | 0.403 |
|
0.000
0.000 | 0.000 |
0.000
0.000 | 0.000 |
0.000
0.000 | 0.000 |
0.000
0.000 | 0.000 |
0.603
0.596 | 0.609 |
0.000
0.000 | 0.000 |
|
| | | Plot |
Mito |
|
Lyso or Perox |
|
ER |
Golgi |
PM |
Cytosol |
Nucleus |
|
| Expt B |
4
peptides |
12
spectra |
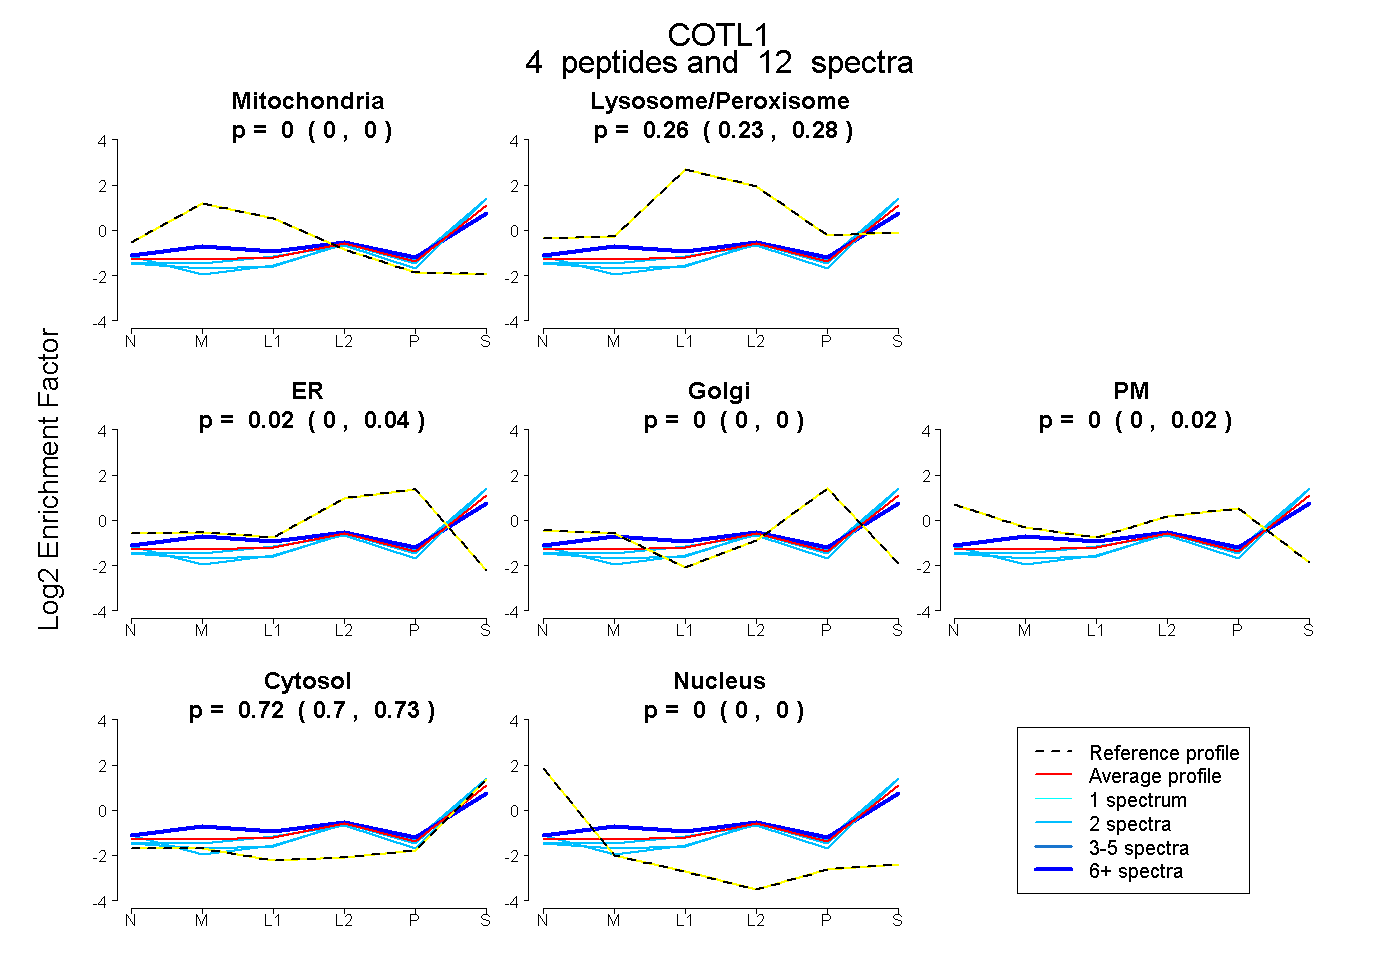 |
0.000
0.000 | 0.000 |
|
0.258
0.233 | 0.275 |
|
0.020
0.000 | 0.042 |
0.000
0.000 | 0.000 |
0.000
0.000 | 0.016 |
0.722
0.704 | 0.734 |
0.000
0.000 | 0.000 |
|
| 6 spectra, ELEEDFIR |
0.059 |
|
0.251 |
|
0.029 |
0.000 |
0.048 |
0.612 |
0.000 |
|
| 2 spectra, LFAFVR |
0.000 |
|
0.238 |
|
0.000 |
0.000 |
0.000 |
0.762 |
0.000 |
|
| 2 spectra, EFVISDR |
0.000 |
|
0.200 |
|
0.000 |
0.000 |
0.000 |
0.800 |
0.000 |
|
| 2 spectra, AAYNLVR |
0.000 |
|
0.199 |
|
0.020 |
0.000 |
0.000 |
0.781 |
0.000 |
|
| | | Plot |
|
Lyso |
|
|
|
|
|
|
|
Other |
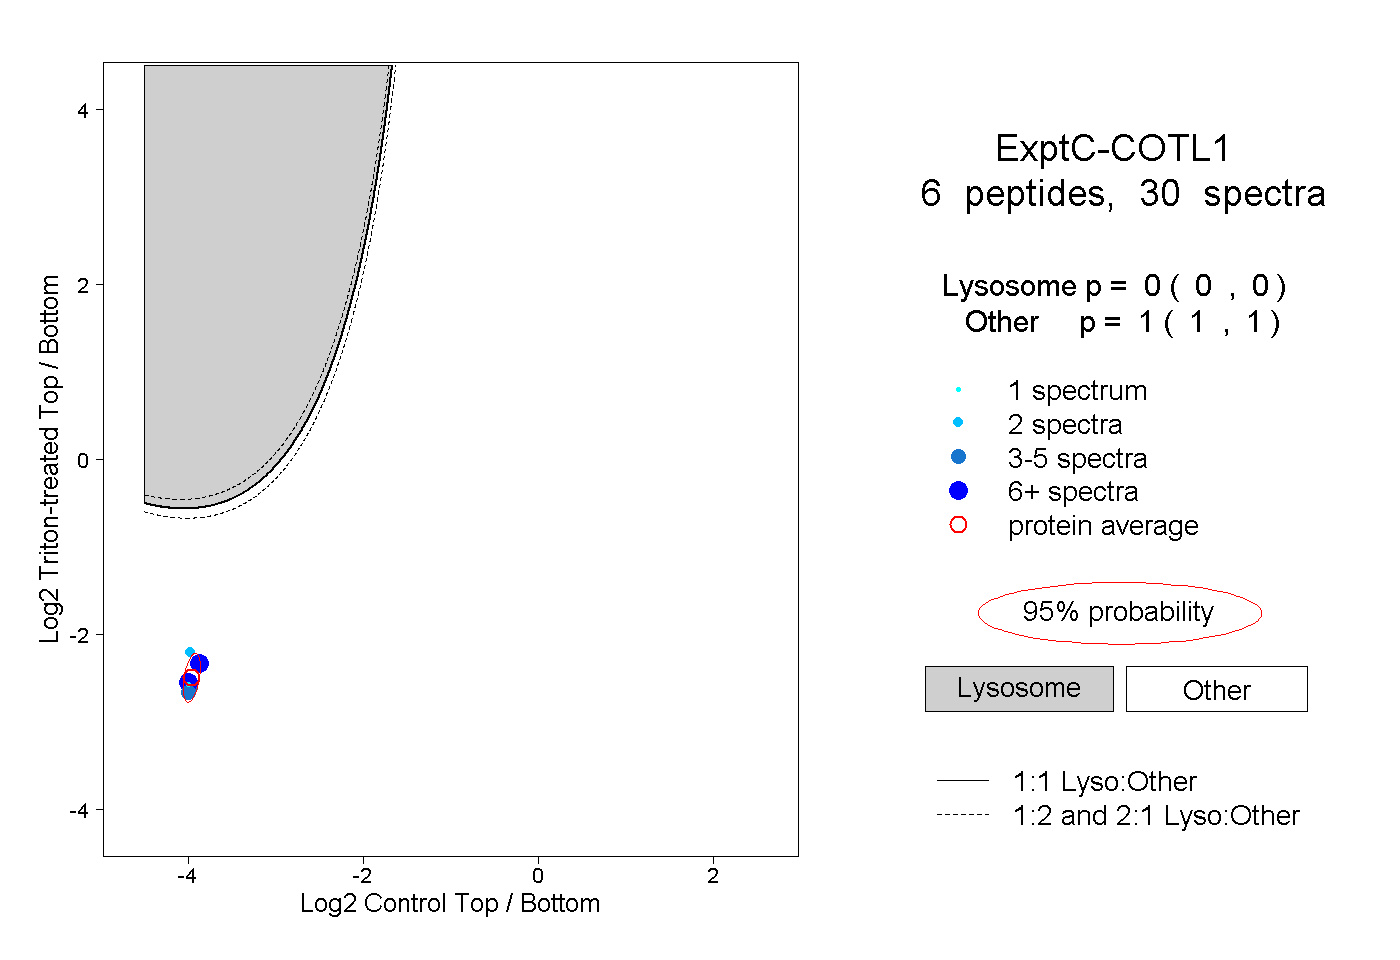
| Expt C |
6
peptides |
30
spectra |
 |
|
0.000
0.000 | 0.000 |
|
|
|
|
|
|
|
1.000
1.000 | 1.000 |
| | | Plot |
|
Lyso |
|
|
|
|
|
|
|
Other |
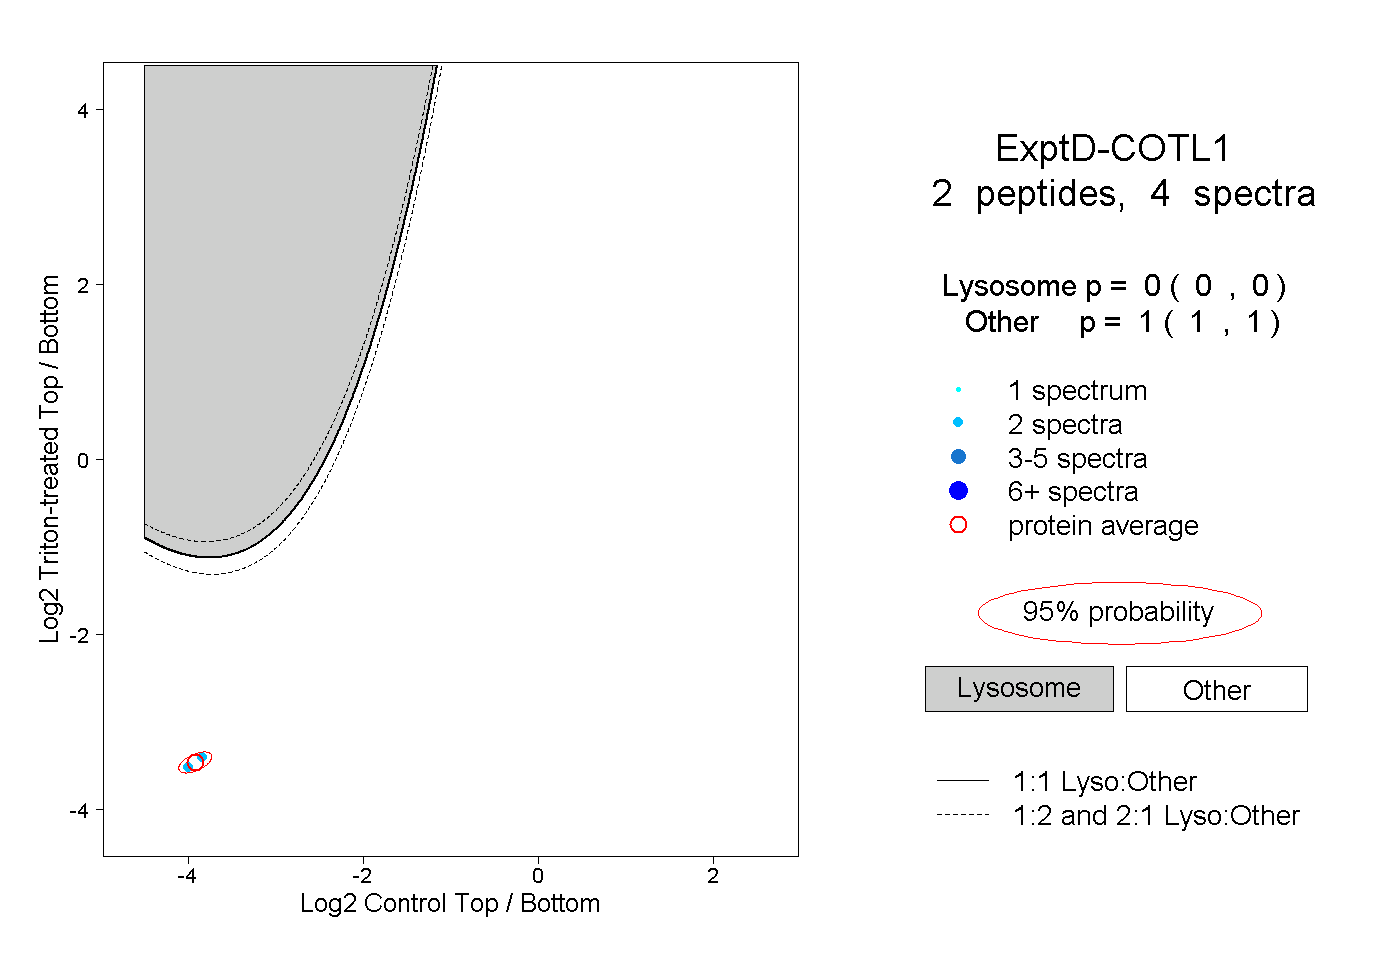
| Expt D |
2
peptides |
4
spectra |
 |
|
0.000
0.000 | 0.000 |
|
|
|
|
|
|
|
1.000
1.000 | 1.000 |