 6
6peptides
spectra
0.000 | 0.000
0.389 | 0.403
0.000 | 0.000
0.000 | 0.000
0.000 | 0.000
0.000 | 0.000
0.596 | 0.609
0.000 | 0.000
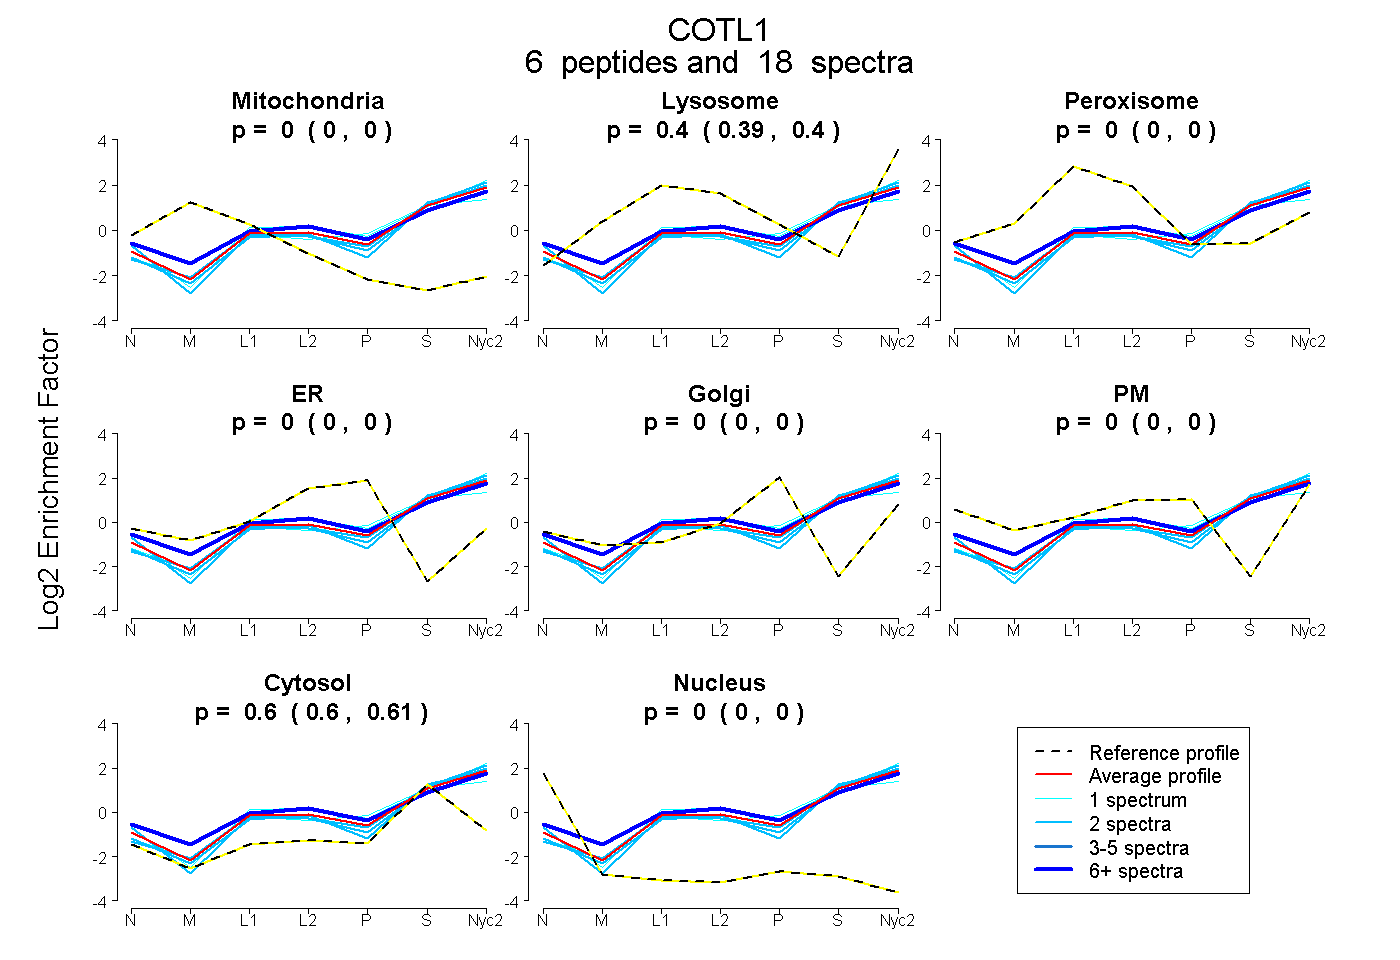
| Plot | Mito | Lyso | Perox | ER | Golgi | PM | Cytosol | Nucleus | |||||
| Expt A |
6 peptides |
18 spectra |
|
0.000 0.000 | 0.000 |
0.397 0.389 | 0.403 |
0.000 0.000 | 0.000 |
0.000 0.000 | 0.000 |
0.000 0.000 | 0.000 |
0.000 0.000 | 0.000 |
0.603 0.596 | 0.609 |
0.000 0.000 | 0.000 |
| 1 spectrum, AGGANYDAQSE | 0.000 | 0.445 | 0.000 | 0.000 | 0.000 | 0.000 | 0.555 | 0.000 | ||
| 10 spectra, ELEEDFIR | 0.000 | 0.421 | 0.000 | 0.000 | 0.000 | 0.048 | 0.531 | 0.000 | ||
| 2 spectra, DDGSSVIWVTFK | 0.000 | 0.352 | 0.000 | 0.000 | 0.000 | 0.000 | 0.648 | 0.000 | ||
| 2 spectra, EFVISDR | 0.000 | 0.354 | 0.000 | 0.000 | 0.000 | 0.000 | 0.646 | 0.000 | ||
| 1 spectrum, AAYNLVR | 0.000 | 0.356 | 0.000 | 0.000 | 0.000 | 0.000 | 0.644 | 0.000 | ||
| 2 spectra, FTTGDAMSK | 0.000 | 0.403 | 0.000 | 0.000 | 0.000 | 0.000 | 0.597 | 0.000 |
| Plot | Mito | Lyso or Perox | ER | Golgi | PM | Cytosol | Nucleus | ||||||
| Expt B |
4 peptides |
12 spectra |
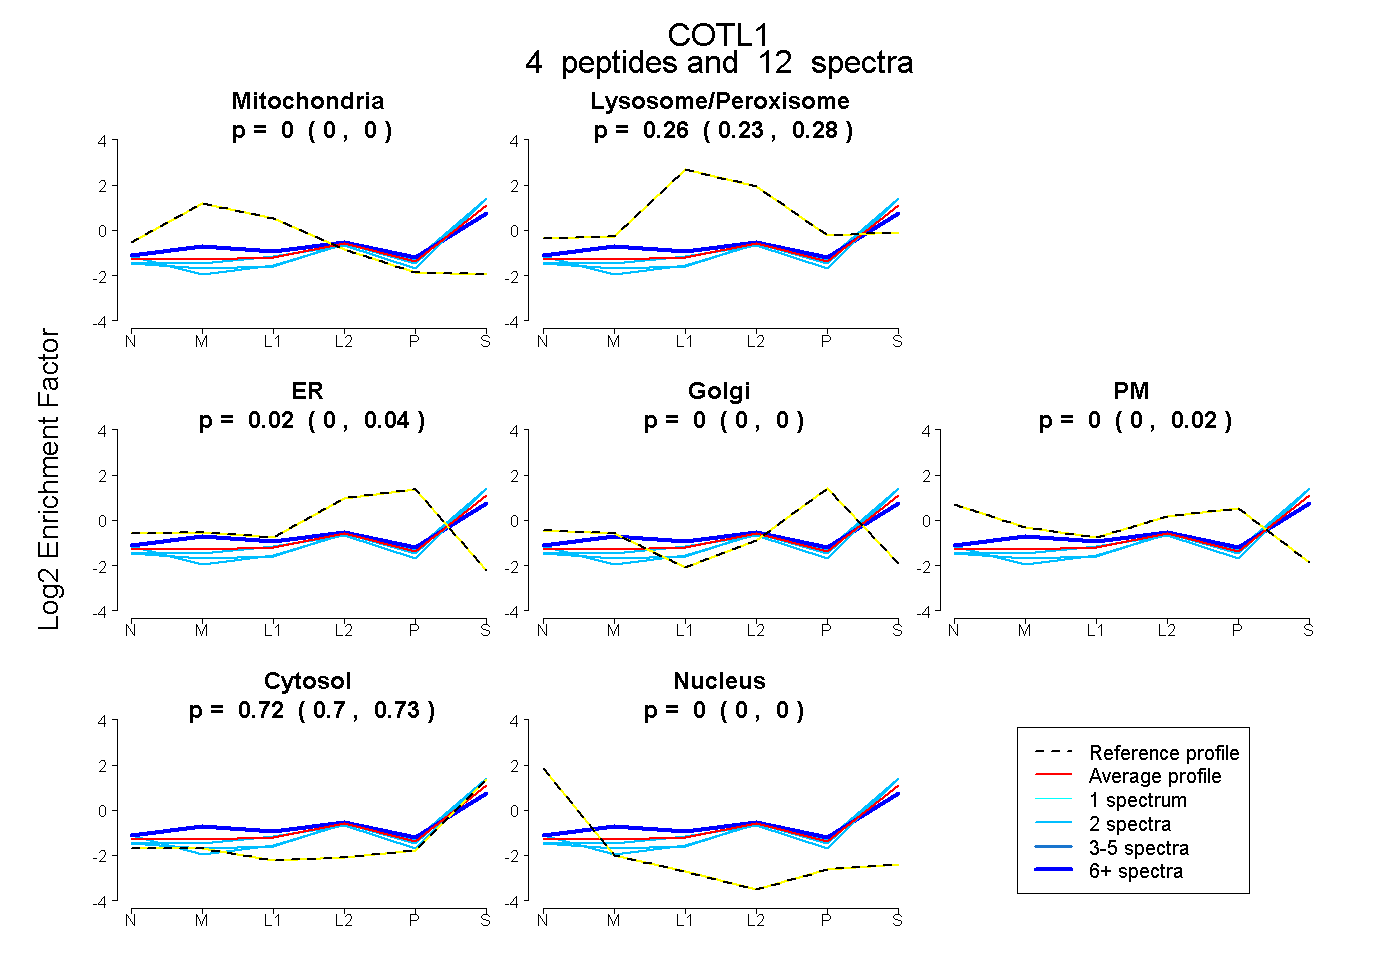 |
0.000 0.000 | 0.000 |
0.258 0.233 | 0.275 |
0.020 0.000 | 0.042 |
0.000 0.000 | 0.000 |
0.000 0.000 | 0.016 |
0.722 0.704 | 0.734 |
0.000 0.000 | 0.000 |
|||
| Plot | Lyso | Other | |||||||||||
| Expt C |
6 peptides |
30 spectra |
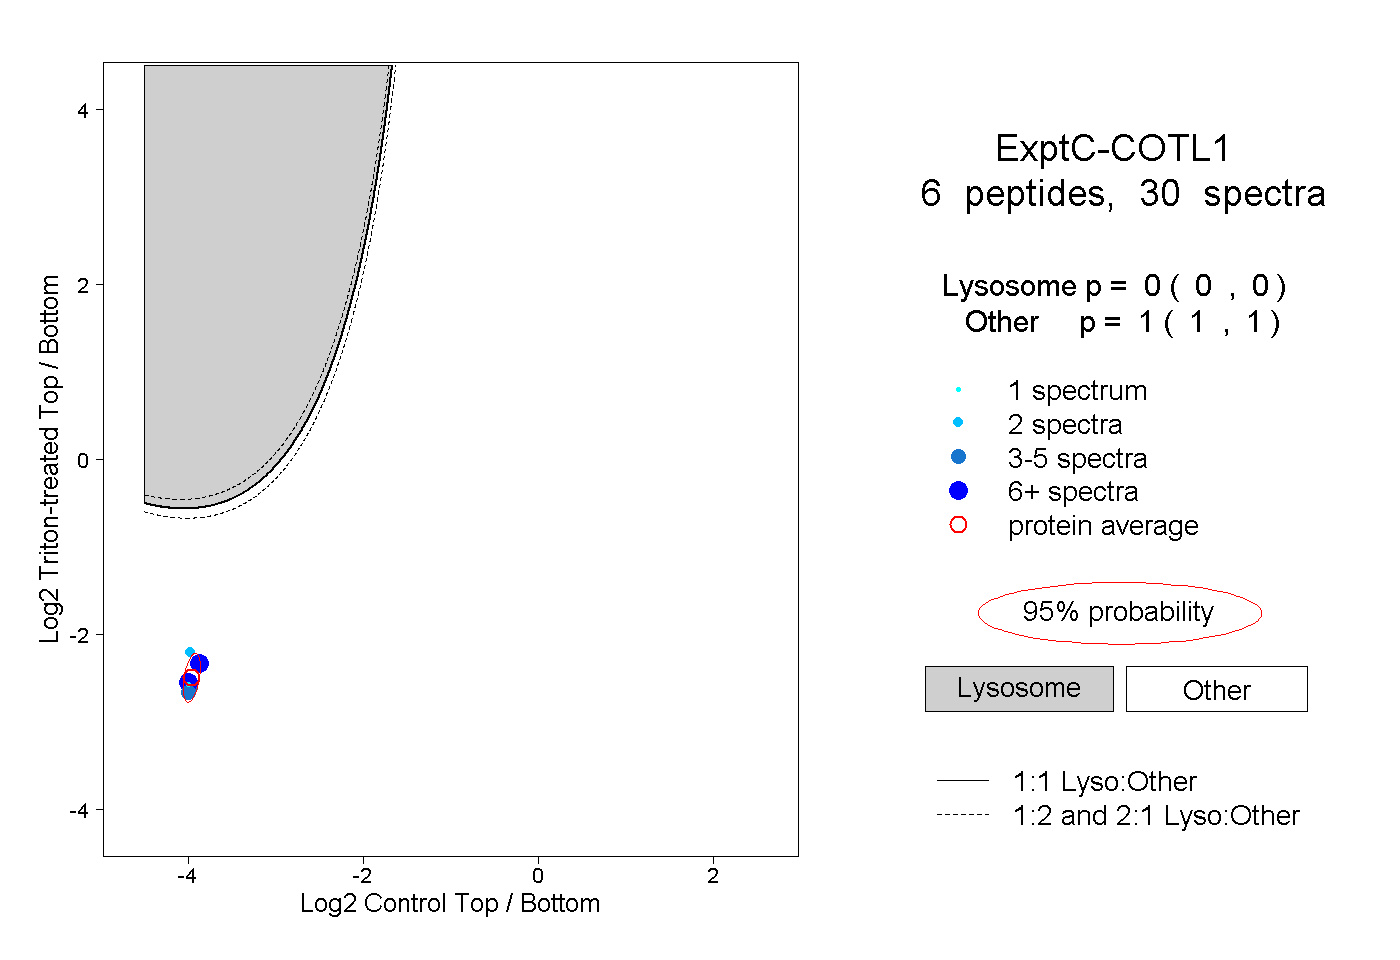 |
0.000 0.000 | 0.000 |
1.000 1.000 | 1.000 |
||||||||
| Plot | Lyso | Other | |||||||||||
| Expt D |
2 peptides |
4 spectra |
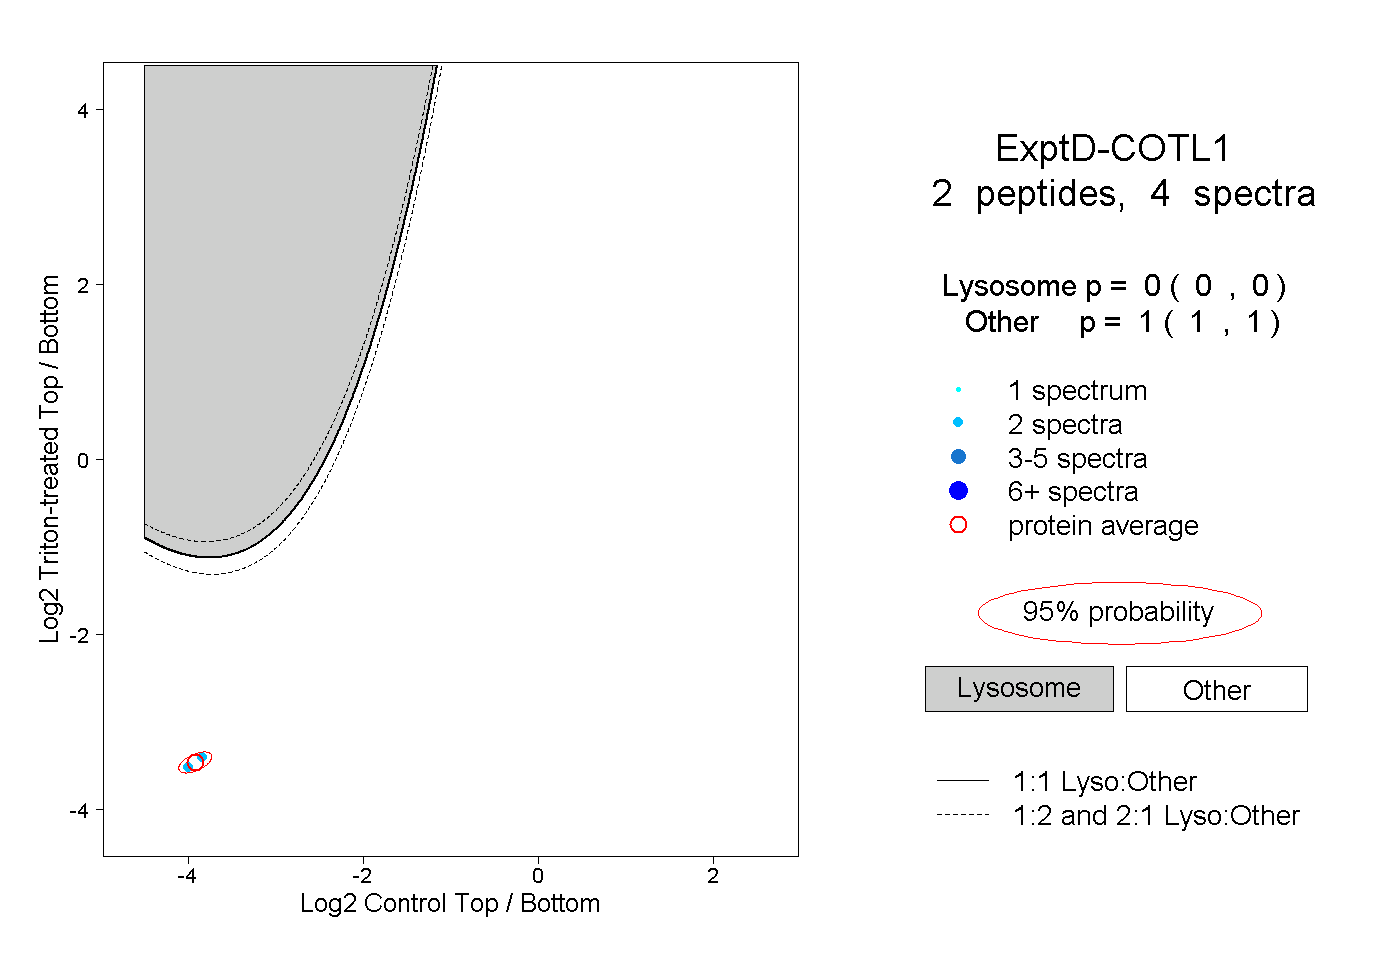 |
0.000 0.000 | 0.000 |
1.000 1.000 | 1.000 |