 10
10peptides
spectra
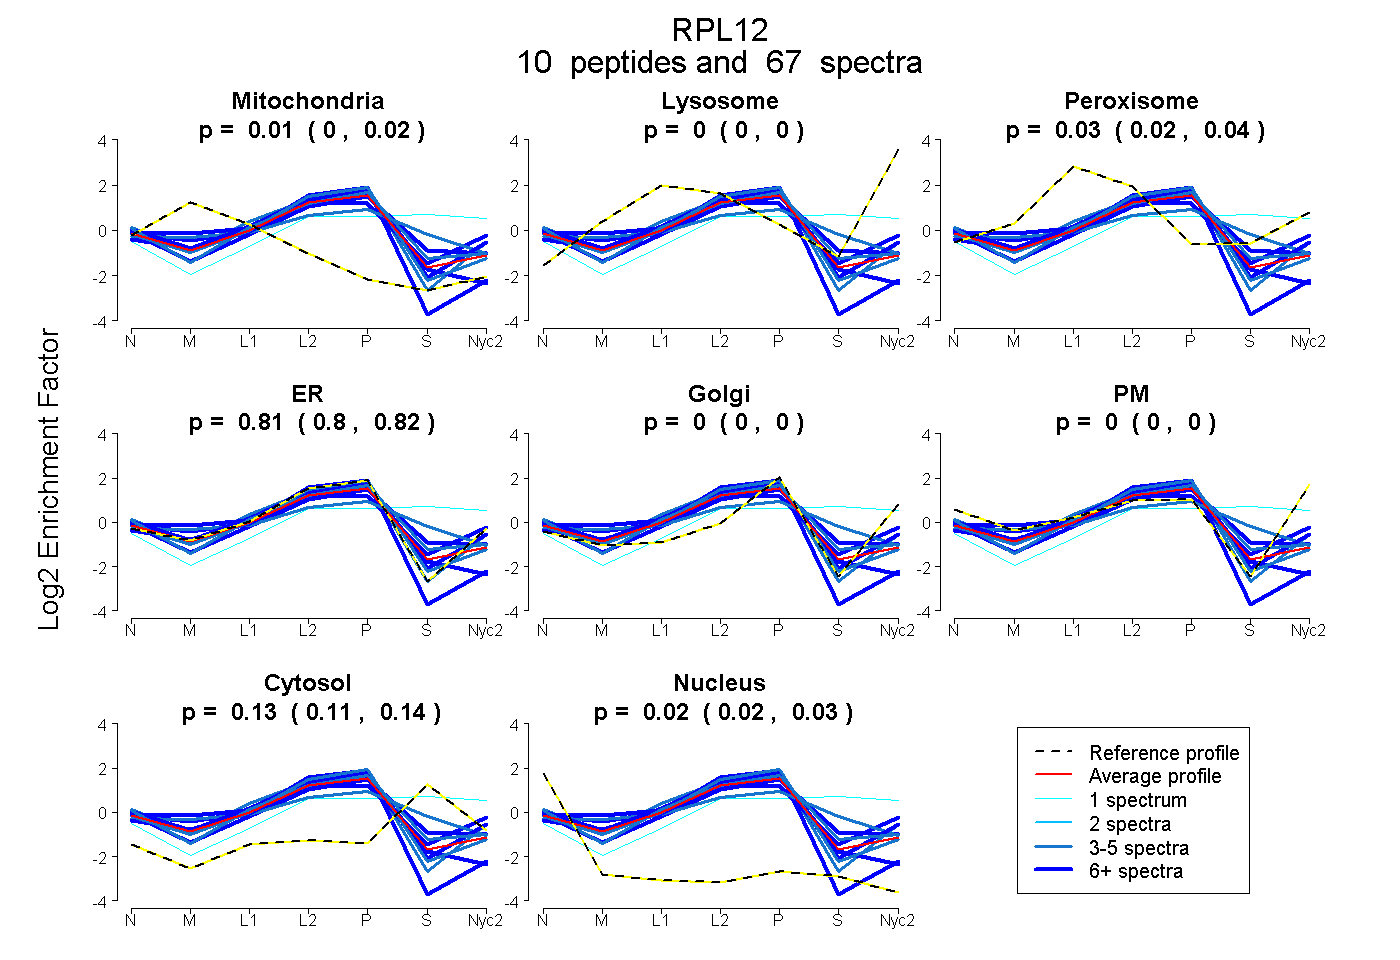
0.000 | 0.023
0.000 | 0.000
0.016 | 0.035
0.800 | 0.819
0.000 | 0.000
0.000 | 0.000
0.112 | 0.136
0.016 | 0.031
9peptides
spectra
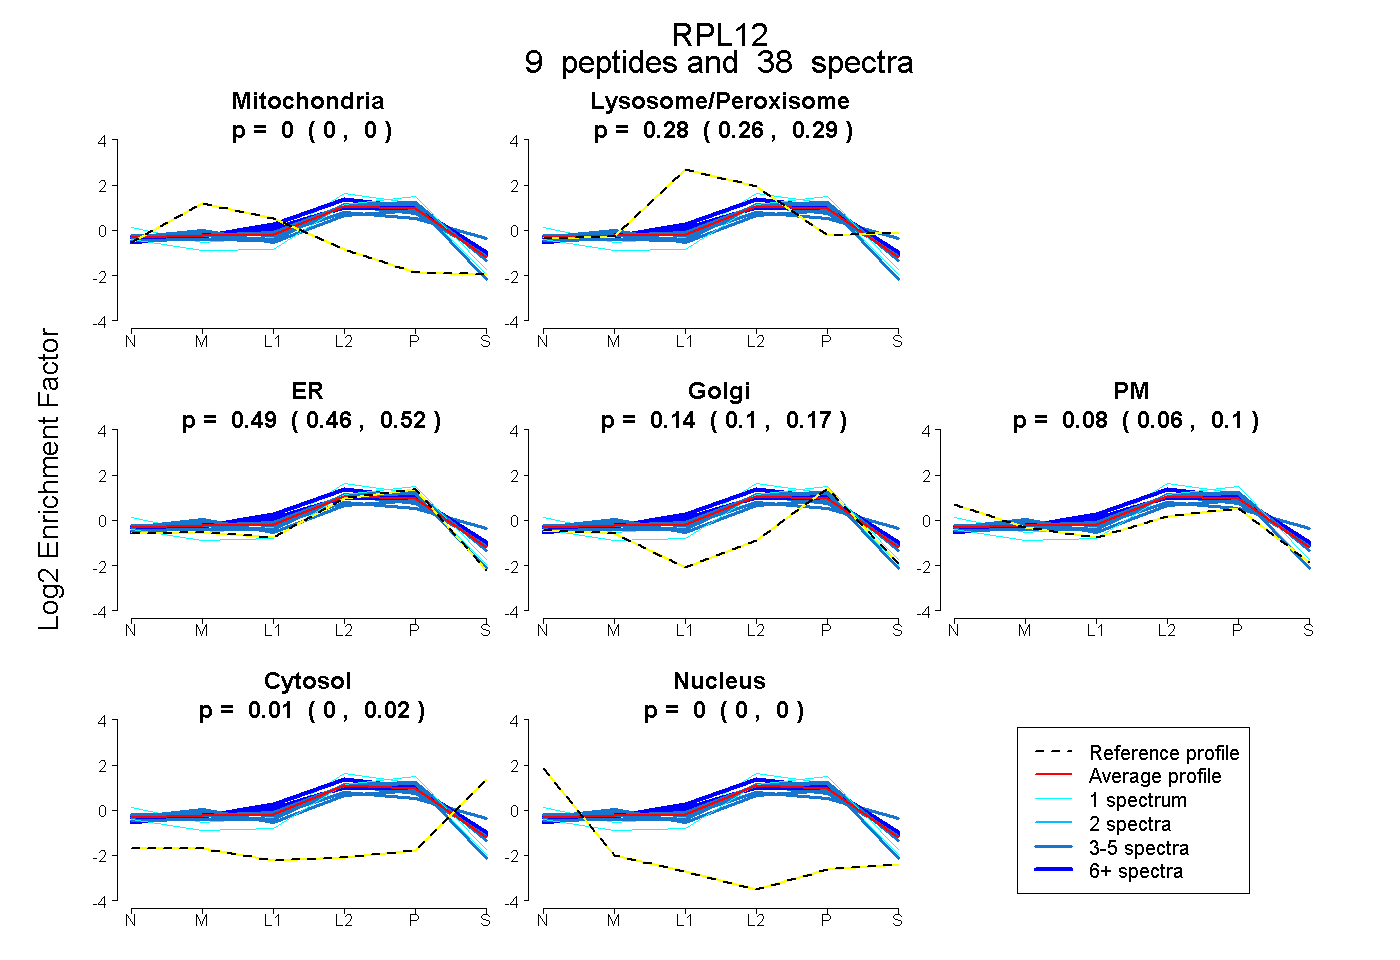
0.000 | 0.000
0.261 | 0.295
0.458 | 0.518
0.103 | 0.172
0.057 | 0.097
0.002 | 0.020
0.000 | 0.000
9peptides
spectra
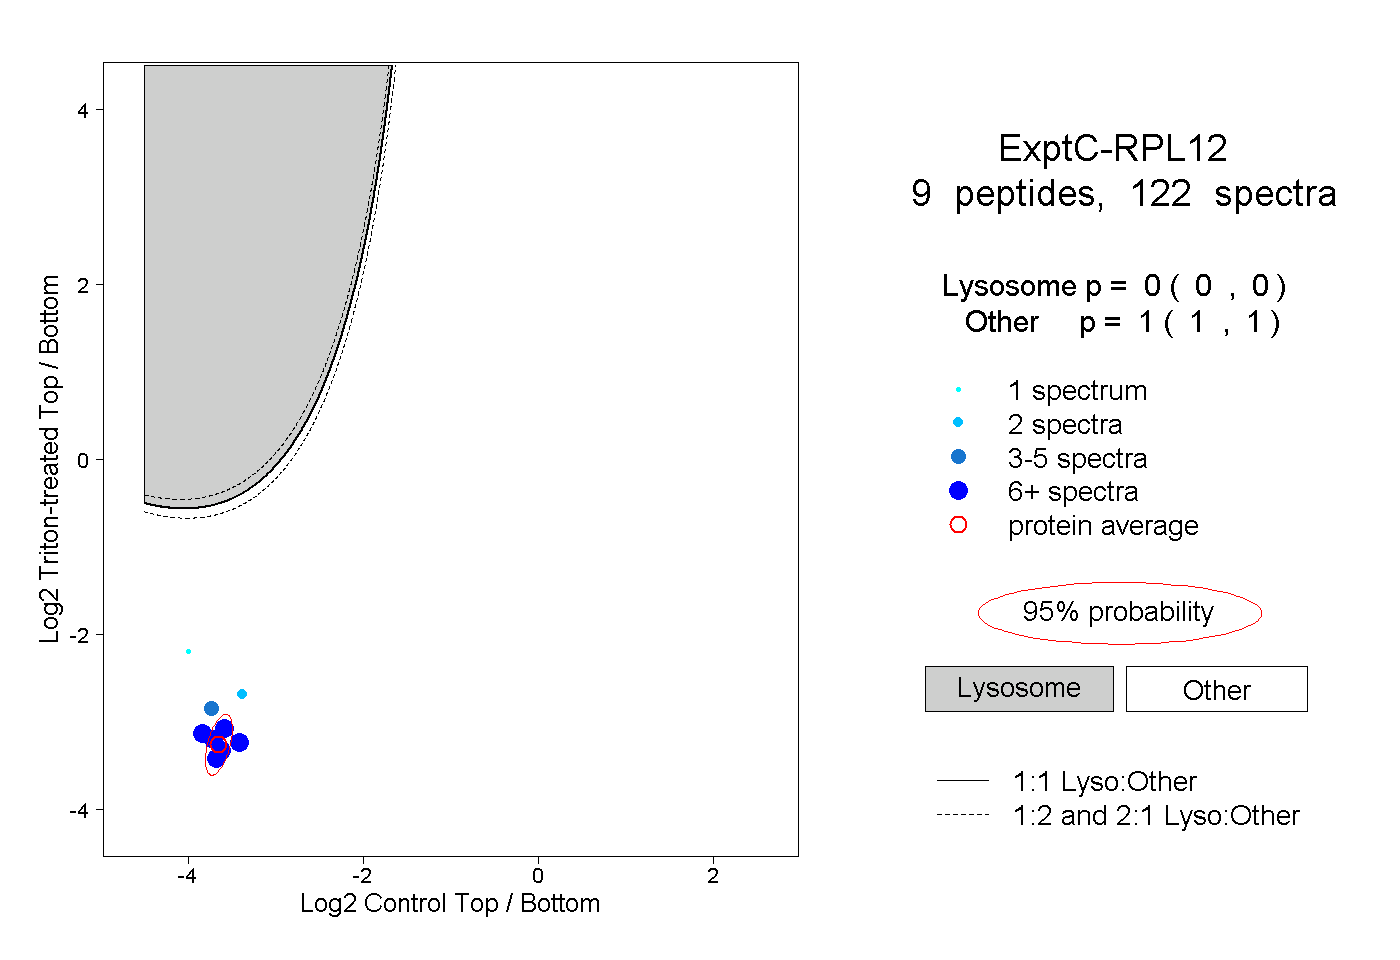
0.000 | 0.000
1.000 | 1.000
4peptides
spectra
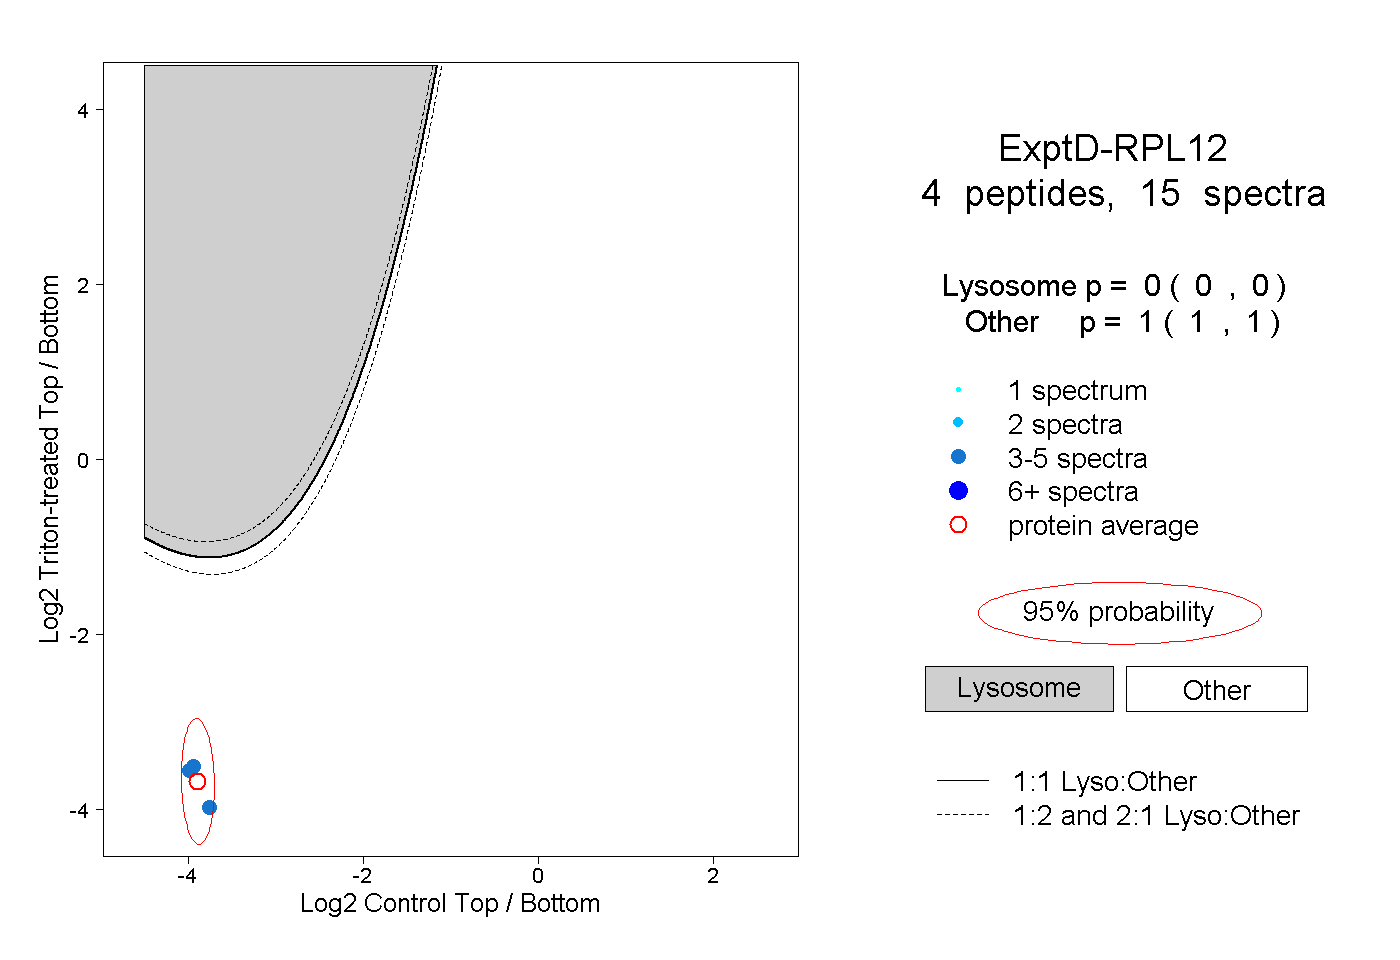
0.000 | 0.000
1.000 | 1.000