 10
10peptides
spectra
0.000 | 0.023
0.000 | 0.000
0.016 | 0.035
0.800 | 0.819
0.000 | 0.000
0.000 | 0.000
0.112 | 0.136
0.016 | 0.031
| Plot | Mito | Lyso | Perox | ER | Golgi | PM | Cytosol | Nucleus | |||||
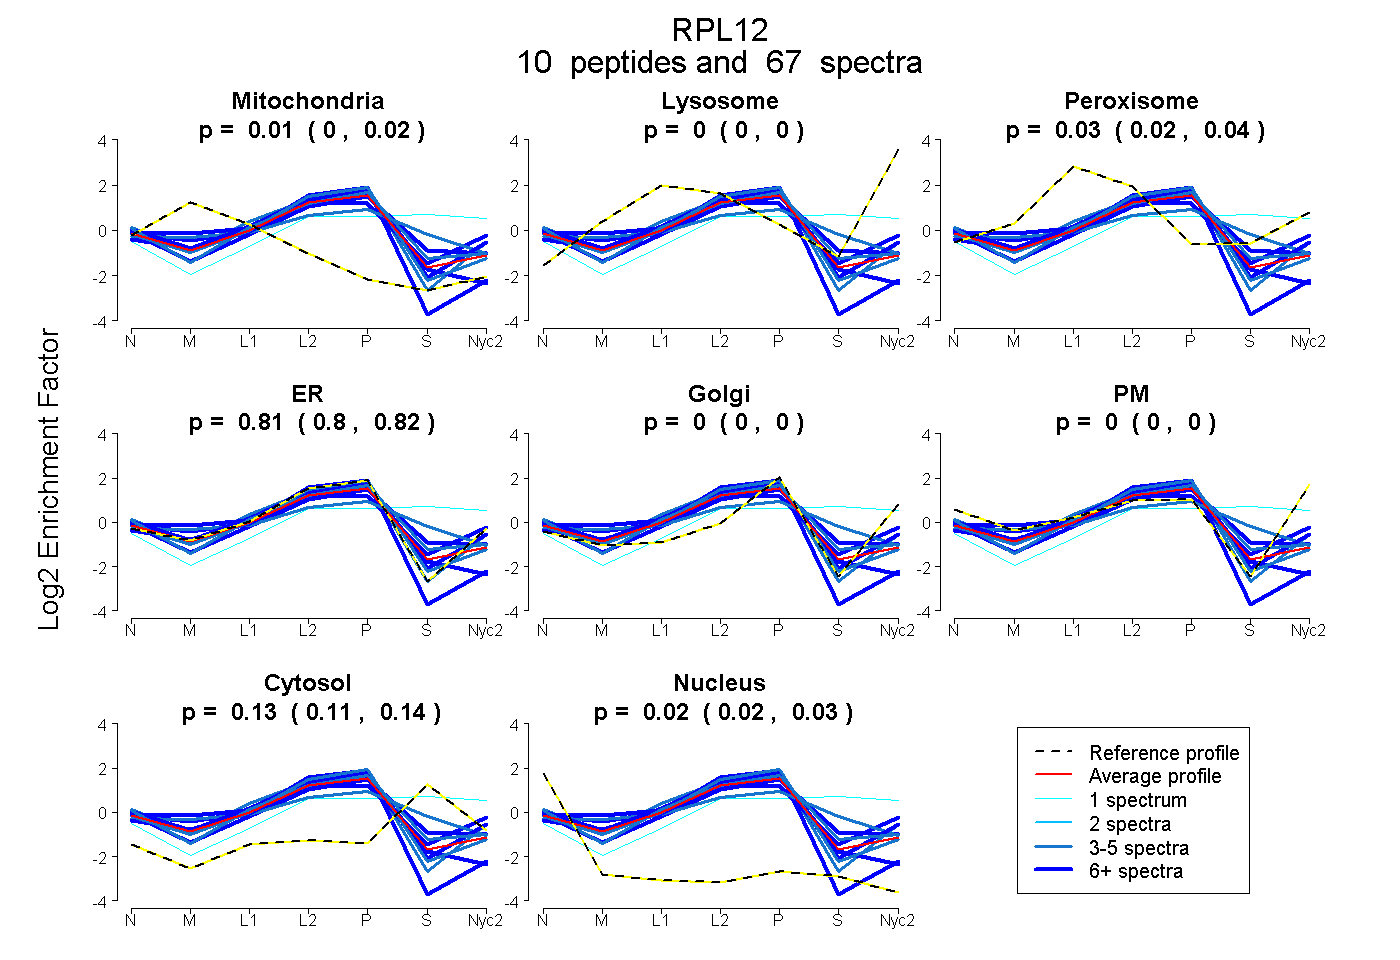
| Expt A |
10 peptides |
67 spectra |
|
0.013 0.000 | 0.023 |
0.000 0.000 | 0.000 |
0.026 0.016 | 0.035 |
0.811 0.800 | 0.819 |
0.000 0.000 | 0.000 |
0.000 0.000 | 0.000 |
0.126 0.112 | 0.136 |
0.024 0.016 | 0.031 |
| 4 spectra, QAQIEVVPSASALIIK | 0.000 | 0.000 | 0.010 | 0.790 | 0.000 | 0.000 | 0.200 | 0.000 | ||
| 9 spectra, ITIQNR | 0.000 | 0.000 | 0.055 | 0.887 | 0.000 | 0.000 | 0.039 | 0.019 | ||
| 4 spectra, ATGDWK | 0.000 | 0.000 | 0.029 | 0.941 | 0.000 | 0.000 | 0.000 | 0.030 | ||
| 7 spectra, HNGNITFDEIVNIAR | 0.054 | 0.000 | 0.145 | 0.611 | 0.000 | 0.088 | 0.103 | 0.000 | ||
| 6 spectra, ELSGTIK | 0.081 | 0.000 | 0.000 | 0.862 | 0.000 | 0.000 | 0.000 | 0.057 | ||
| 5 spectra, VGDDIAK | 0.000 | 0.000 | 0.000 | 0.926 | 0.000 | 0.000 | 0.031 | 0.043 | ||
| 5 spectra, HPHDIIDDINSSAVECPAS | 0.042 | 0.000 | 0.152 | 0.483 | 0.000 | 0.000 | 0.323 | 0.000 | ||
| 1 spectrum, CTGGEVGATSALAPK | 0.000 | 0.140 | 0.000 | 0.213 | 0.000 | 0.111 | 0.536 | 0.000 | ||
| 9 spectra, EILGTAQSVGCNVDGR | 0.000 | 0.000 | 0.000 | 0.728 | 0.000 | 0.000 | 0.272 | 0.000 | ||
| 17 spectra, IGPLGLSPK | 0.066 | 0.000 | 0.000 | 0.797 | 0.000 | 0.000 | 0.076 | 0.061 |
| Plot | Mito | Lyso or Perox | ER | Golgi | PM | Cytosol | Nucleus | ||||||
| Expt B |
9 peptides |
38 spectra |
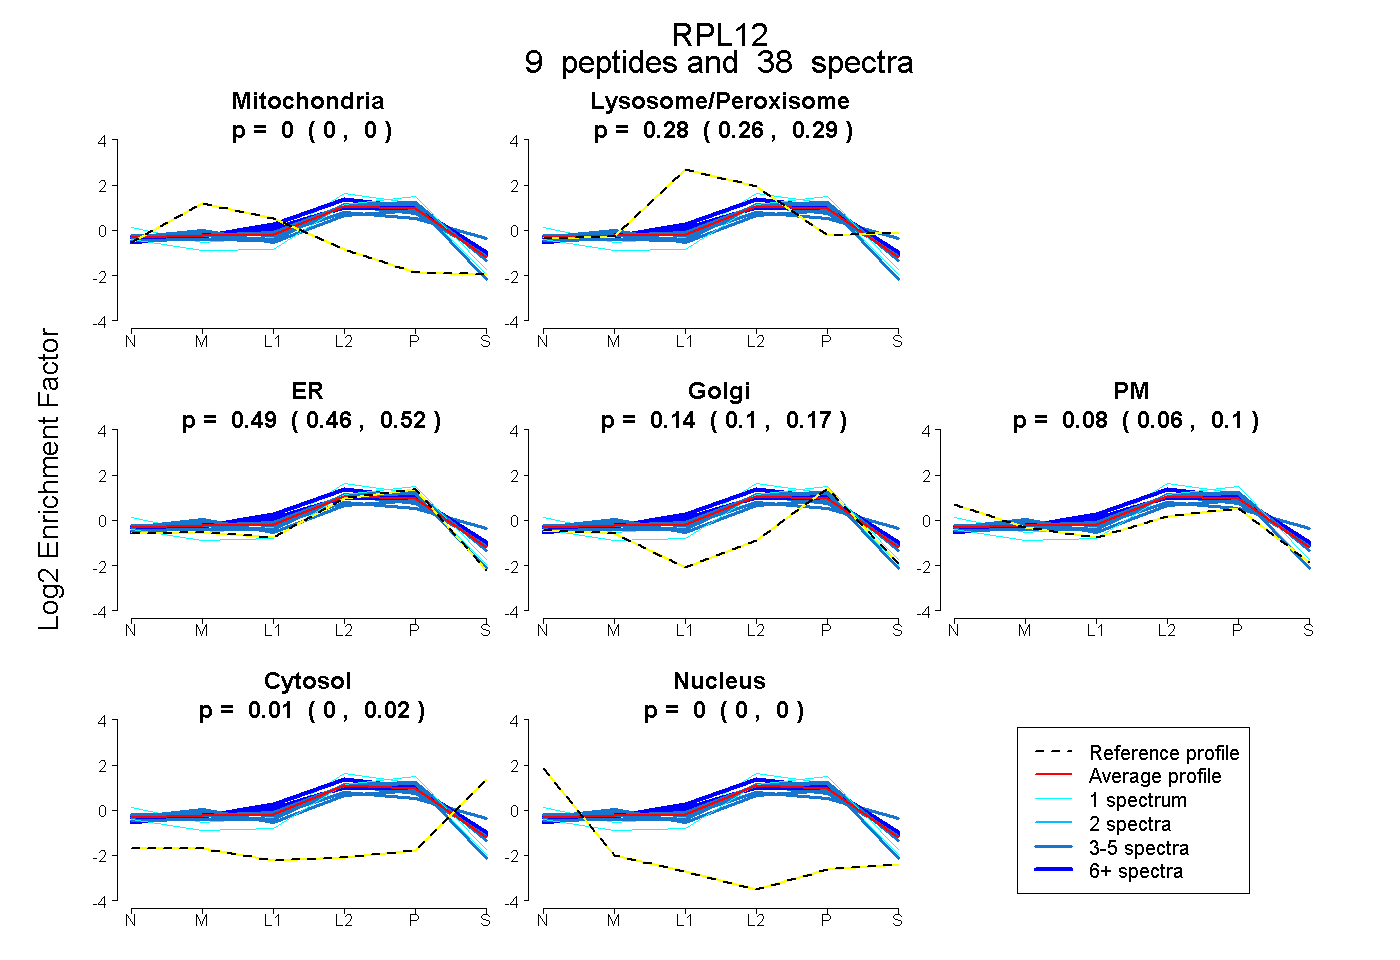 |
0.000 0.000 | 0.000 |
0.279 0.261 | 0.295 |
0.489 0.458 | 0.518 |
0.142 0.103 | 0.172 |
0.078 0.057 | 0.097 |
0.012 0.002 | 0.020 |
0.000 0.000 | 0.000 |
|||
| Plot | Lyso | Other | |||||||||||
| Expt C |
9 peptides |
122 spectra |
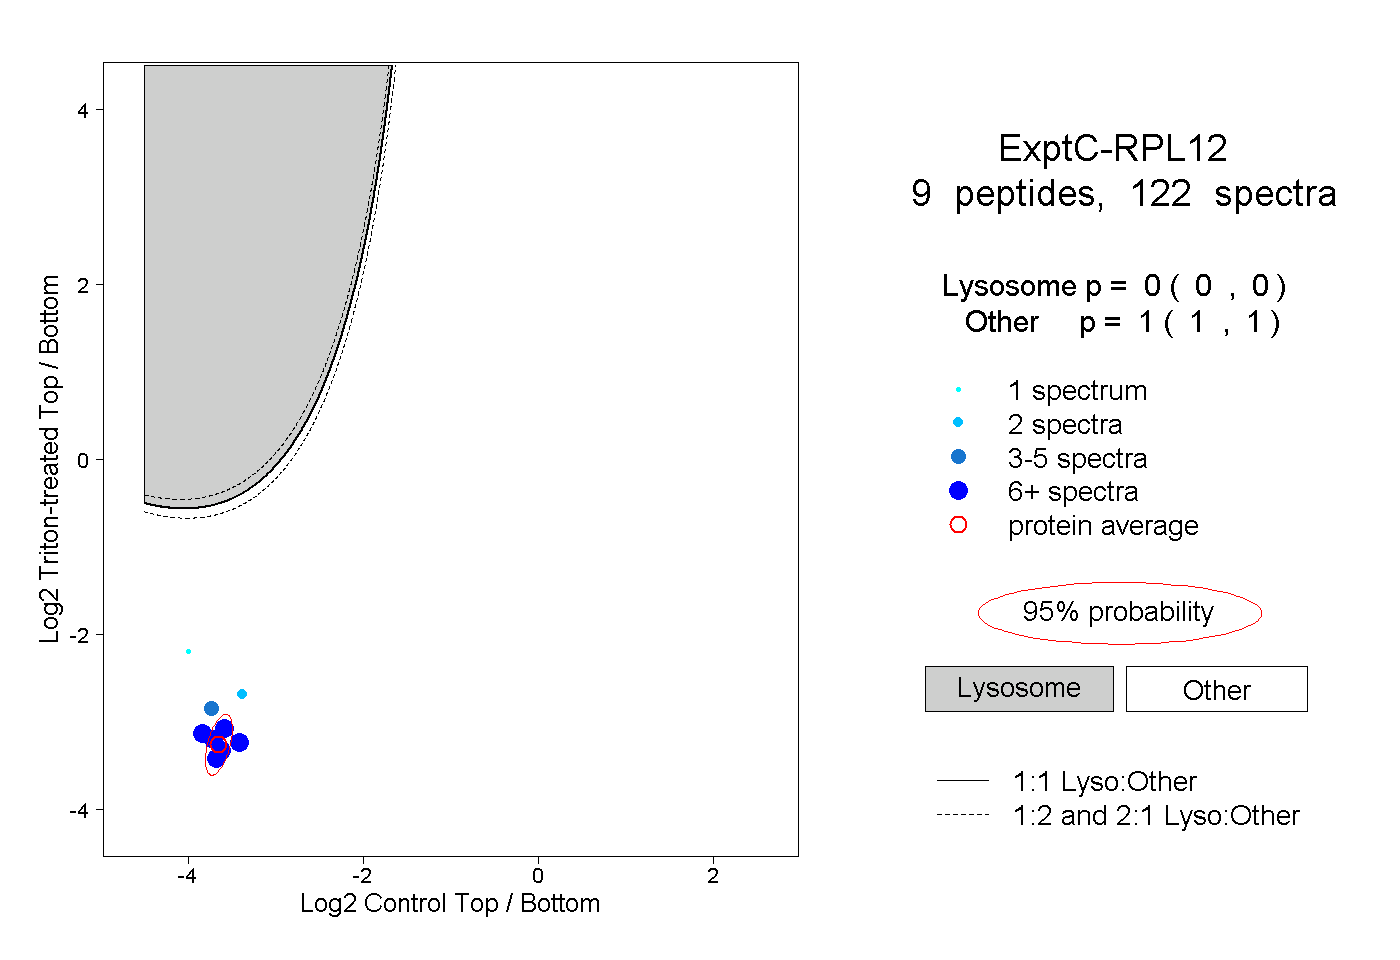 |
0.000 0.000 | 0.000 |
1.000 1.000 | 1.000 |
||||||||
| Plot | Lyso | Other | |||||||||||
| Expt D |
4 peptides |
15 spectra |
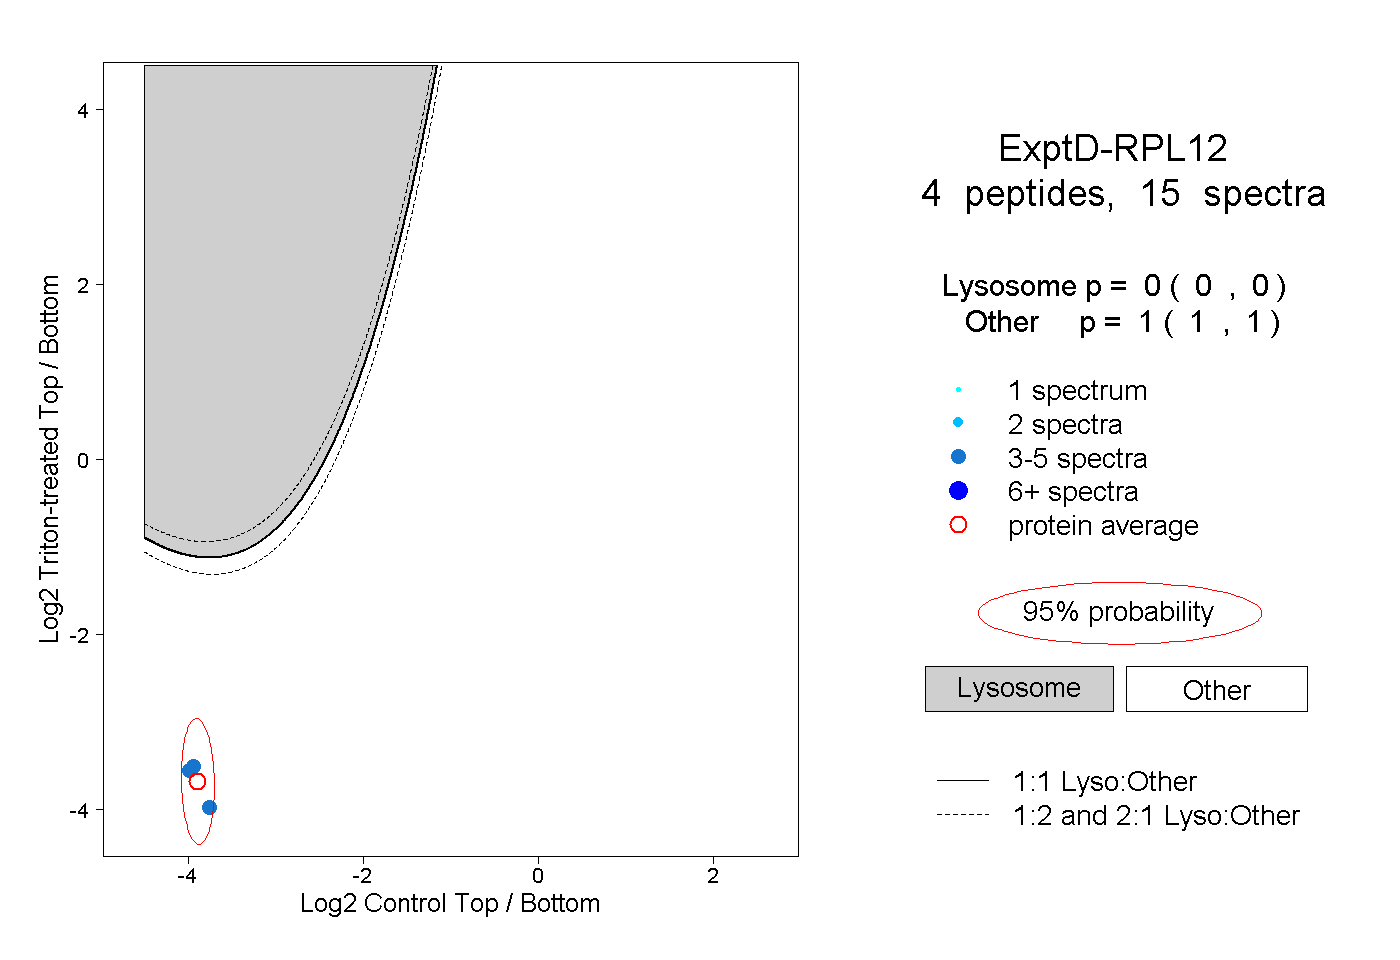 |
0.000 0.000 | 0.000 |
1.000 1.000 | 1.000 |