 10
10peptides
spectra

0.000 | 0.000
0.032 | 0.048
0.000 | 0.000
0.000 | 0.000
0.000 | 0.000
0.000 | 0.000
0.951 | 0.966
0.000 | 0.000
4peptides
spectra
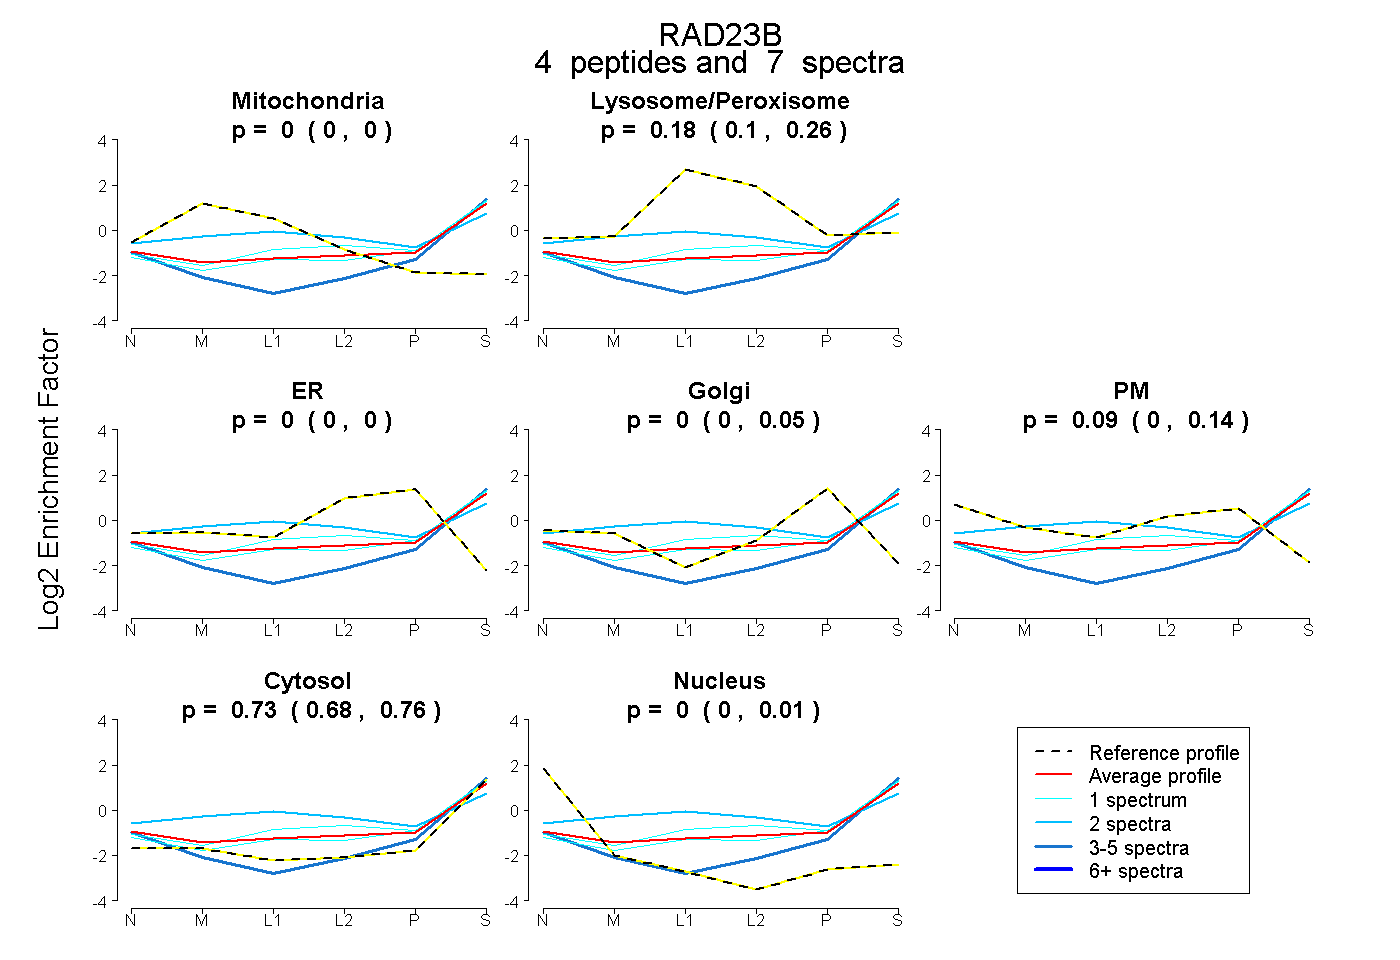
0.000 | 0.000
0.103 | 0.258
0.000 | 0.001
0.000 | 0.048
0.000 | 0.137
0.684 | 0.756
0.000 | 0.011
9peptides
spectra
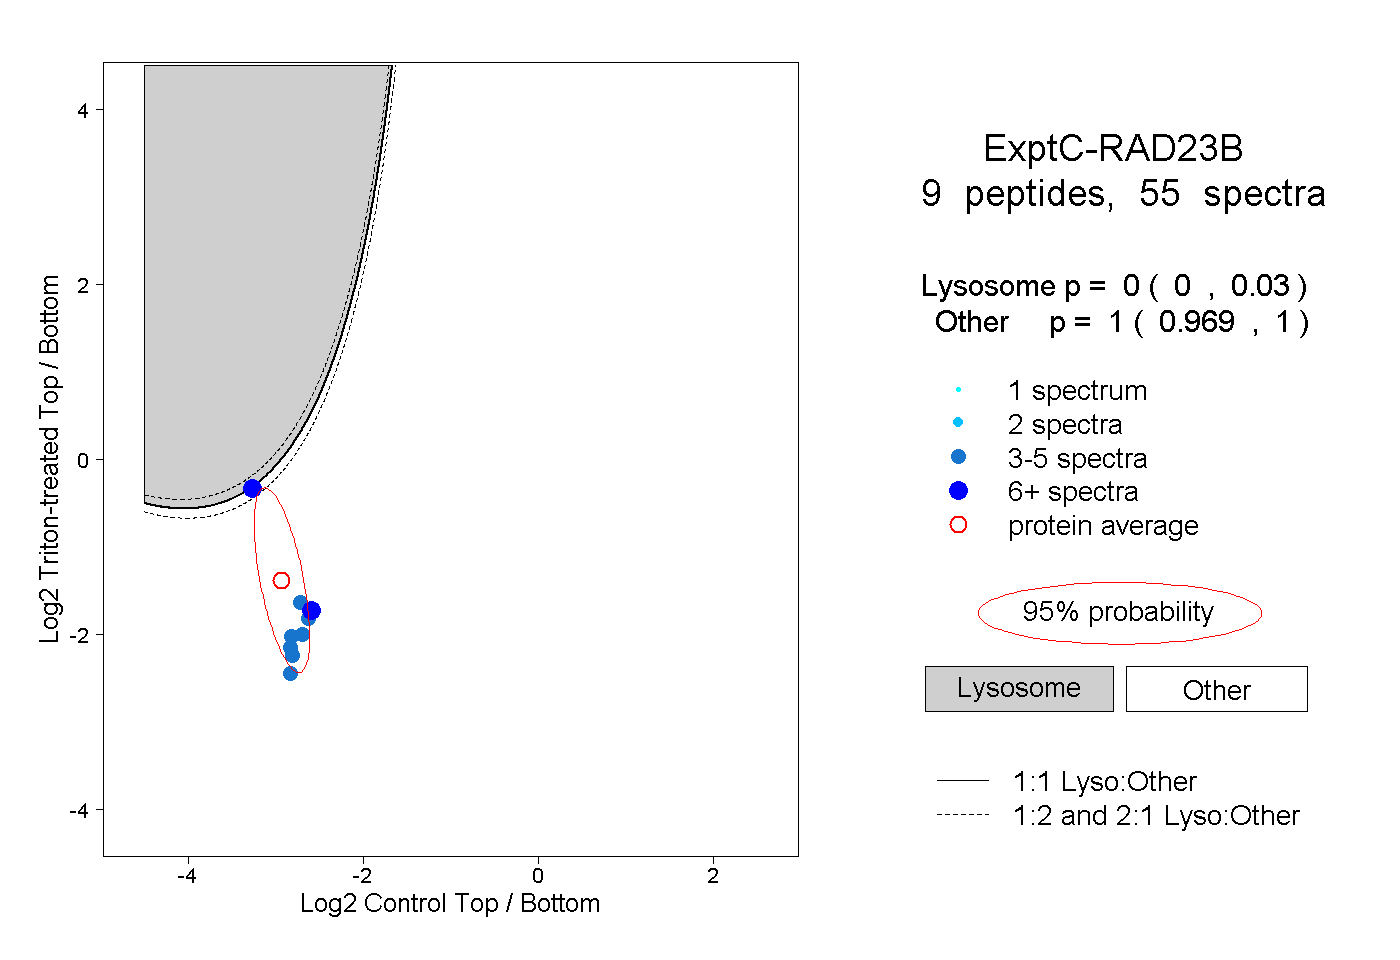
0.000 | 0.030
0.969 | 1.000
1peptide
spectrum
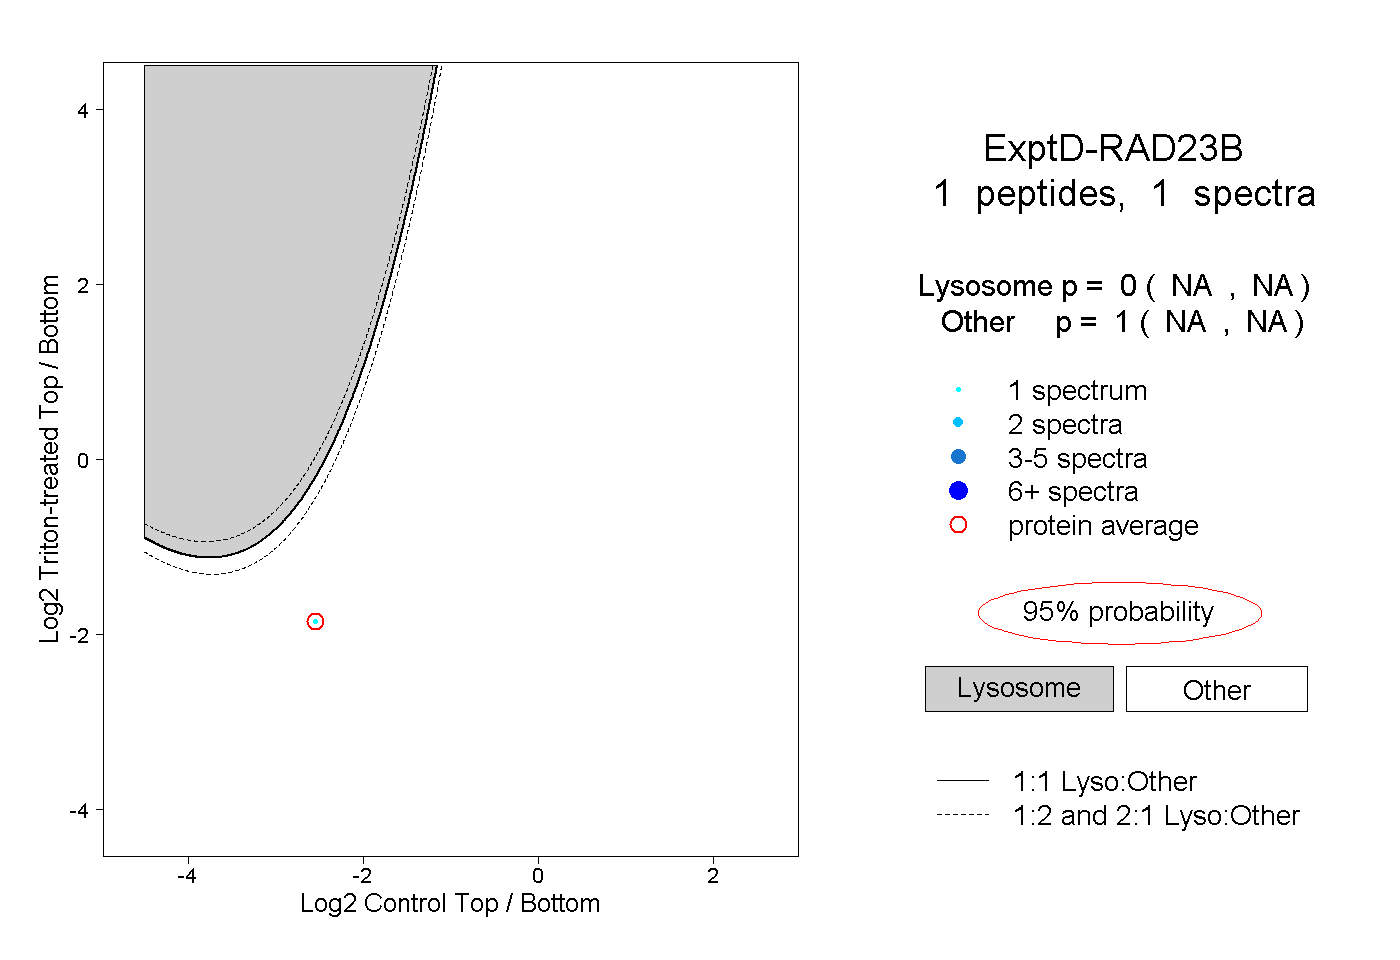
NA | NA
NA | NA