RAD23B
[ENSRNOP00000021629]
Main page
| | | Plot |
Mito |
Lyso |
|
Perox |
ER |
Golgi |
PM |
Cytosol |
Nucleus |
|
| Expt A |
 10
10
peptides |
38
spectra |
 |
0.000
0.000 | 0.000 |
0.041
0.032 | 0.048 |
|
0.000
0.000 | 0.000 |
0.000
0.000 | 0.000 |
0.000
0.000 | 0.000 |
0.000
0.000 | 0.000 |
0.959
0.951 | 0.966 |
0.000
0.000 | 0.000 |
|
| | | Plot |
Mito |
|
Lyso or Perox |
|
ER |
Golgi |
PM |
Cytosol |
Nucleus |
|
| Expt B |
4
peptides |
7
spectra |
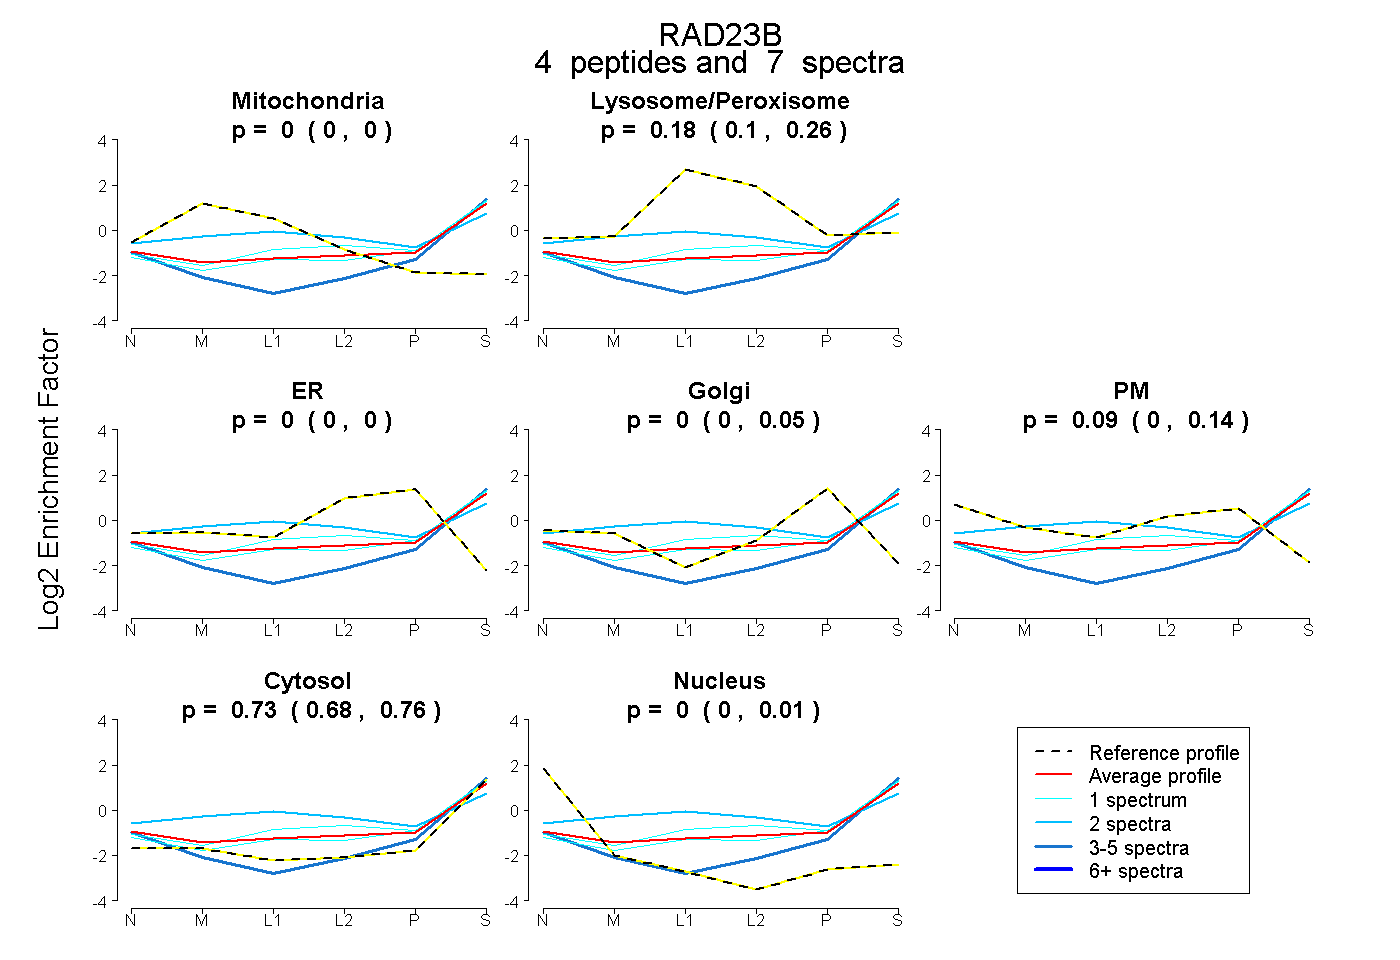 |
0.000
0.000 | 0.000 |
|
0.181
0.103 | 0.258 |
|
0.000
0.000 | 0.001 |
0.000
0.000 | 0.048 |
0.092
0.000 | 0.137 |
0.727
0.684 | 0.756 |
0.000
0.000 | 0.011 |
|
| 1 spectrum, LIYAGK |
0.000 |
|
0.177 |
|
0.000 |
0.045 |
0.000 |
0.778 |
0.000 |
|
| 2 spectra, NQPQFQQMR |
0.058 |
|
0.392 |
|
0.000 |
0.000 |
0.097 |
0.452 |
0.000 |
|
| 3 spectra, EQVIAALR |
0.000 |
|
0.000 |
|
0.000 |
0.041 |
0.000 |
0.891 |
0.068 |
|
| 1 spectrum, IDIDPEETVK |
0.000 |
|
0.304 |
|
0.000 |
0.009 |
0.000 |
0.687 |
0.000 |
|
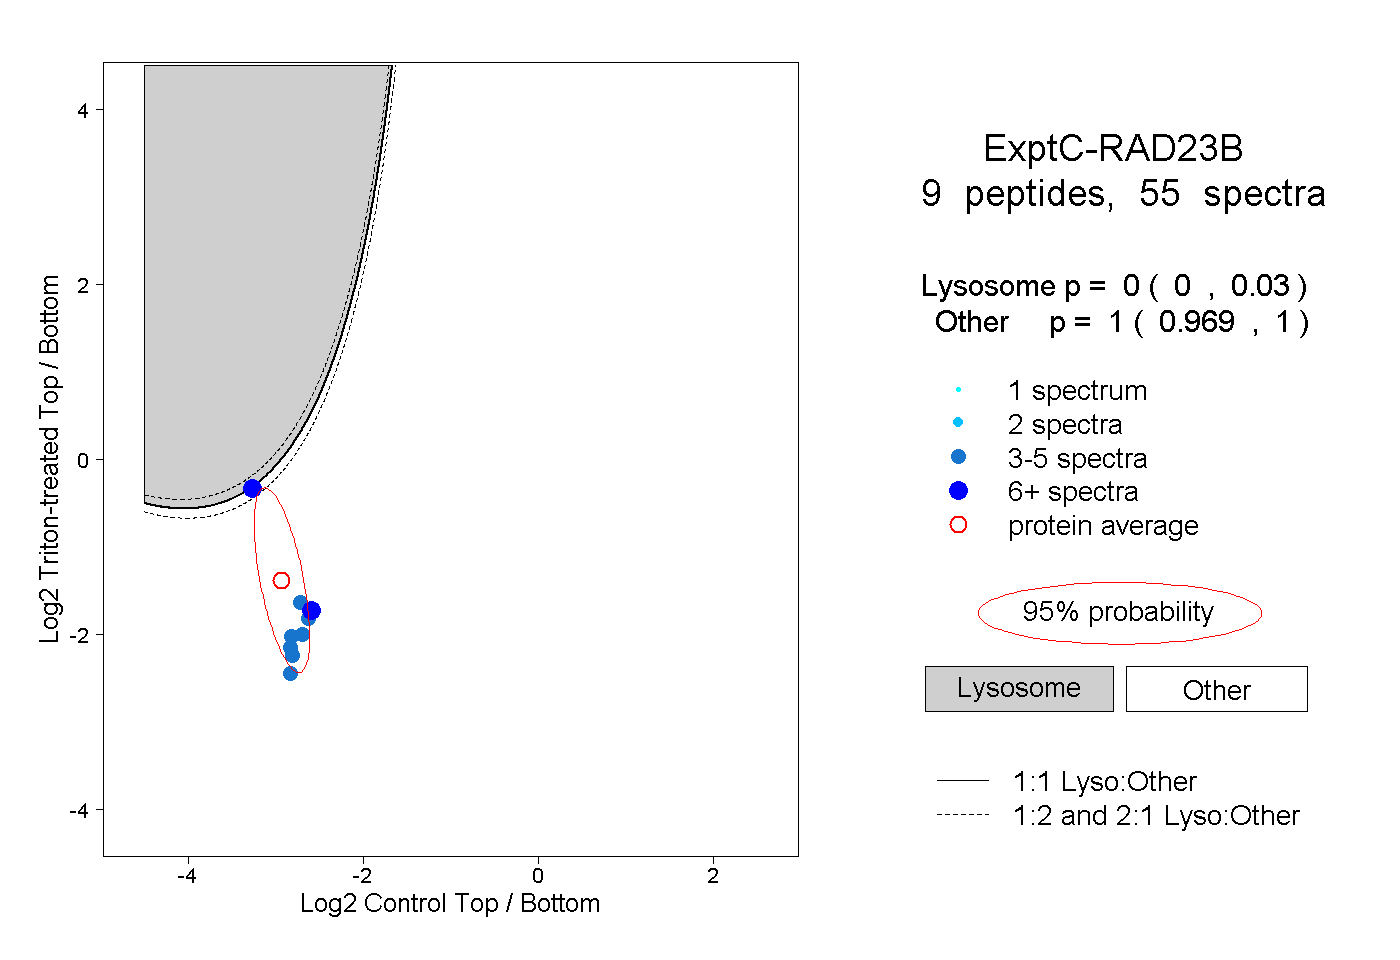
| | | Plot |
|
Lyso |
|
|
|
|
|
|
|
Other |
| Expt C |
9
peptides |
55
spectra |
 |
|
0.000
0.000 | 0.030 |
|
|
|
|
|
|
|
1.000
0.969 | 1.000 |
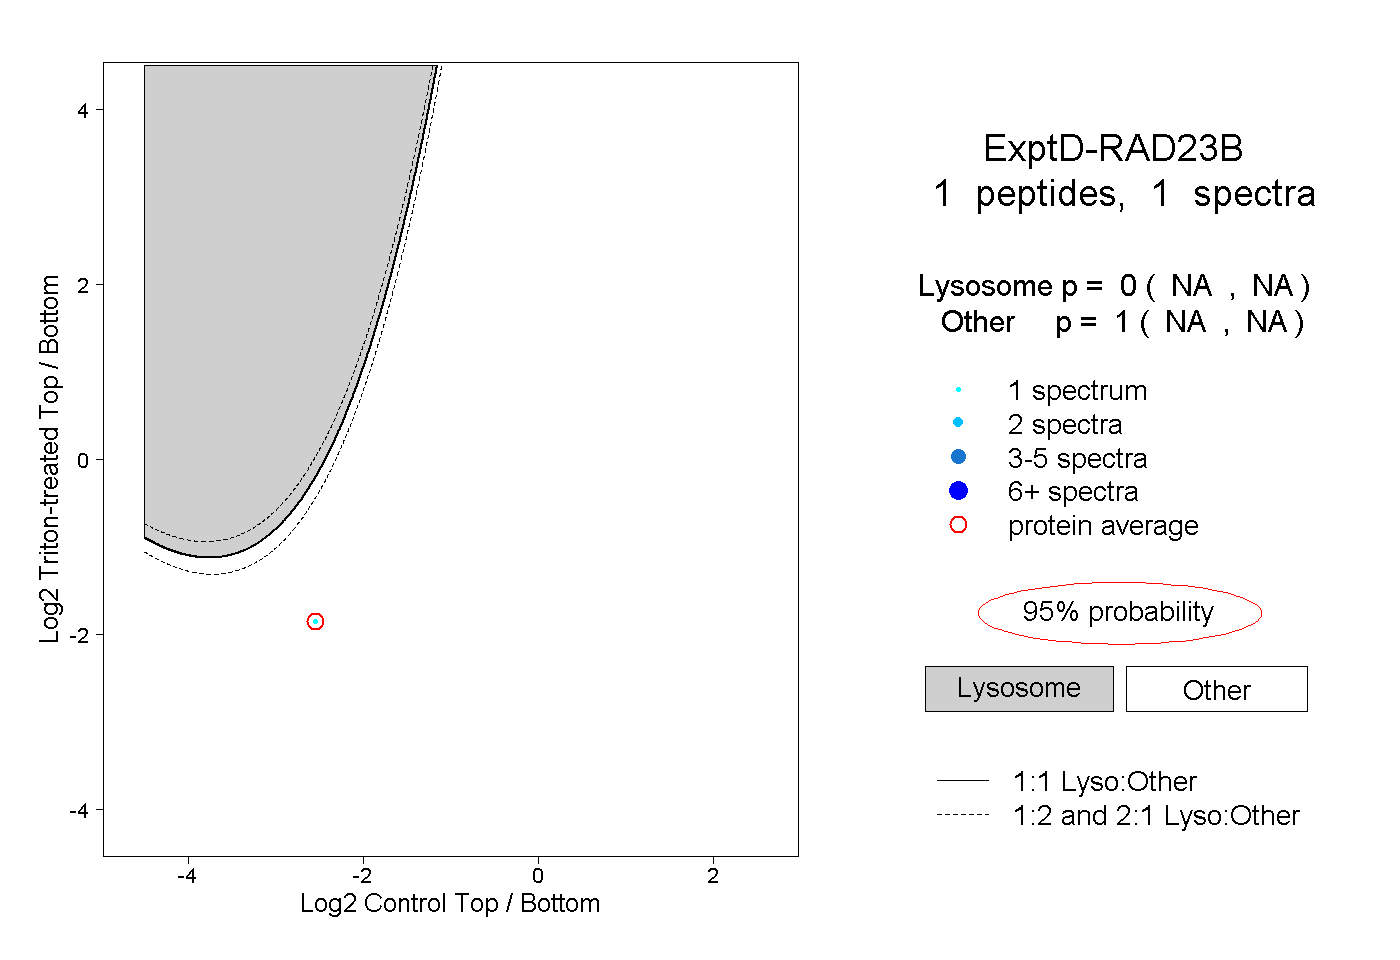
| | | Plot |
|
Lyso |
|
|
|
|
|
|
|
Other |
| Expt D |
1
peptide |
1
spectrum |
 |
|
0.000
NA | NA |
|
|
|
|
|
|
|
1.000
NA | NA |