 5
5peptides
spectra
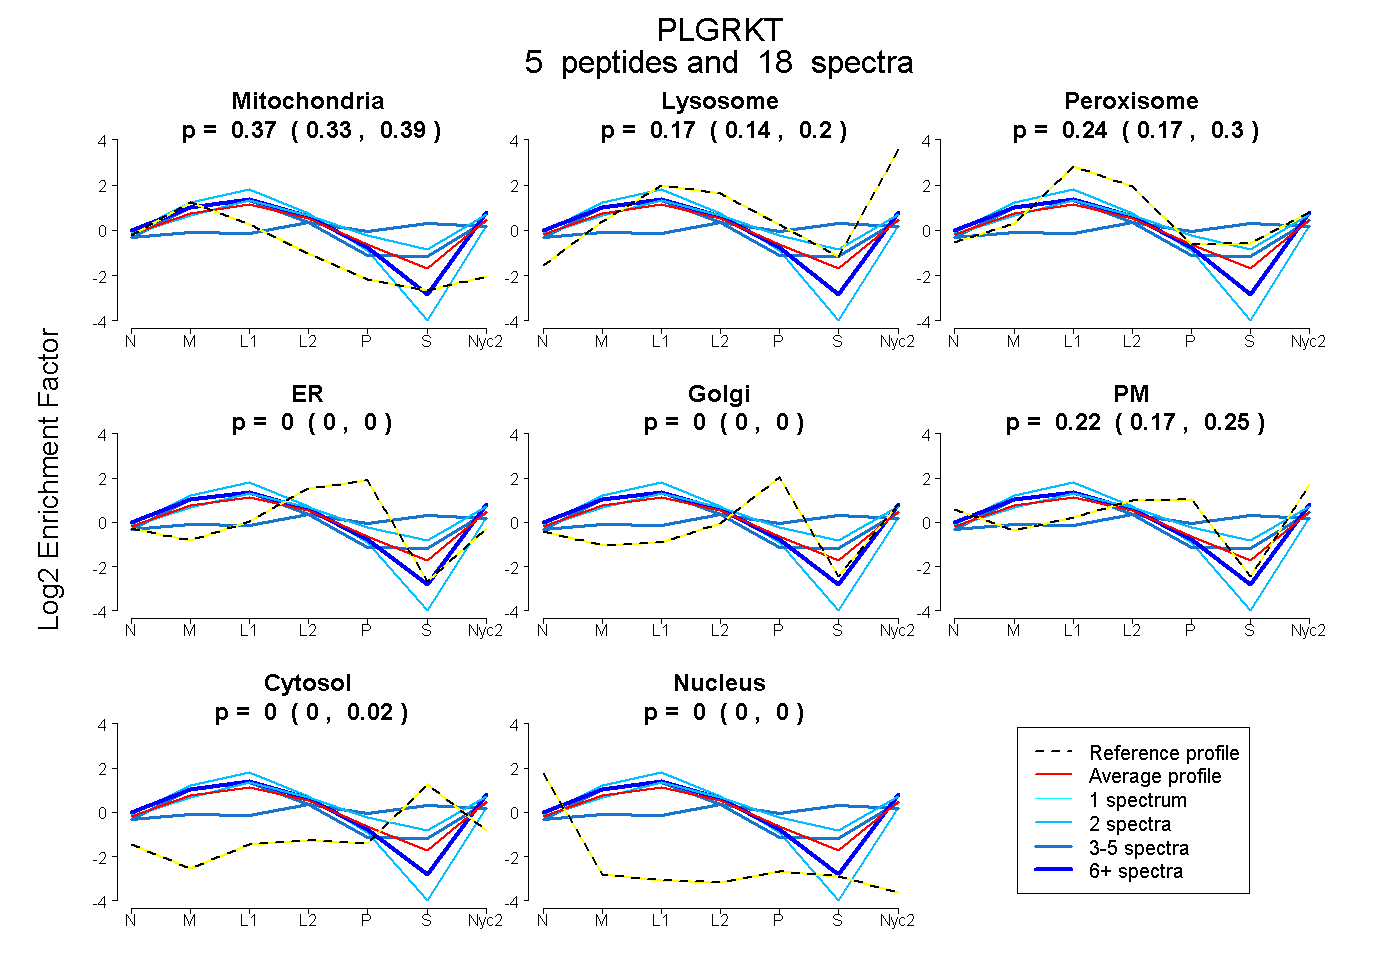
0.331 | 0.390
0.144 | 0.195
0.174 | 0.301
0.000 | 0.000
0.000 | 0.000
0.174 | 0.249
0.000 | 0.023
0.000 | 0.000
1peptide
spectra
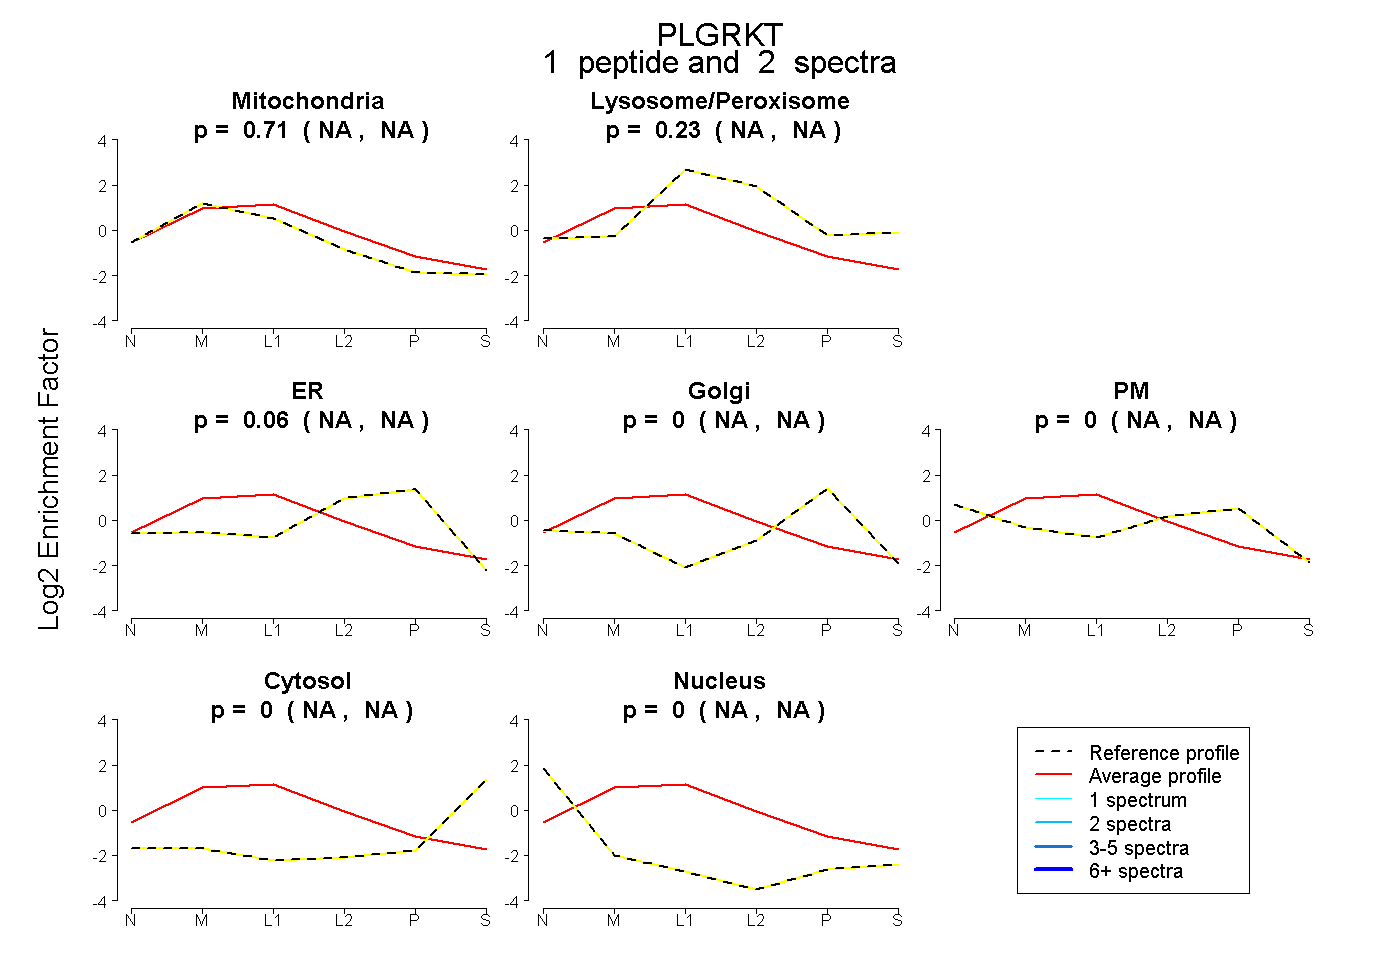
NA | NA
NA | NA
NA | NA
NA | NA
NA | NA
NA | NA
NA | NA
5peptides
spectra
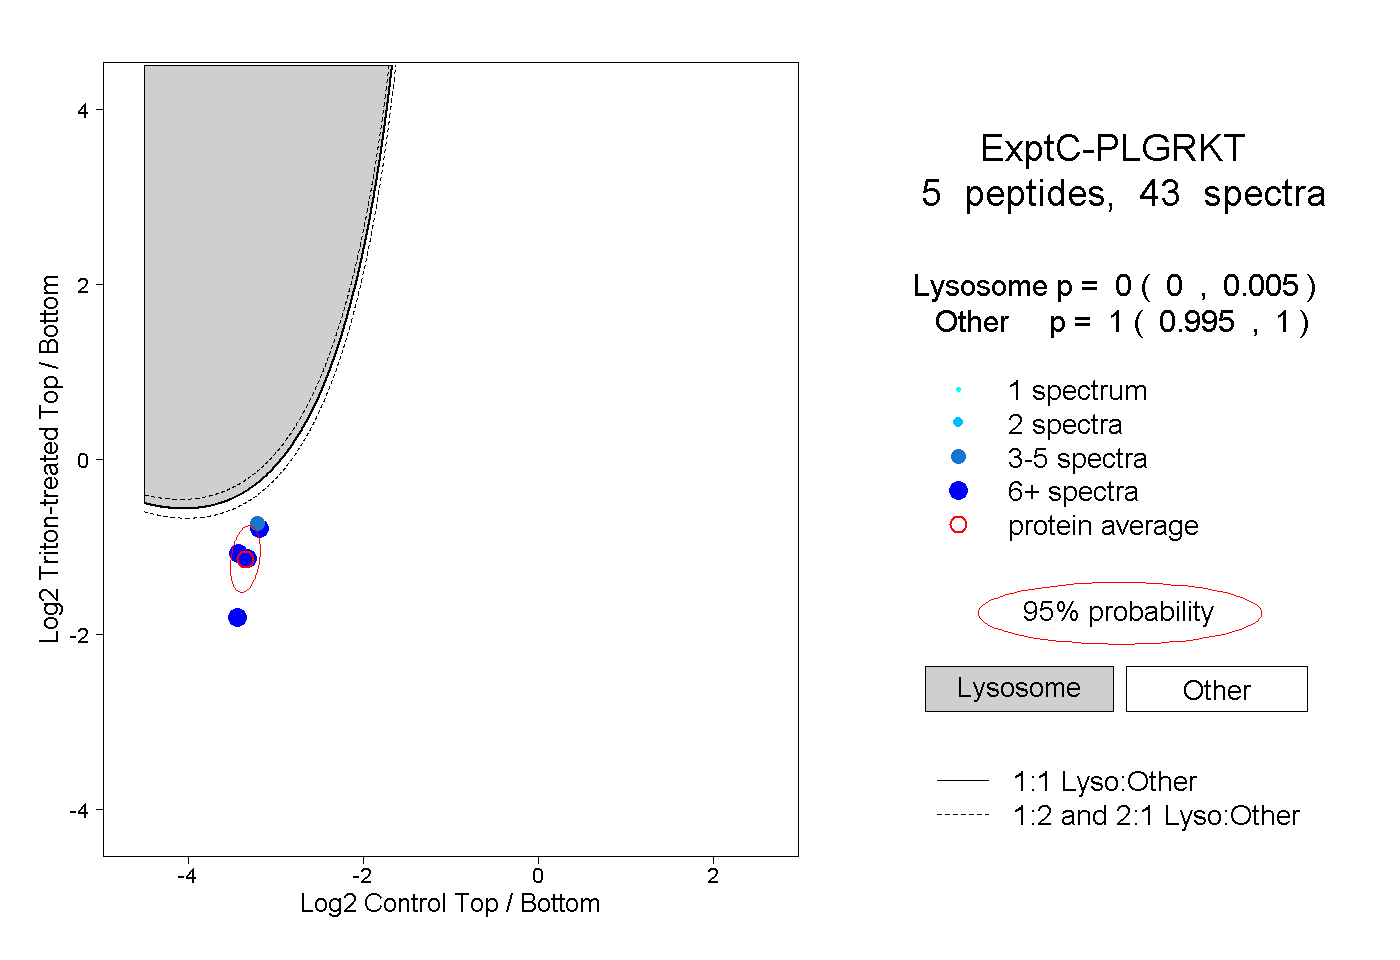
0.000 | 0.005
0.995 | 1.000