PLGRKT
[ENSRNOP00000021545]
Main page
| | | Plot |
Mito |
Lyso |
|
Perox |
ER |
Golgi |
PM |
Cytosol |
Nucleus |
|
| Expt A |
 5
5
peptides |
18
spectra |
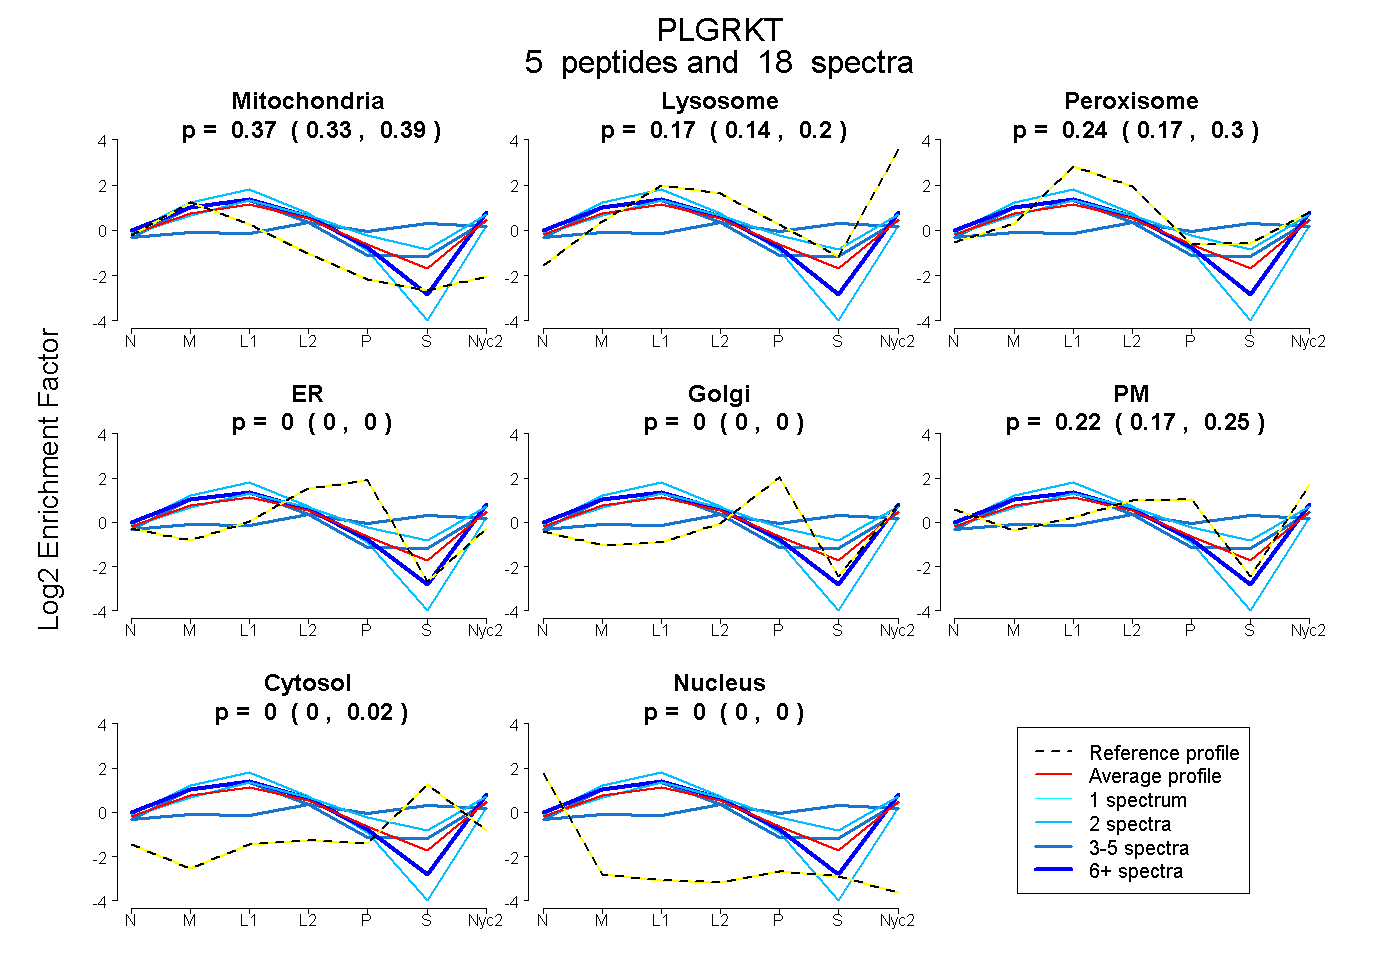 |
0.368
0.331 | 0.390 |
0.172
0.144 | 0.195 |
|
0.242
0.174 | 0.301 |
0.000
0.000 | 0.000 |
0.000
0.000 | 0.000 |
0.218
0.174 | 0.249 |
0.000
0.000 | 0.023 |
0.000
0.000 | 0.000 |
|
| | | Plot |
Mito |
|
Lyso or Perox |
|
ER |
Golgi |
PM |
Cytosol |
Nucleus |
|
| Expt B |
1
peptide |
2
spectra |
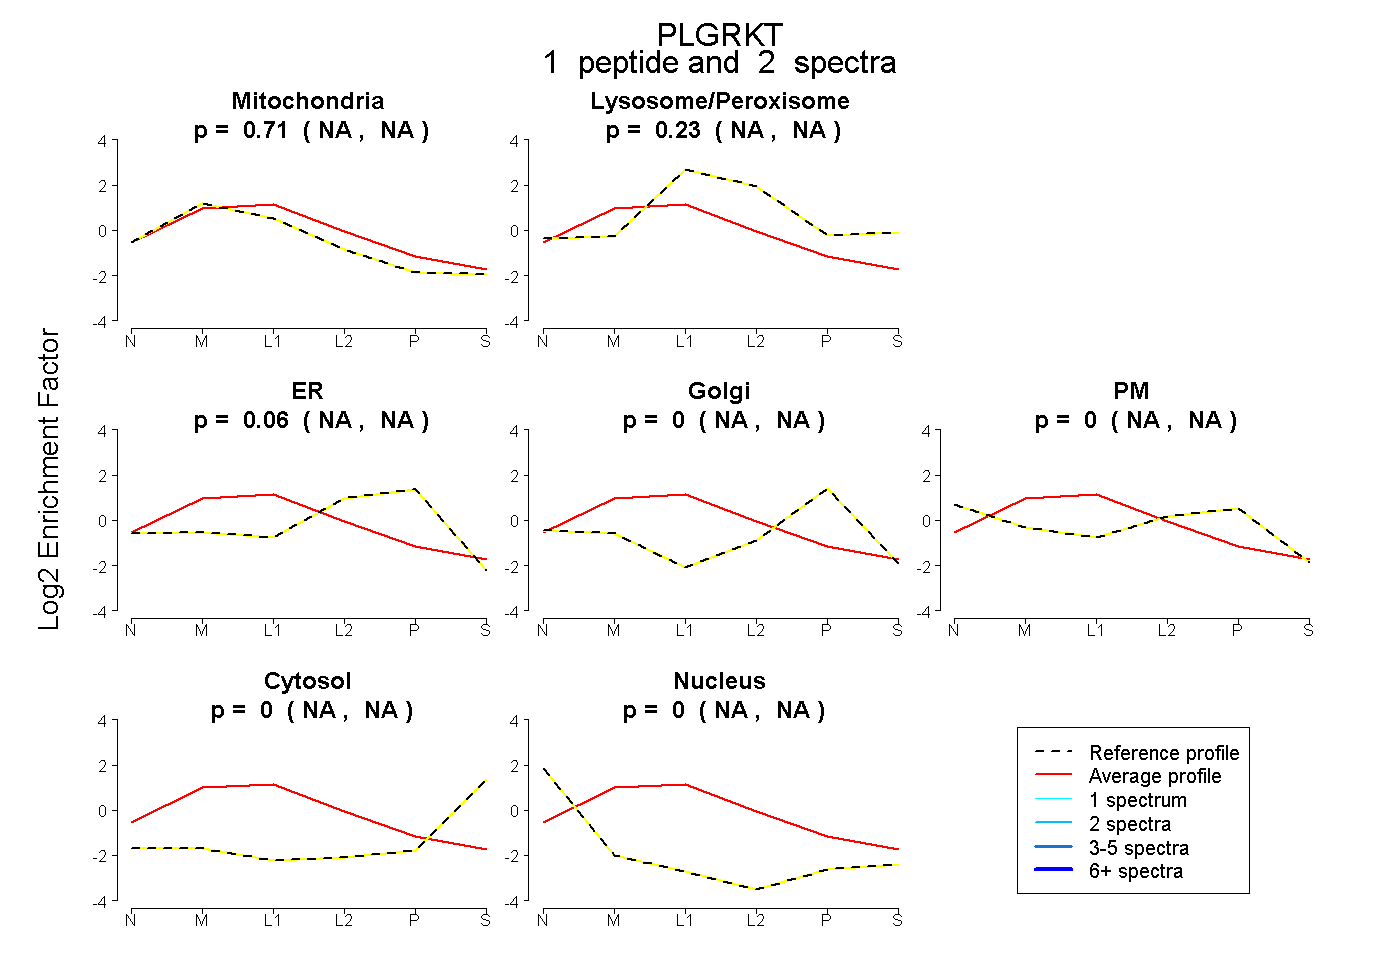 |
0.710
NA | NA |
|
0.233
NA | NA |
|
0.057
NA | NA |
0.000
NA | NA |
0.000
NA | NA |
0.000
NA | NA |
0.000
NA | NA |
|
| | | Plot |
|
Lyso |
|
|
|
|
|
|
|
Other |
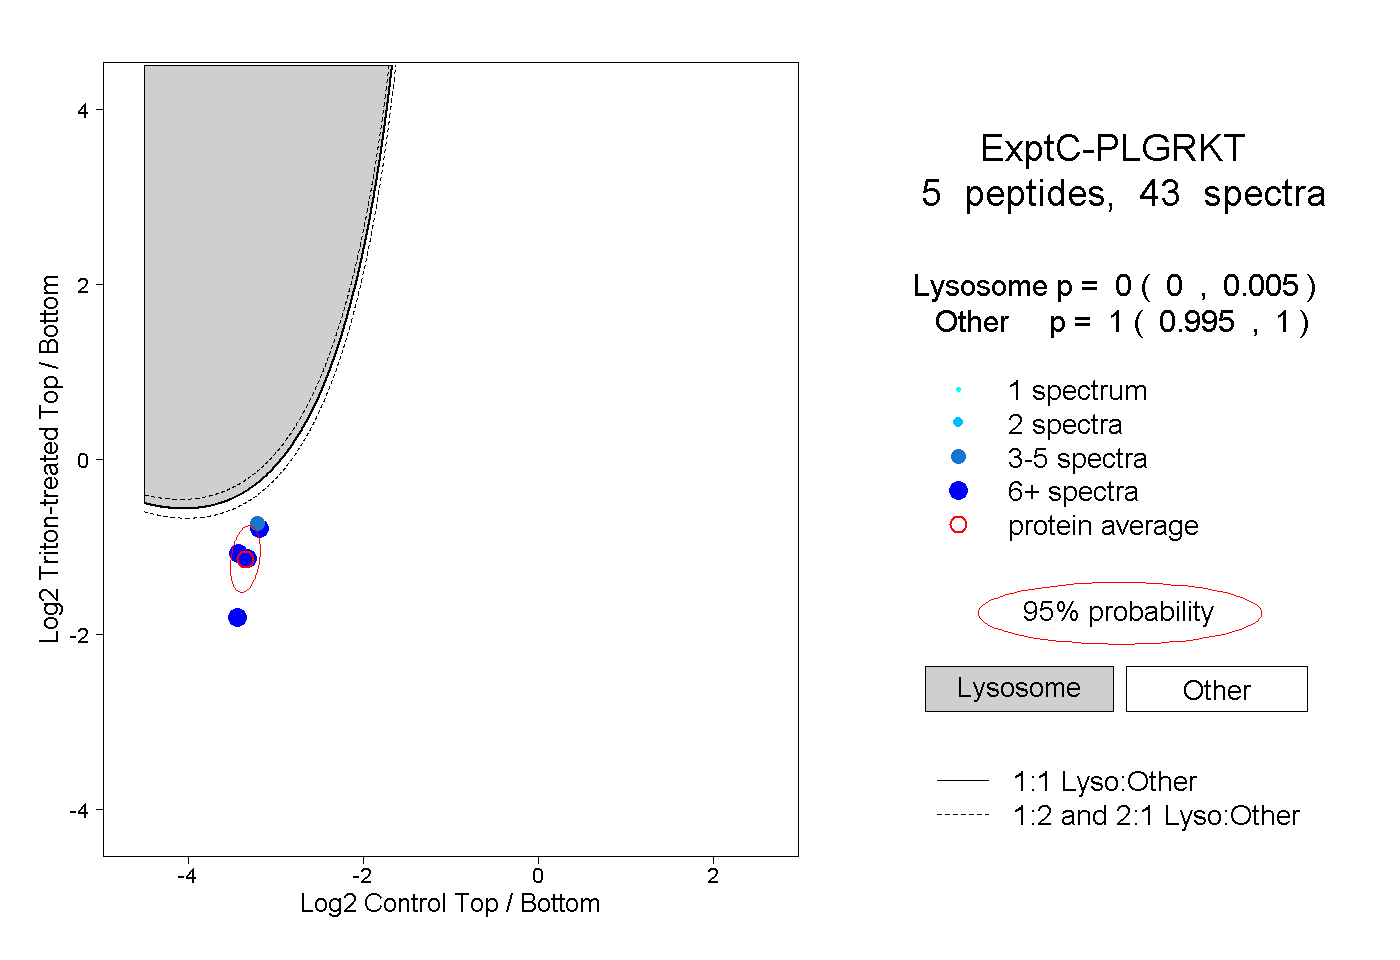
| Expt C |
5
peptides |
43
spectra |
 |
|
0.000
0.000 | 0.005 |
|
|
|
|
|
|
|
1.000
0.995 | 1.000 |
| 7 spectra, GLITFESLEK |
|
0.004 |
|
|
|
|
|
|
|
0.996 |
| 14 spectra, SMNENMK |
|
0.001 |
|
|
|
|
|
|
|
0.999 |
| 3 spectra, SEAEDILETEK |
|
0.009 |
|
|
|
|
|
|
|
0.991 |
| 7 spectra, NQQEFMVMHAR |
|
0.000 |
|
|
|
|
|
|
|
1.000 |
| 12 spectra, QLIMQNEMR |
|
0.000 |
|
|
|
|
|
|
|
1.000 |