 5
5peptides
spectra
0.331 | 0.390
0.144 | 0.195
0.174 | 0.301
0.000 | 0.000
0.000 | 0.000
0.174 | 0.249
0.000 | 0.023
0.000 | 0.000
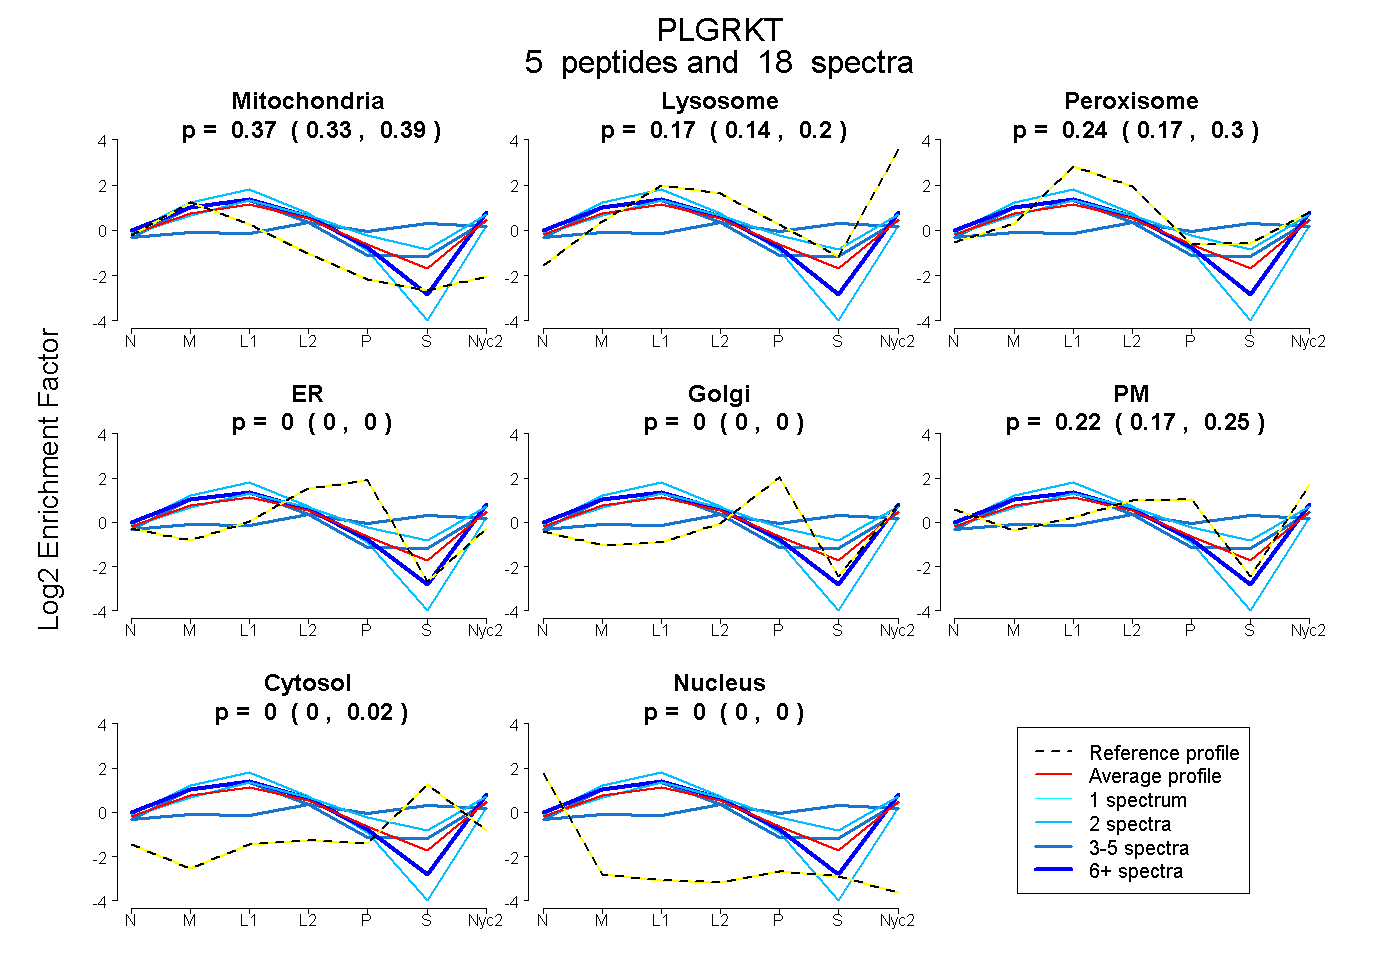
| Plot | Mito | Lyso | Perox | ER | Golgi | PM | Cytosol | Nucleus | |||||
| Expt A |
5 peptides |
18 spectra |
|
0.368 0.331 | 0.390 |
0.172 0.144 | 0.195 |
0.242 0.174 | 0.301 |
0.000 0.000 | 0.000 |
0.000 0.000 | 0.000 |
0.218 0.174 | 0.249 |
0.000 0.000 | 0.023 |
0.000 0.000 | 0.000 |
| 2 spectra, GLITFESLEK | 0.496 | 0.184 | 0.079 | 0.000 | 0.000 | 0.241 | 0.000 | 0.000 | ||
| 2 spectra, SEAEDILETEK | 0.188 | 0.126 | 0.412 | 0.000 | 0.005 | 0.198 | 0.070 | 0.000 | ||
| 3 spectra, NQQEFMVMHAR | 0.031 | 0.000 | 0.304 | 0.000 | 0.046 | 0.228 | 0.392 | 0.000 | ||
| 7 spectra, QMAMQIAWSR | 0.409 | 0.265 | 0.071 | 0.000 | 0.000 | 0.255 | 0.000 | 0.000 | ||
| 4 spectra, QLIMQNEMR | 0.424 | 0.256 | 0.296 | 0.000 | 0.000 | 0.000 | 0.024 | 0.000 |
| Plot | Mito | Lyso or Perox | ER | Golgi | PM | Cytosol | Nucleus | ||||||
| Expt B |
1 peptide |
2 spectra |
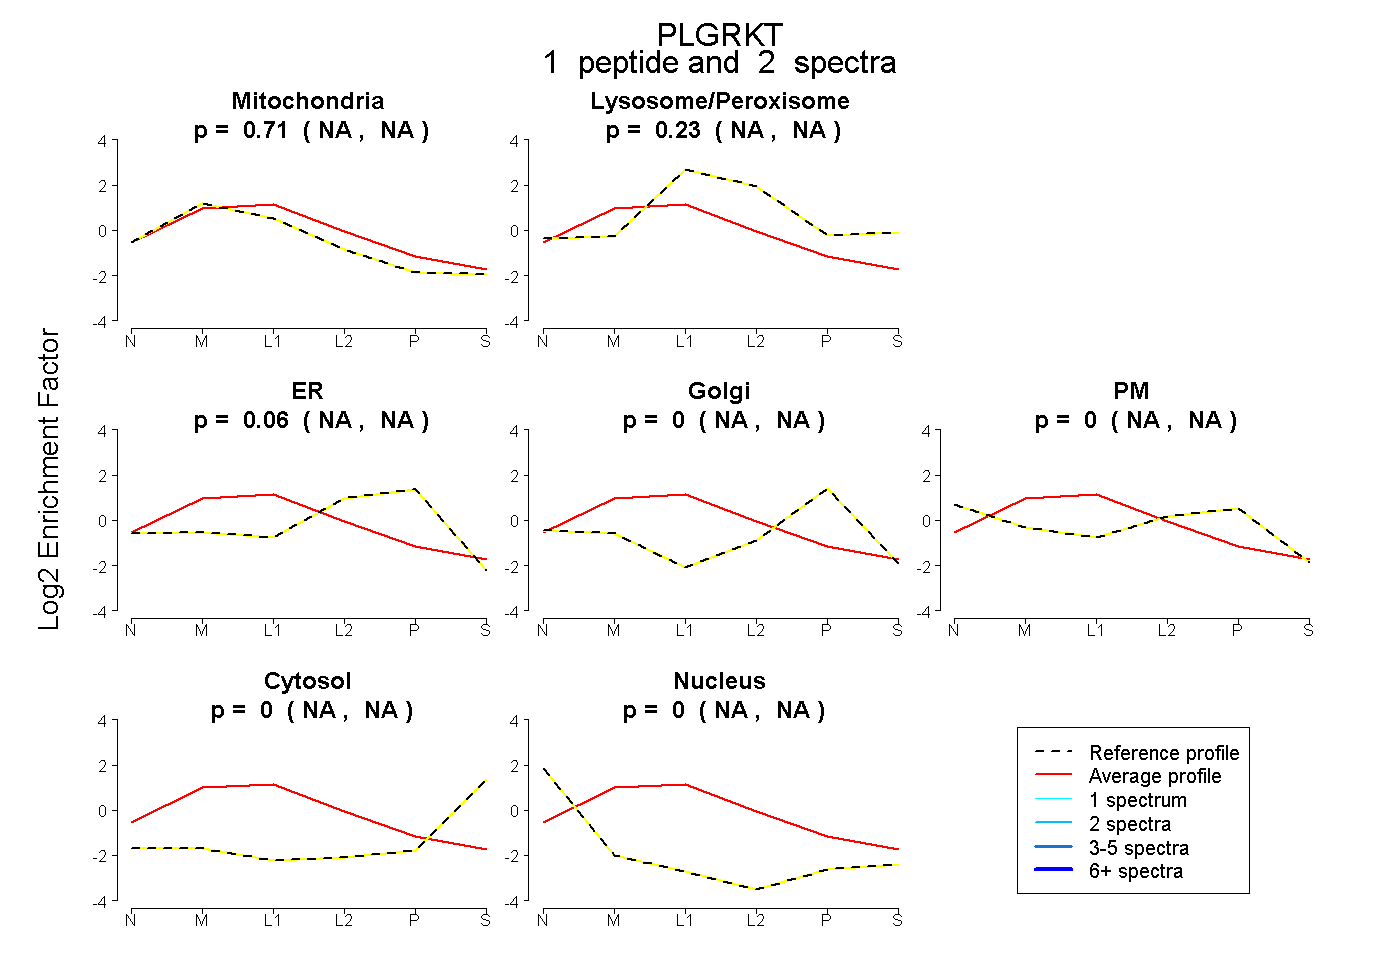 |
0.710 NA | NA |
0.233 NA | NA |
0.057 NA | NA |
0.000 NA | NA |
0.000 NA | NA |
0.000 NA | NA |
0.000 NA | NA |
|||
| Plot | Lyso | Other | |||||||||||
| Expt C |
5 peptides |
43 spectra |
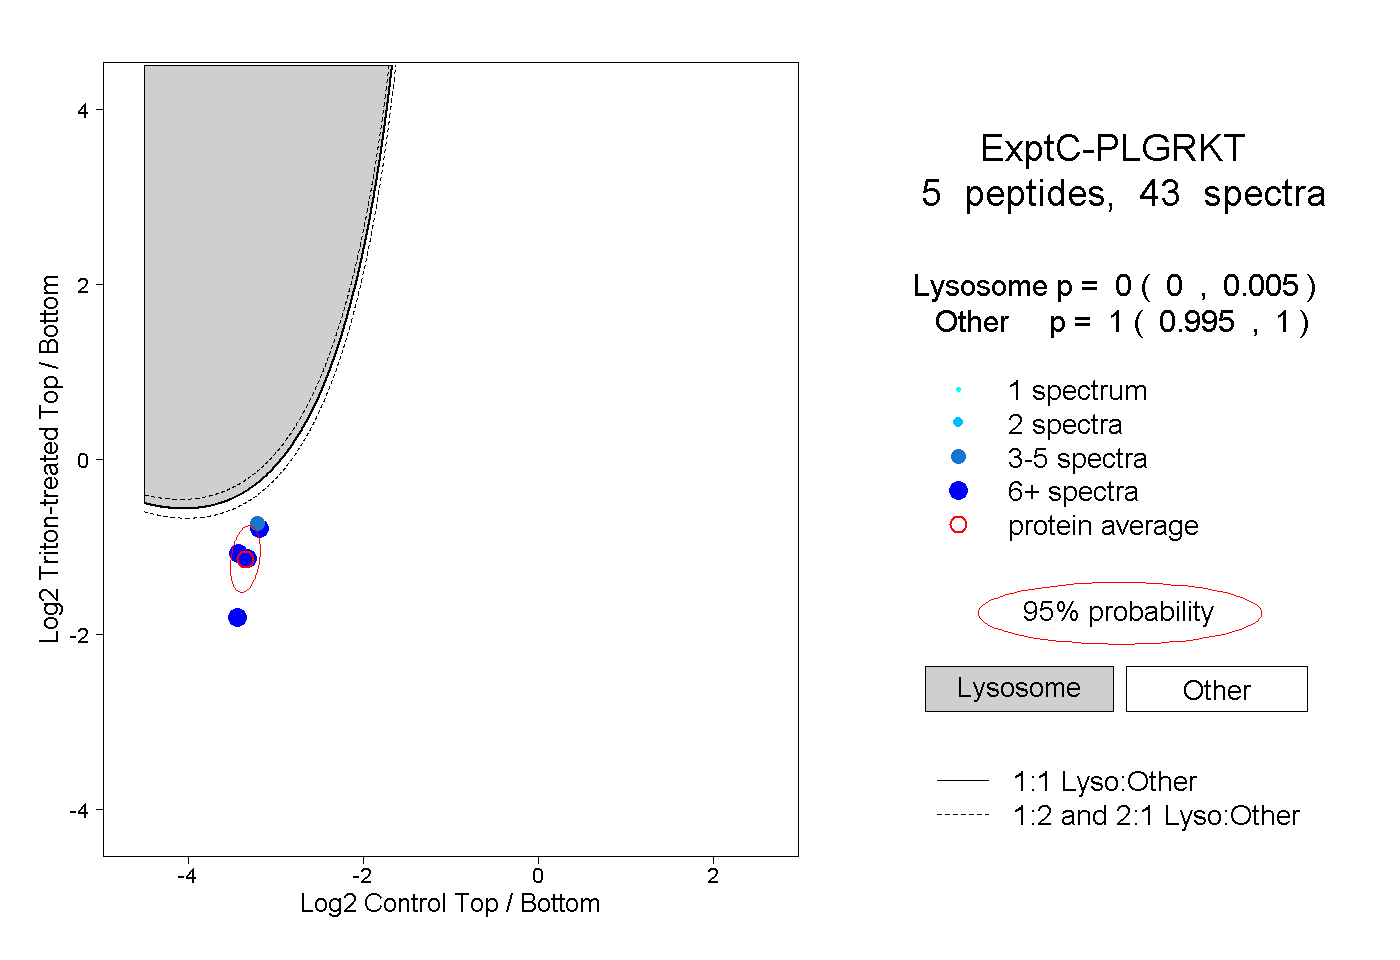 |
0.000 0.000 | 0.005 |
1.000 0.995 | 1.000 |