 7
7peptides
spectra
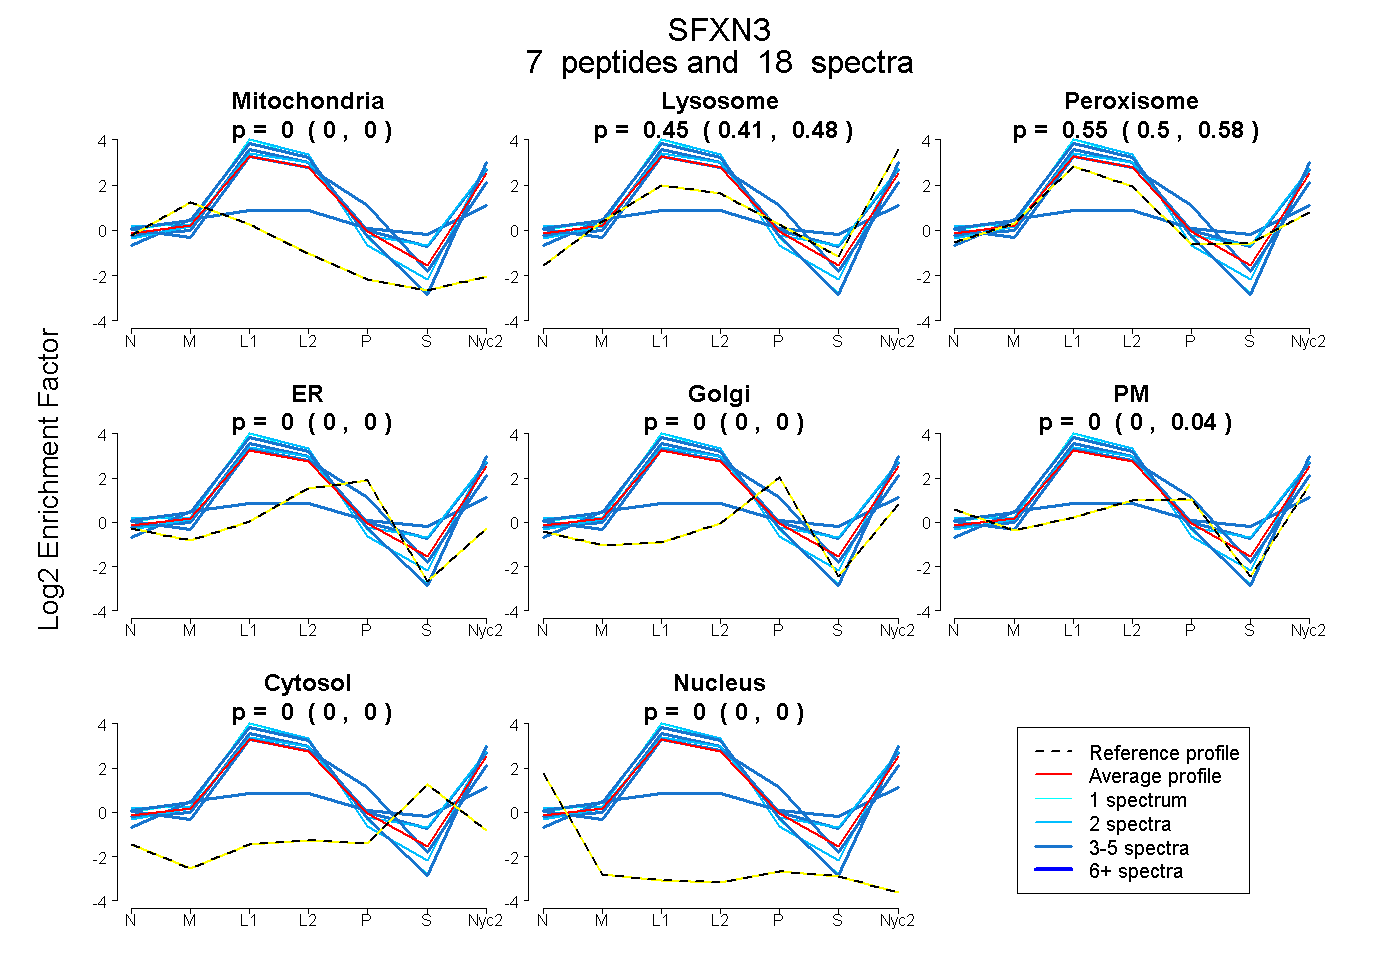
0.000 | 0.000
0.411 | 0.479
0.501 | 0.580
0.000 | 0.000
0.000 | 0.000
0.000 | 0.036
0.000 | 0.000
0.000 | 0.000
4peptides
spectra
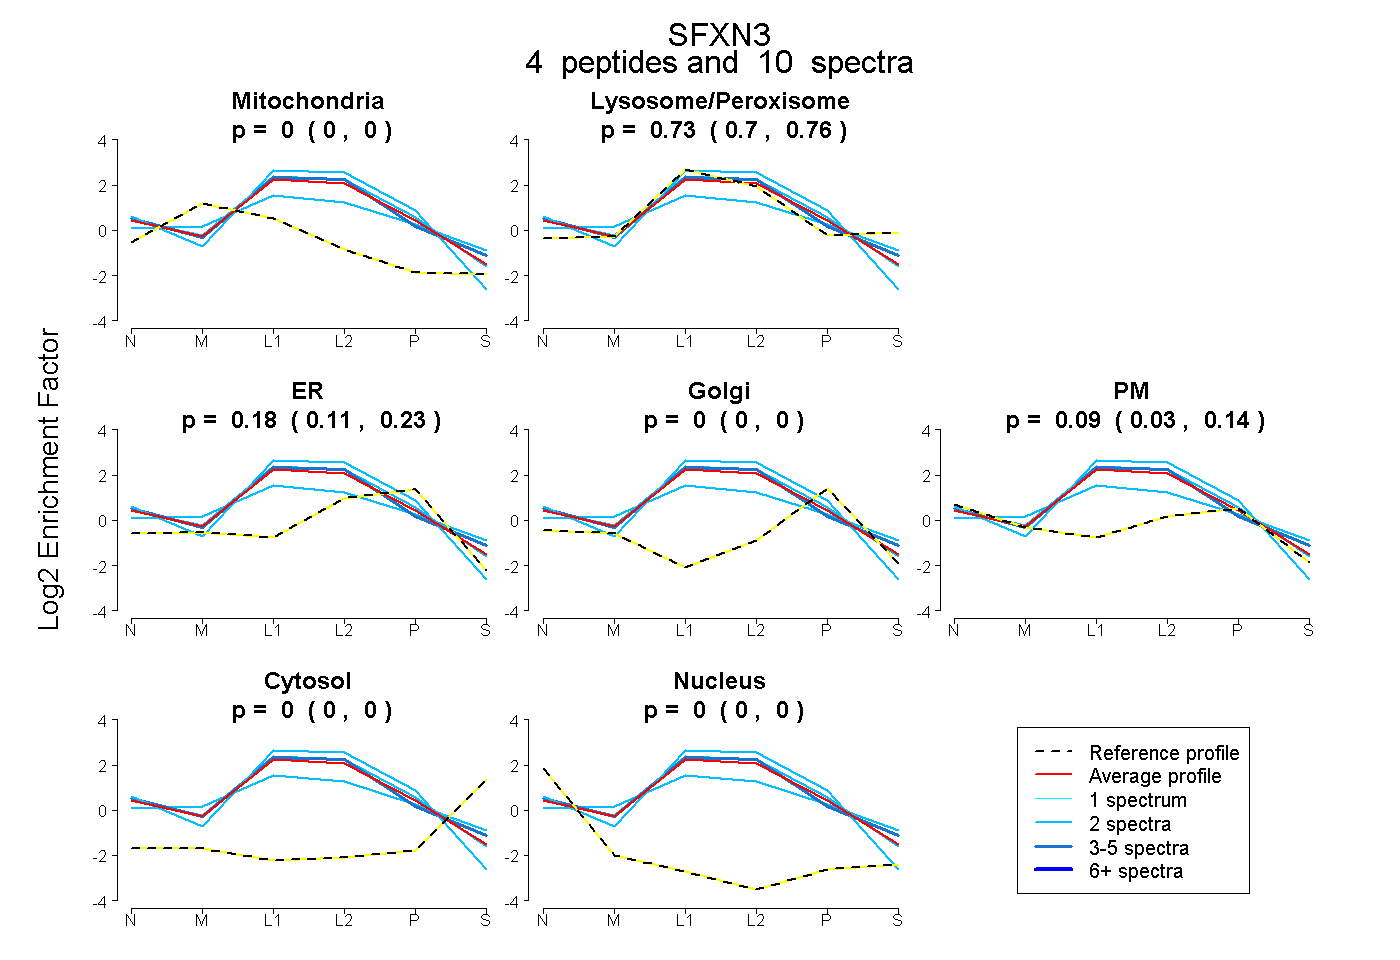
0.000 | 0.000
0.695 | 0.760
0.112 | 0.233
0.000 | 0.000
0.030 | 0.144
0.000 | 0.000
0.000 | 0.000
8peptides
spectra
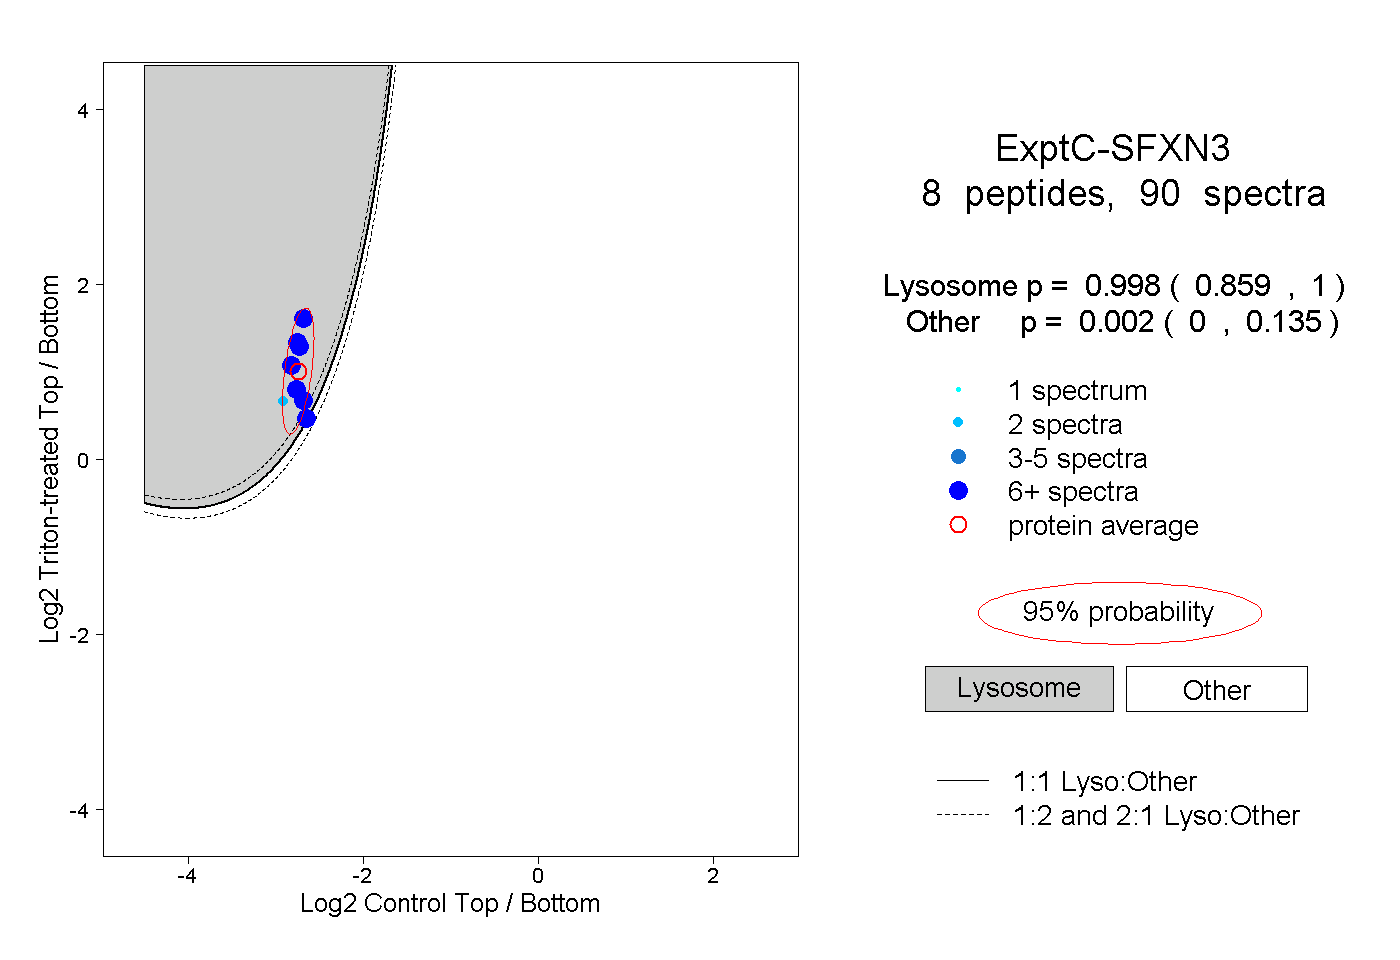
0.859 | 1.000
0.000 | 0.135
4peptides
spectra
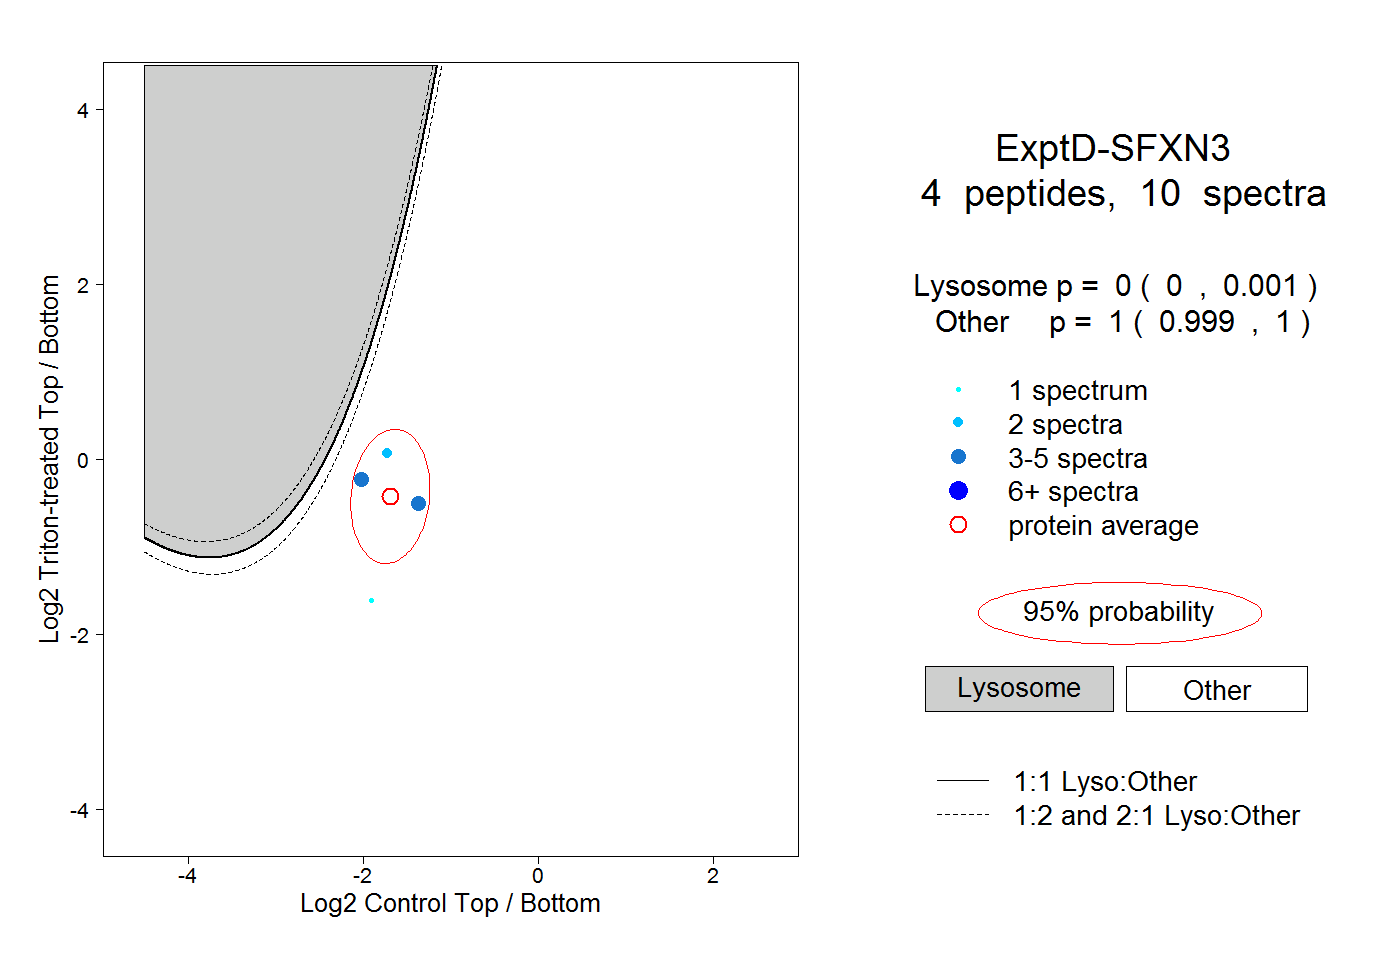
0.000 | 0.001
0.999 | 1.000