SFXN3
[ENSRNOP00000021171]
Main page
| | | Plot |
Mito |
Lyso |
|
Perox |
ER |
Golgi |
PM |
Cytosol |
Nucleus |
|
| Expt A |
 7
7
peptides |
18
spectra |
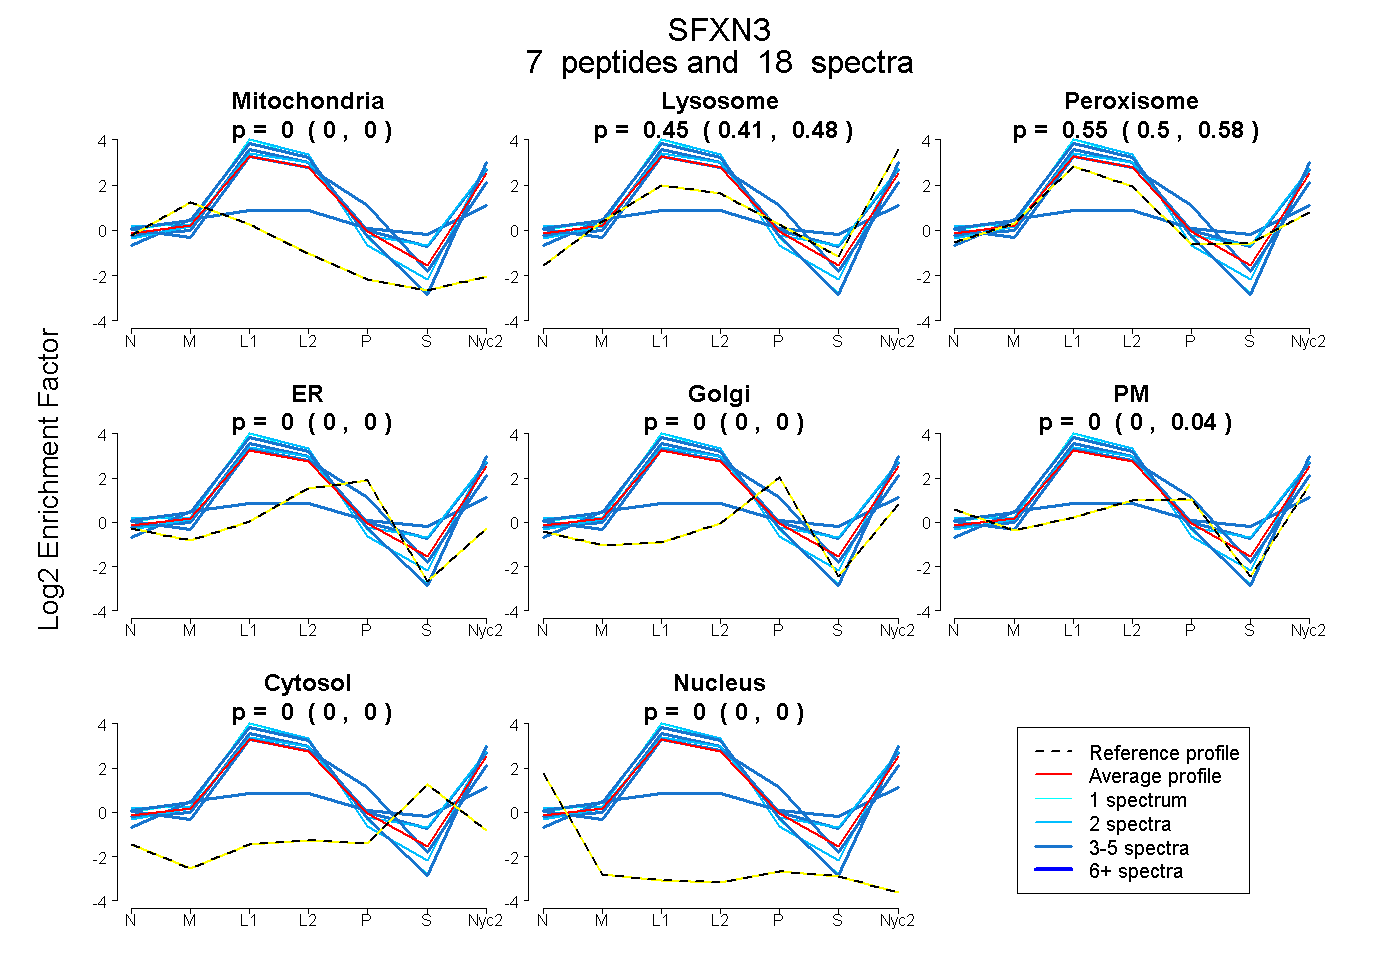 |
0.000
0.000 | 0.000 |
0.451
0.411 | 0.479 |
|
0.548
0.501 | 0.580 |
0.000
0.000 | 0.000 |
0.000
0.000 | 0.000 |
0.000
0.000 | 0.036 |
0.000
0.000 | 0.000 |
0.000
0.000 | 0.000 |
|
| | | Plot |
Mito |
|
Lyso or Perox |
|
ER |
Golgi |
PM |
Cytosol |
Nucleus |
|
| Expt B |
4
peptides |
10
spectra |
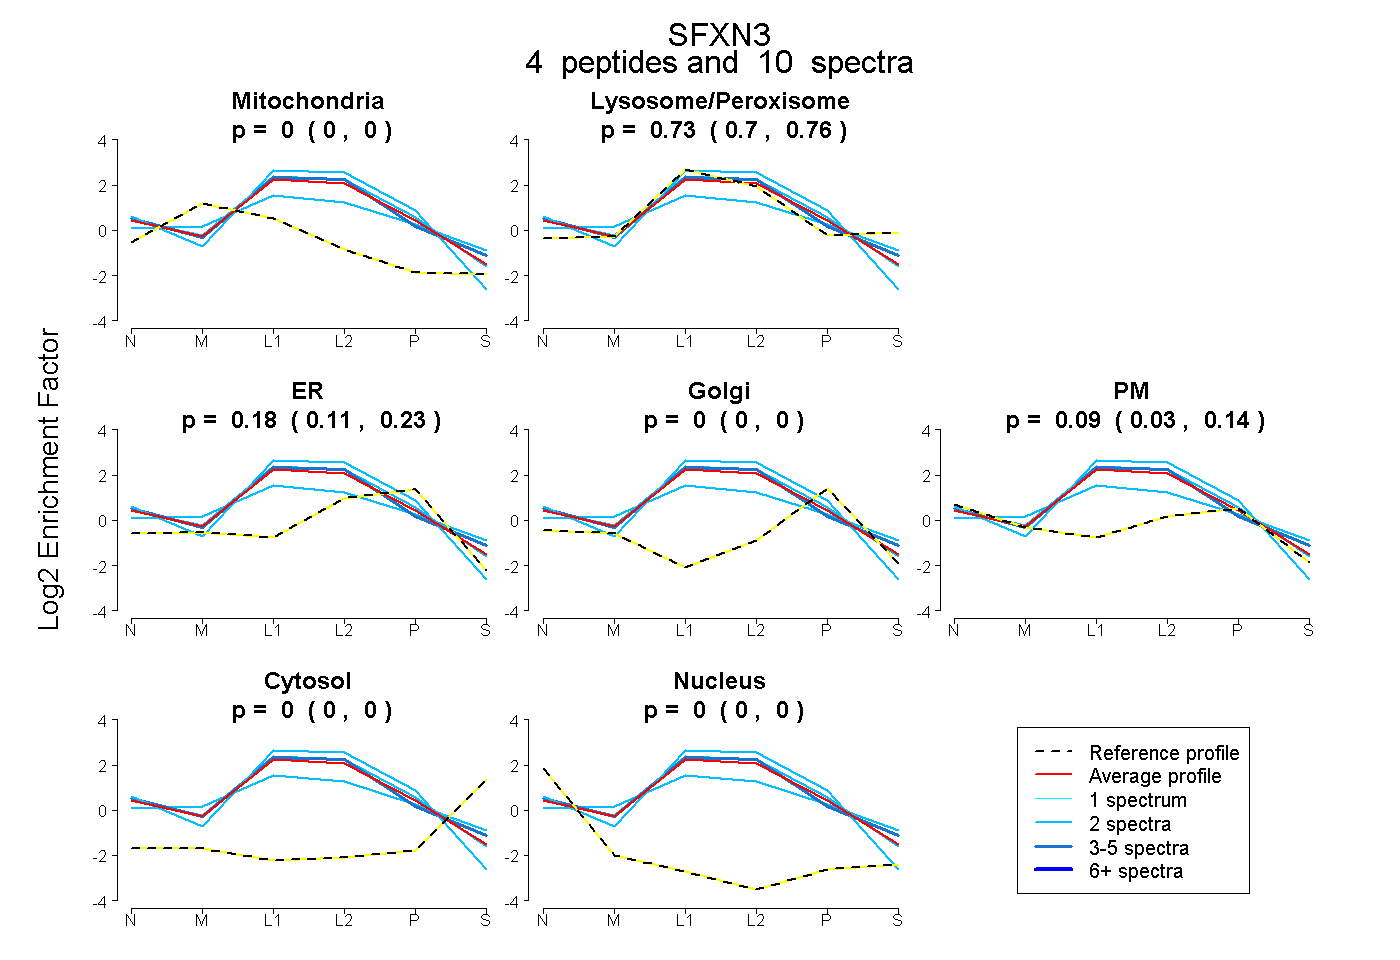 |
0.000
0.000 | 0.000 |
|
0.731
0.695 | 0.760 |
|
0.178
0.112 | 0.233 |
0.000
0.000 | 0.000 |
0.091
0.030 | 0.144 |
0.000
0.000 | 0.000 |
0.000
0.000 | 0.000 |
|
| 2 spectra, VVLIGR |
0.000 |
|
0.674 |
|
0.326 |
0.000 |
0.000 |
0.000 |
0.000 |
|
| 2 spectra, LGHSVTAAK |
0.041 |
|
0.614 |
|
0.033 |
0.000 |
0.311 |
0.000 |
0.000 |
|
| 2 spectra, HLPPLVGR |
0.000 |
|
0.751 |
|
0.249 |
0.000 |
0.000 |
0.000 |
0.000 |
|
| 4 spectra, QGIFQVVVSR |
0.000 |
|
0.815 |
|
0.028 |
0.000 |
0.157 |
0.000 |
0.000 |
|
| | | Plot |
|
Lyso |
|
|
|
|
|
|
|
Other |
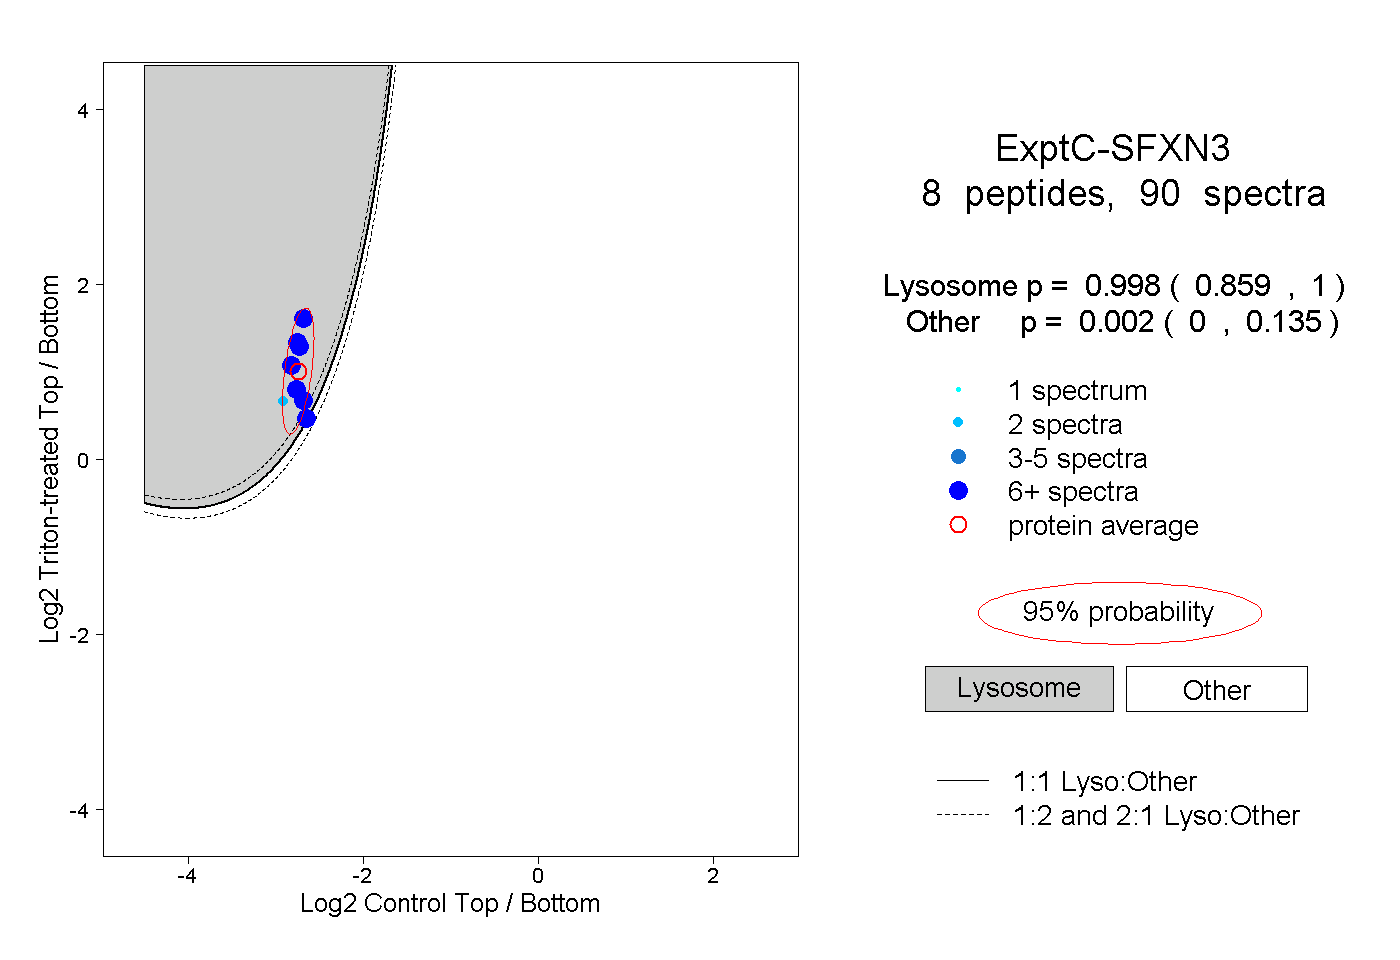
| Expt C |
8
peptides |
90
spectra |
 |
|
0.998
0.859 | 1.000 |
|
|
|
|
|
|
|
0.002
0.000 | 0.135 |
| | | Plot |
|
Lyso |
|
|
|
|
|
|
|
Other |
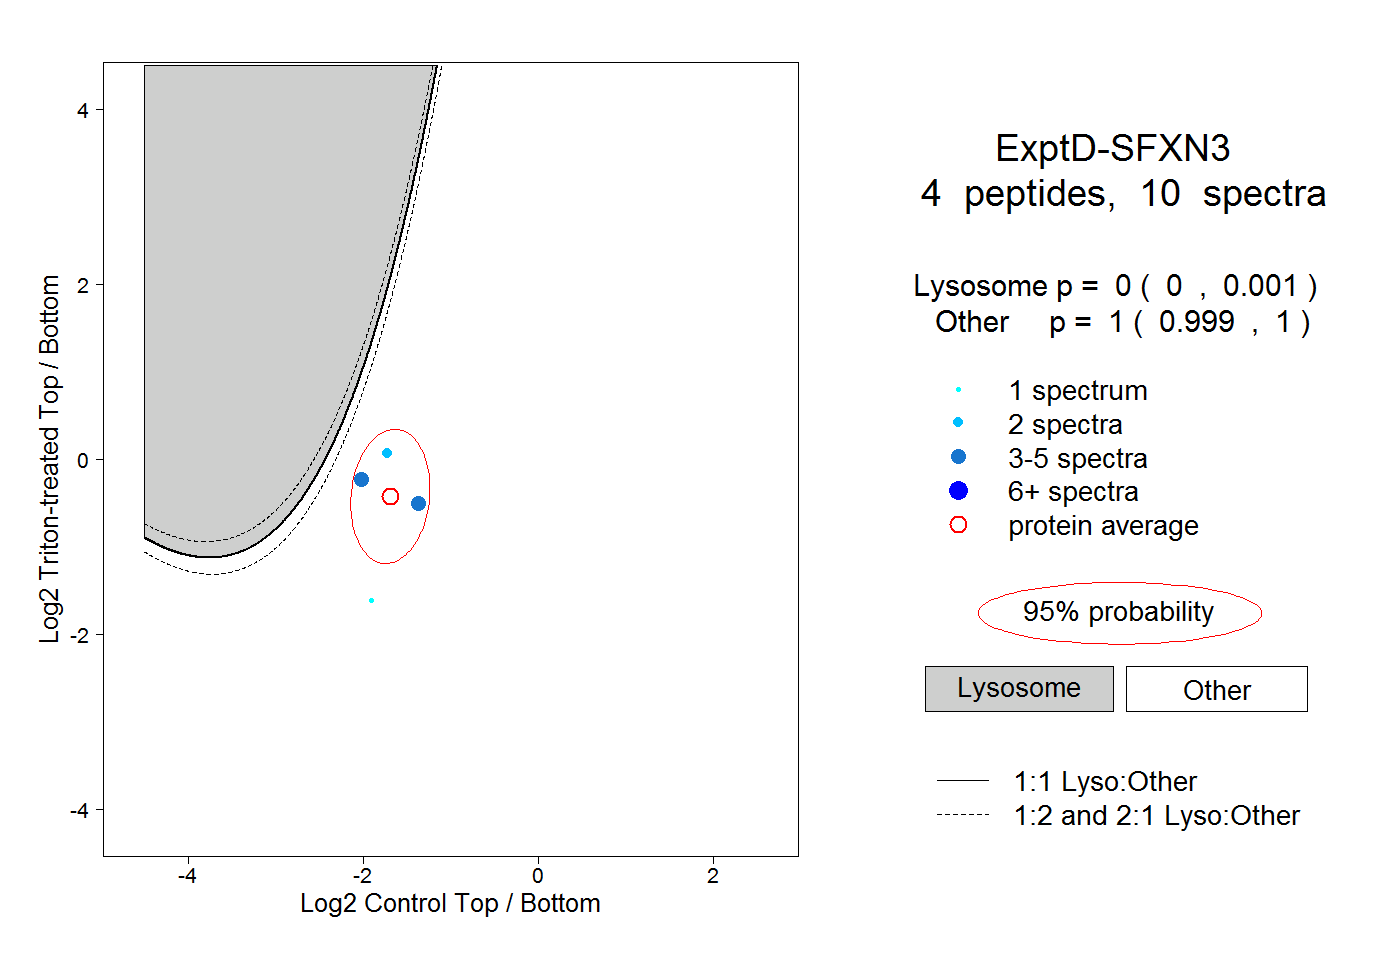
| Expt D |
4
peptides |
10
spectra |
 |
|
0.000
0.000 | 0.001 |
|
|
|
|
|
|
|
1.000
0.999 | 1.000 |