 7
7peptides
spectra
0.000 | 0.000
0.411 | 0.479
0.501 | 0.580
0.000 | 0.000
0.000 | 0.000
0.000 | 0.036
0.000 | 0.000
0.000 | 0.000
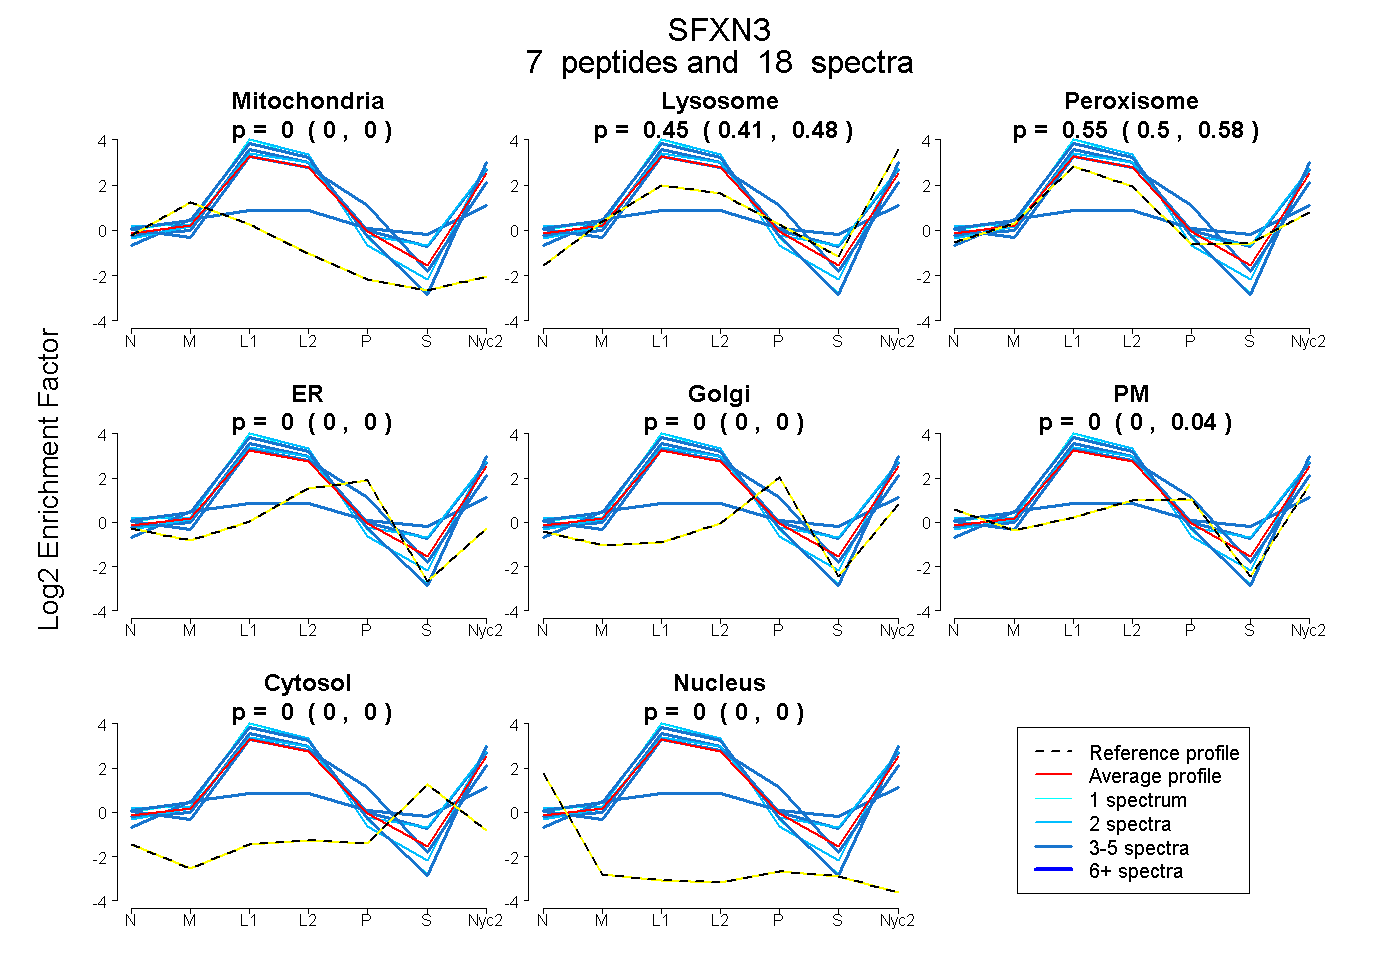
| Plot | Mito | Lyso | Perox | ER | Golgi | PM | Cytosol | Nucleus | |||||
| Expt A |
7 peptides |
18 spectra |
|
0.000 0.000 | 0.000 |
0.451 0.411 | 0.479 |
0.548 0.501 | 0.580 |
0.000 0.000 | 0.000 |
0.000 0.000 | 0.000 |
0.000 0.000 | 0.036 |
0.000 0.000 | 0.000 |
0.000 0.000 | 0.000 |
| 3 spectra, VVLIGR | 0.000 | 0.370 | 0.441 | 0.144 | 0.000 | 0.045 | 0.000 | 0.000 | ||
| 3 spectra, ELQVGIPVTDEAGQR | 0.054 | 0.272 | 0.355 | 0.000 | 0.120 | 0.025 | 0.174 | 0.000 | ||
| 1 spectrum, LGHSVTAAK | 0.000 | 0.545 | 0.455 | 0.000 | 0.000 | 0.000 | 0.000 | 0.000 | ||
| 2 spectra, AGVVTPGLTEDQLWR | 0.000 | 0.455 | 0.545 | 0.000 | 0.000 | 0.000 | 0.000 | 0.000 | ||
| 2 spectra, NLILSGK | 0.000 | 0.448 | 0.552 | 0.000 | 0.000 | 0.000 | 0.000 | 0.000 | ||
| 3 spectra, HLPPLVGR | 0.000 | 0.430 | 0.570 | 0.000 | 0.000 | 0.000 | 0.000 | 0.000 | ||
| 4 spectra, QGIFQVVVSR | 0.000 | 0.547 | 0.453 | 0.000 | 0.000 | 0.000 | 0.000 | 0.000 |
| Plot | Mito | Lyso or Perox | ER | Golgi | PM | Cytosol | Nucleus | ||||||
| Expt B |
4 peptides |
10 spectra |
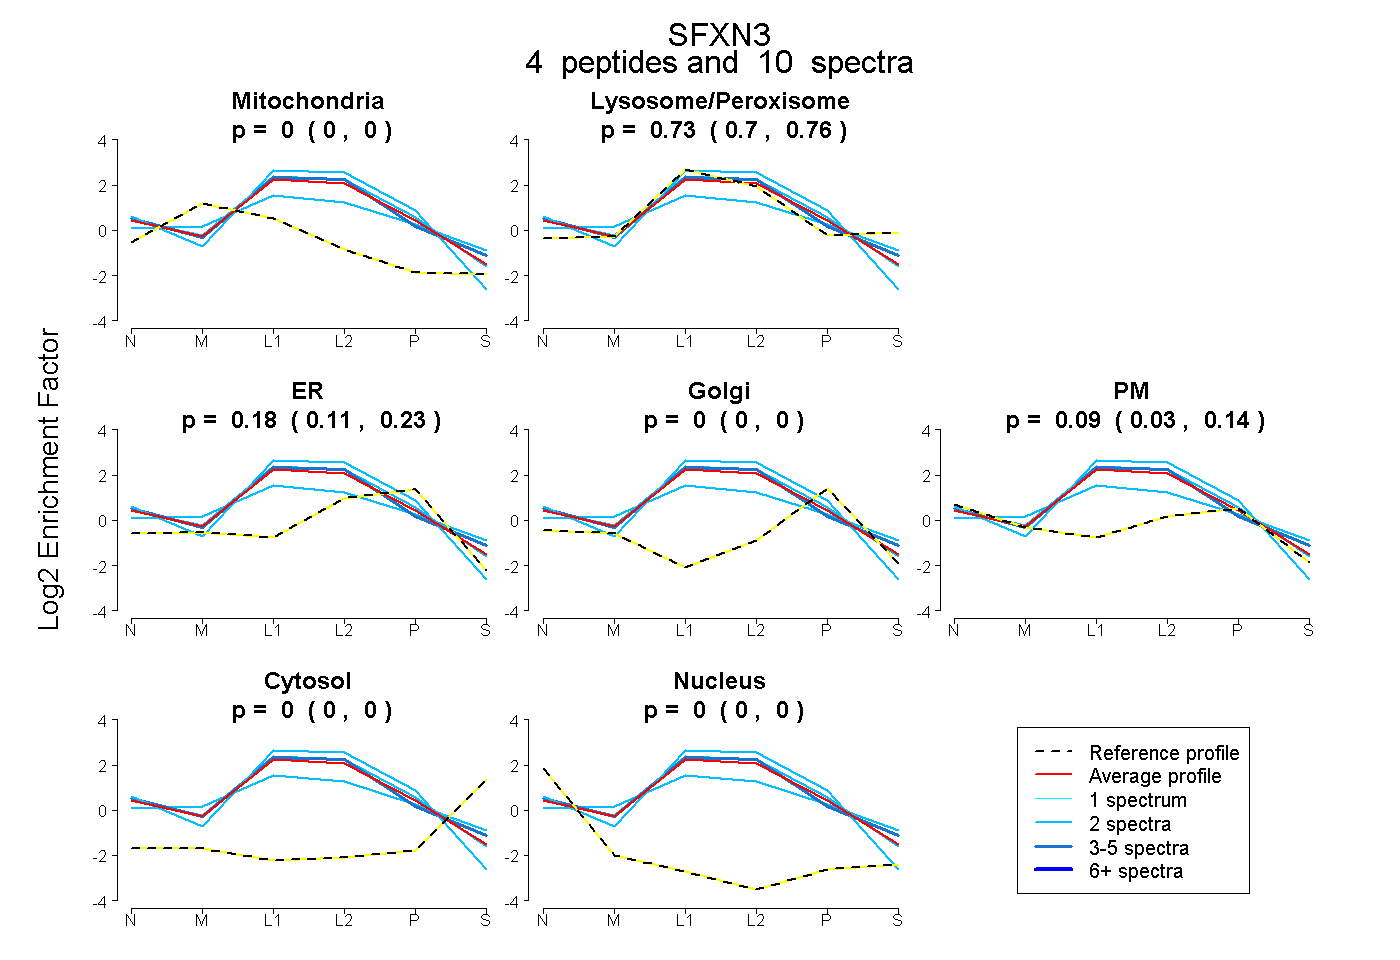 |
0.000 0.000 | 0.000 |
0.731 0.695 | 0.760 |
0.178 0.112 | 0.233 |
0.000 0.000 | 0.000 |
0.091 0.030 | 0.144 |
0.000 0.000 | 0.000 |
0.000 0.000 | 0.000 |
|||
| Plot | Lyso | Other | |||||||||||
| Expt C |
8 peptides |
90 spectra |
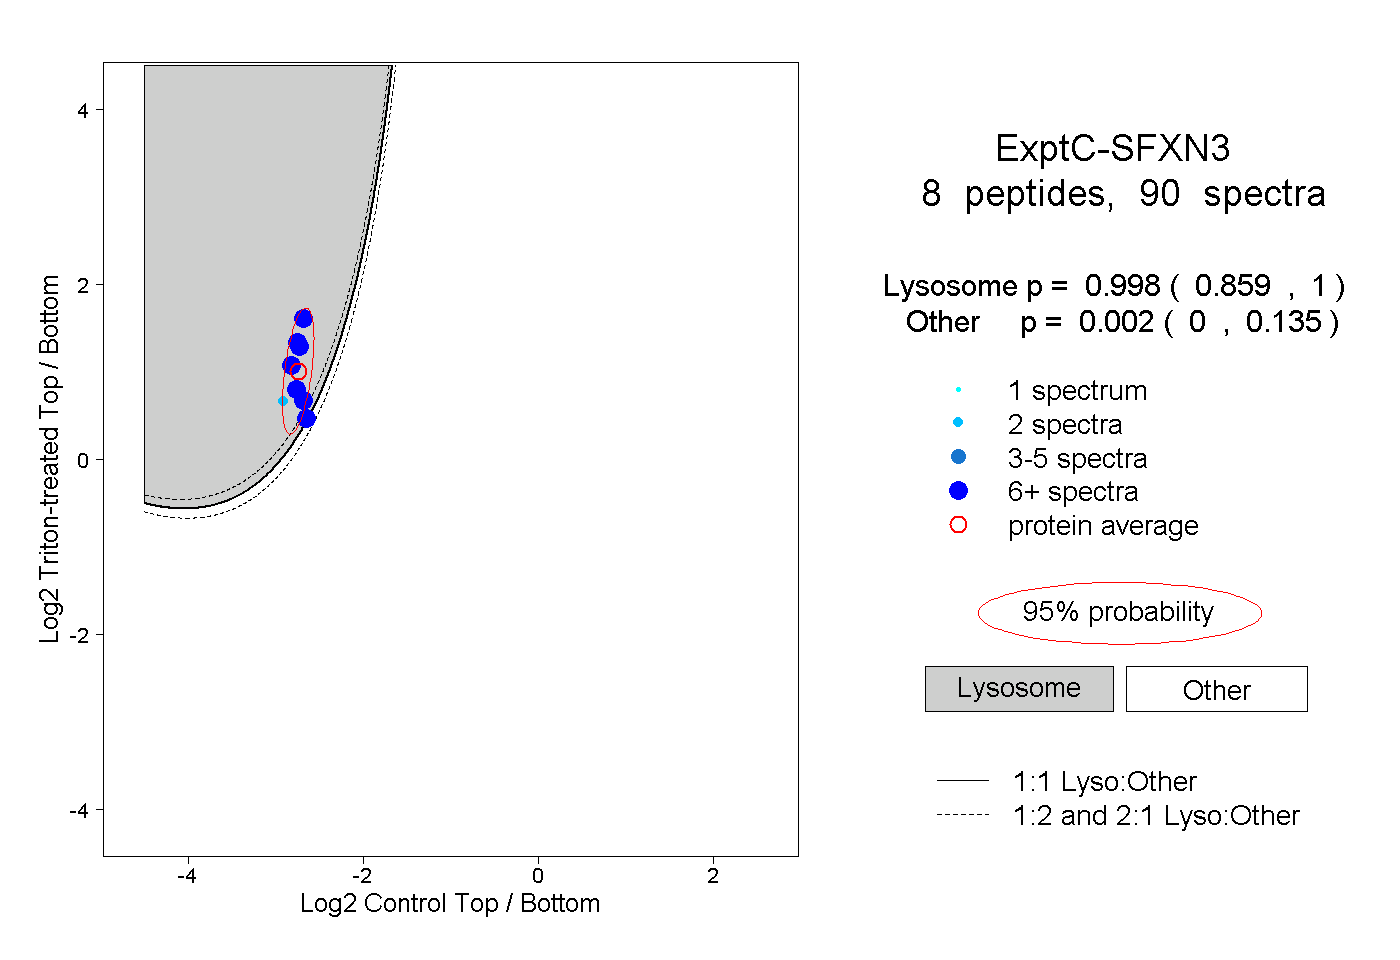 |
0.998 0.859 | 1.000 |
0.002 0.000 | 0.135 |
||||||||
| Plot | Lyso | Other | |||||||||||
| Expt D |
4 peptides |
10 spectra |
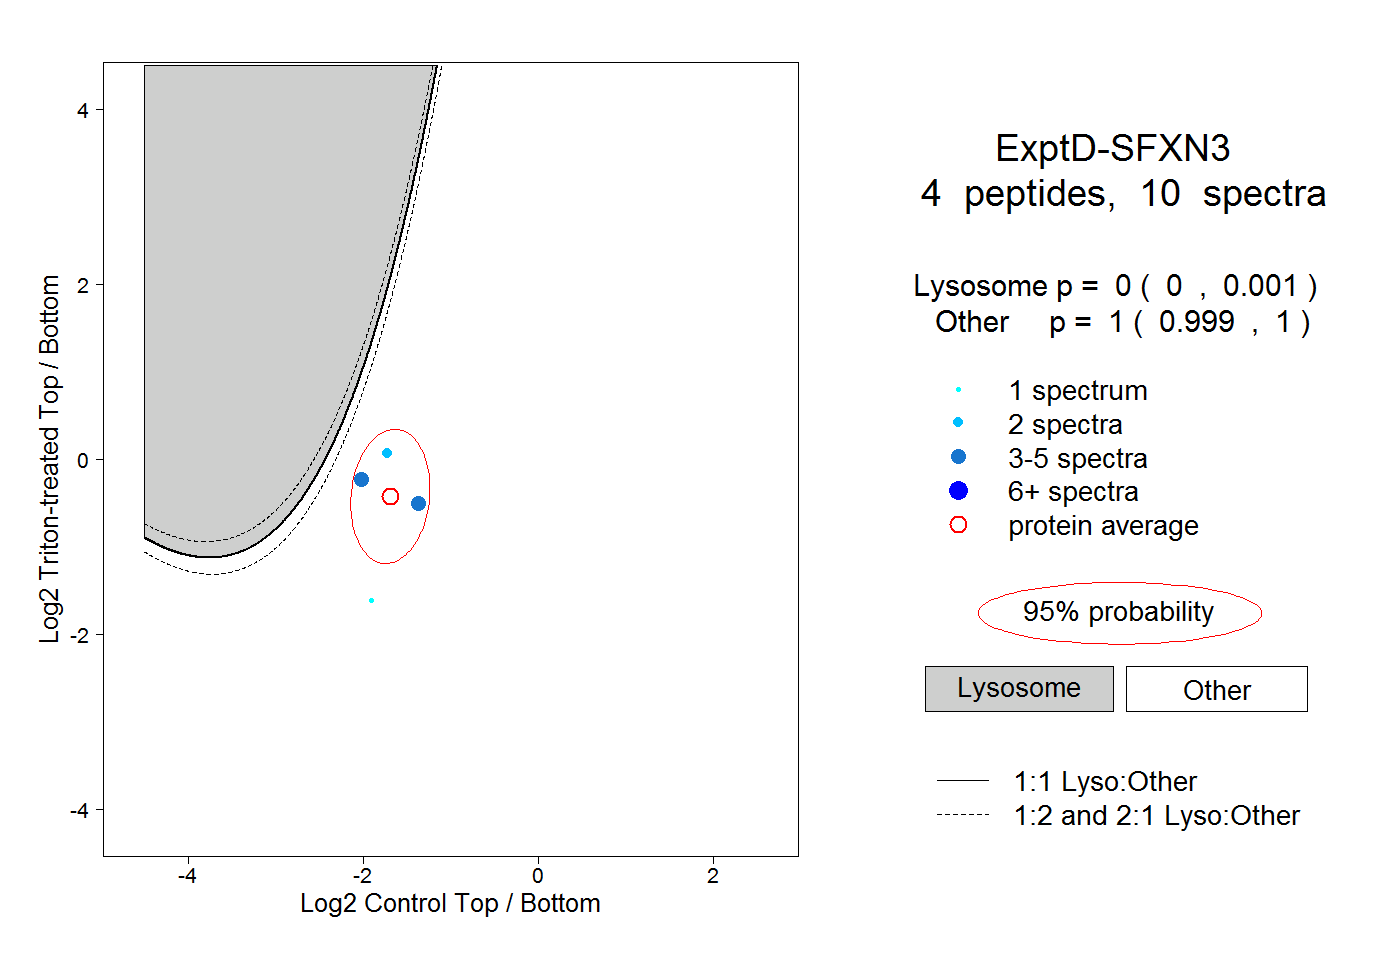 |
0.000 0.000 | 0.001 |
1.000 0.999 | 1.000 |