 11
11peptides
spectra
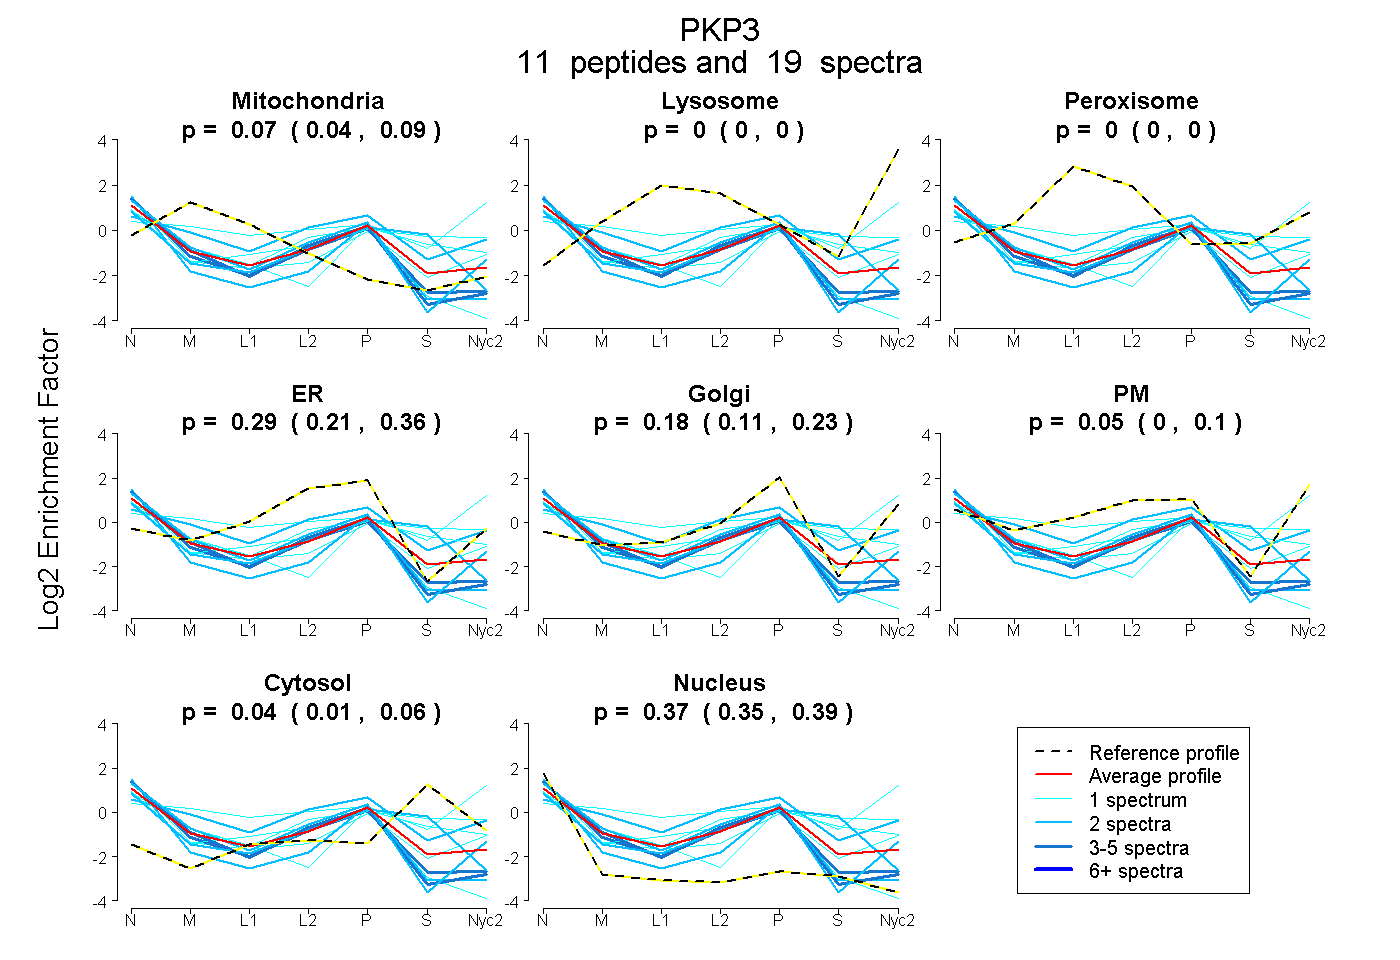
0.044 | 0.089
0.000 | 0.000
0.000 | 0.000
0.214 | 0.361
0.114 | 0.227
0.000 | 0.105
0.006 | 0.065
0.354 | 0.391
5peptides
spectra
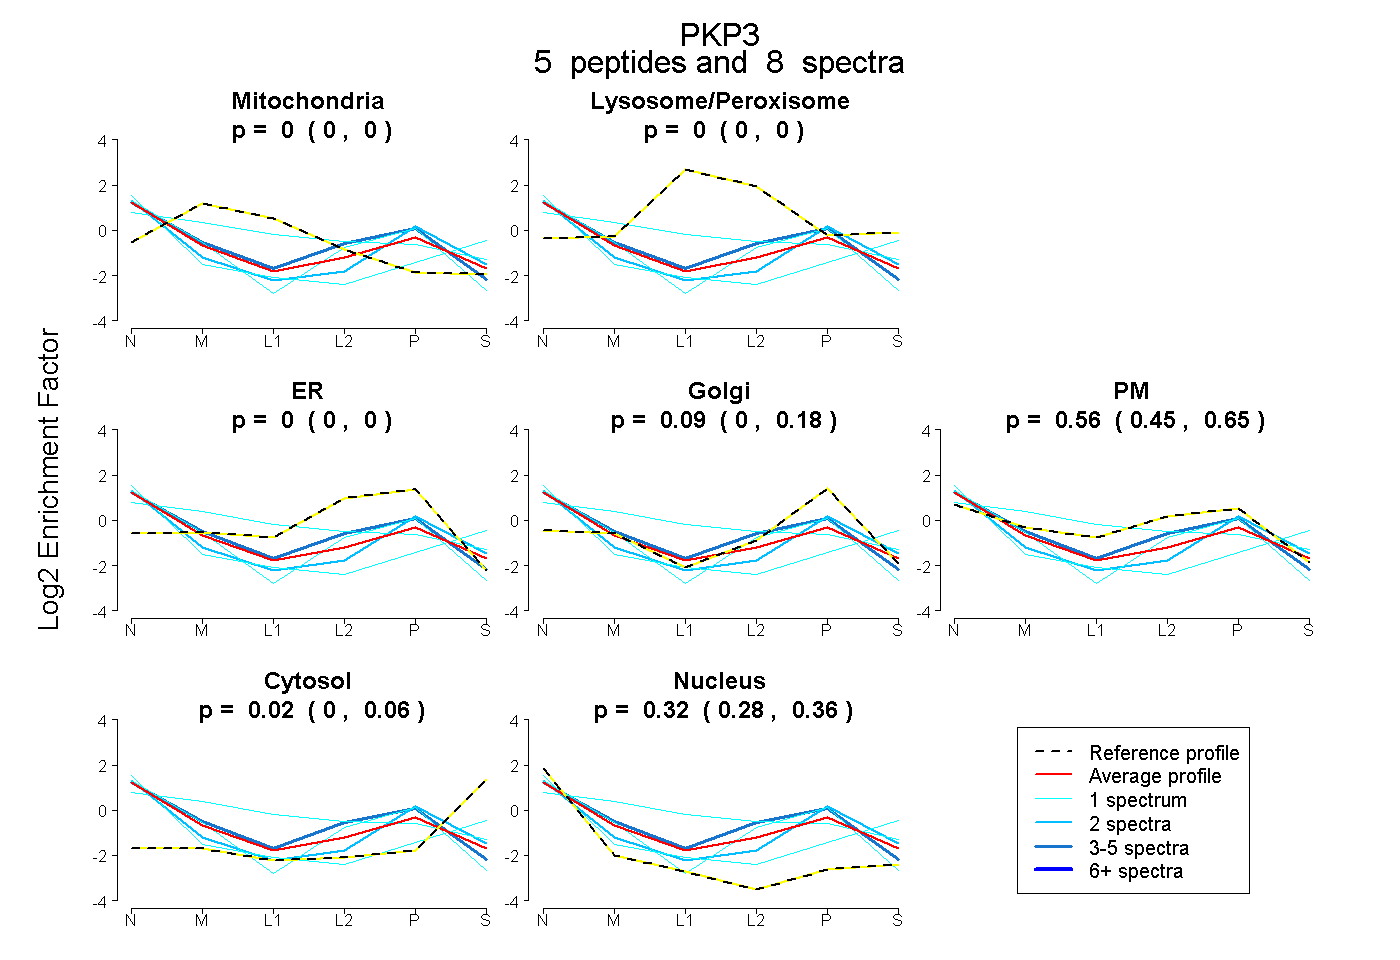
0.000 | 0.000
0.000 | 0.000
0.000 | 0.000
0.000 | 0.176
0.451 | 0.654
0.000 | 0.058
0.281 | 0.361
4peptides
spectra
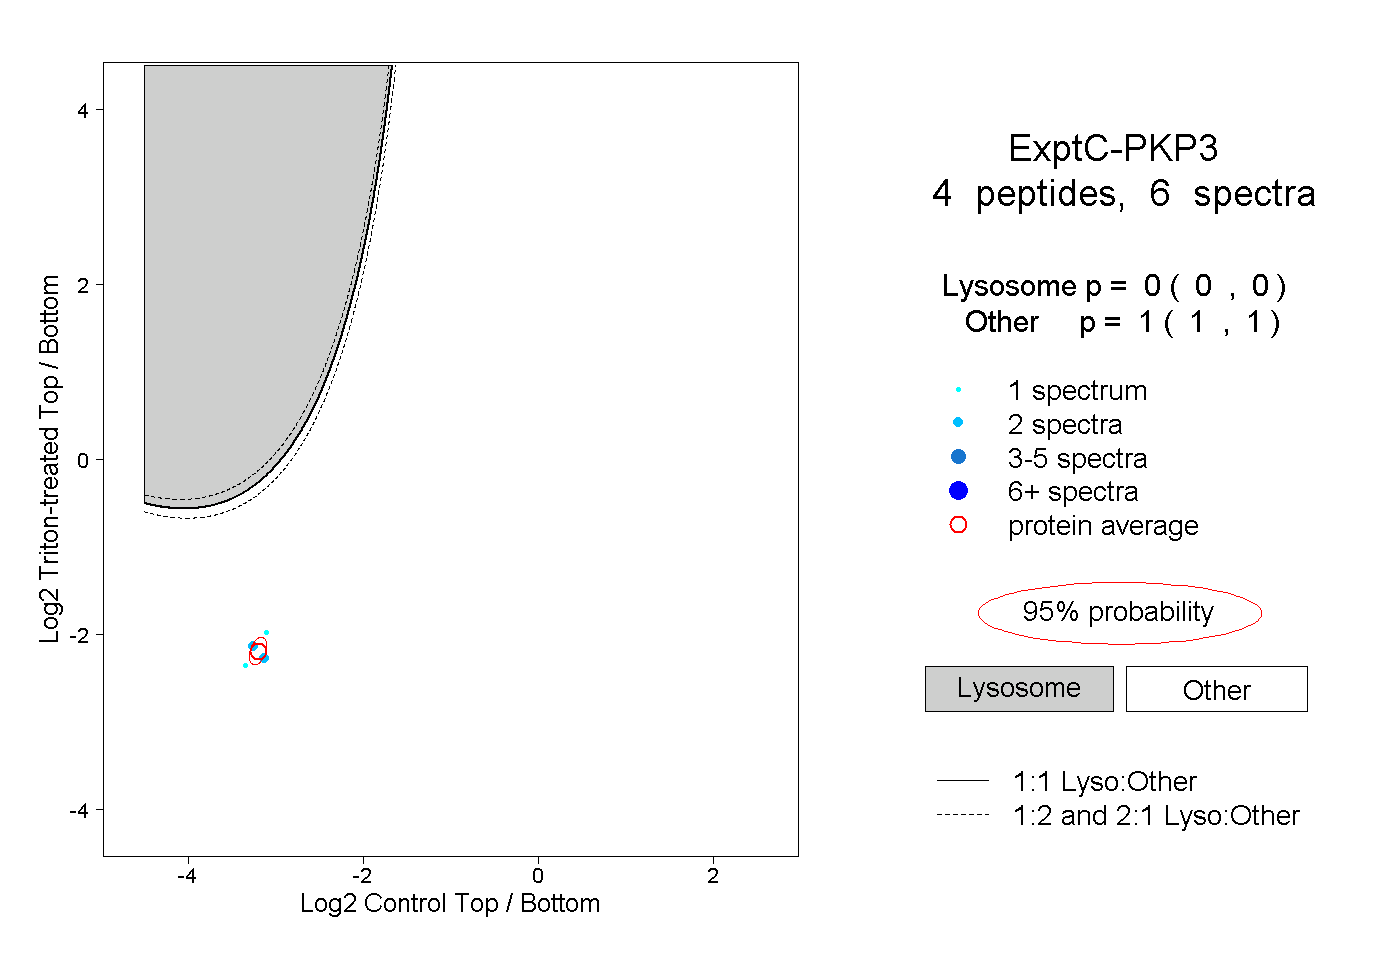
0.000 | 0.000
1.000 | 1.000