PKP3
[ENSRNOP00000020864]
Main page
| | | Plot |
Mito |
Lyso |
|
Perox |
ER |
Golgi |
PM |
Cytosol |
Nucleus |
|
| Expt A |
 11
11
peptides |
19
spectra |
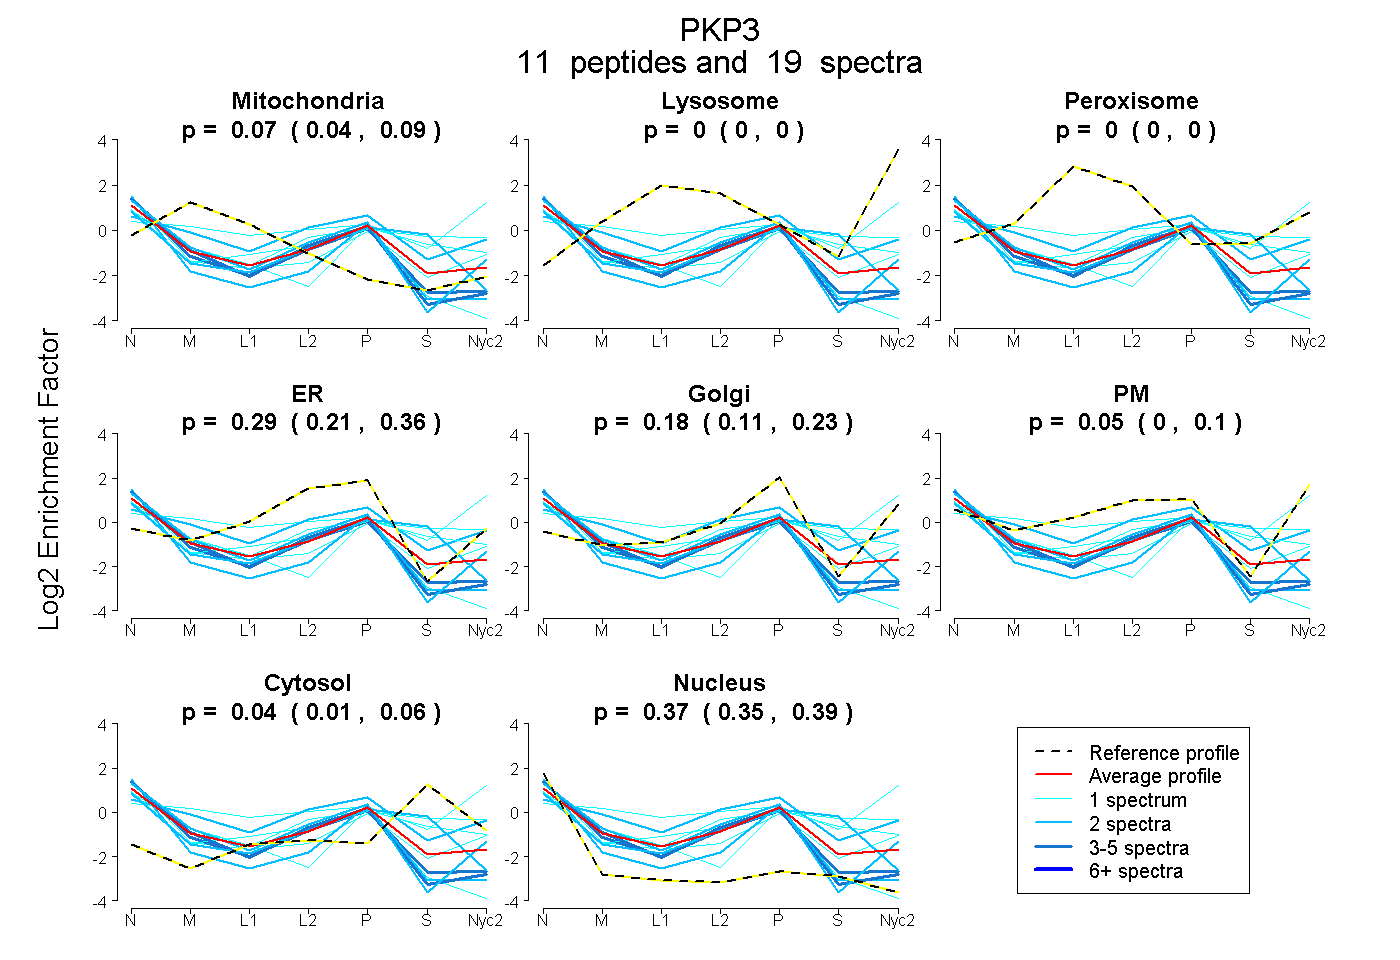 |
0.069
0.044 | 0.089 |
0.000
0.000 | 0.000 |
|
0.000
0.000 | 0.000 |
0.294
0.214 | 0.361 |
0.175
0.114 | 0.227 |
0.049
0.000 | 0.105 |
0.038
0.006 | 0.065 |
0.374
0.354 | 0.391 |
|
| | | Plot |
Mito |
|
Lyso or Perox |
|
ER |
Golgi |
PM |
Cytosol |
Nucleus |
|
| Expt B |
5
peptides |
8
spectra |
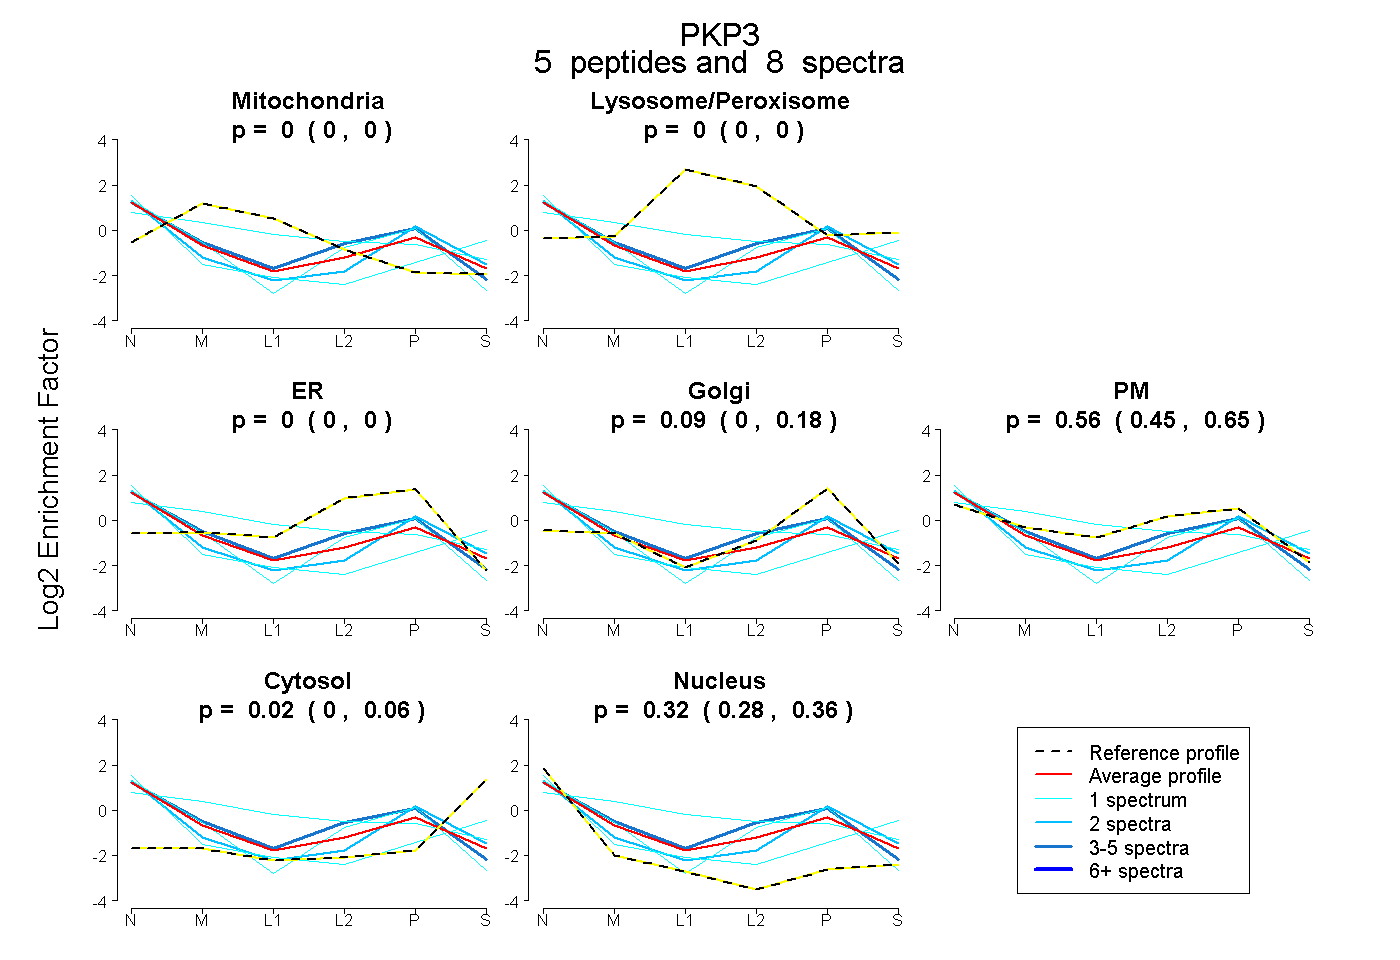 |
0.000
0.000 | 0.000 |
|
0.000
0.000 | 0.000 |
|
0.000
0.000 | 0.000 |
0.092
0.000 | 0.176 |
0.564
0.451 | 0.654 |
0.020
0.000 | 0.058 |
0.324
0.281 | 0.361 |
|
| 1 spectrum, SLQAVPR |
0.310 |
|
0.116 |
|
0.000 |
0.000 |
0.462 |
0.000 |
0.112 |
|
| 2 spectra, LLQLGQQSR |
0.000 |
|
0.000 |
|
0.000 |
0.425 |
0.196 |
0.000 |
0.379 |
|
| 1 spectrum, VVSHLIEK |
0.000 |
|
0.029 |
|
0.000 |
0.000 |
0.190 |
0.259 |
0.521 |
|
| 3 spectra, ILNPLLDR |
0.000 |
|
0.000 |
|
0.000 |
0.078 |
0.711 |
0.000 |
0.212 |
|
| 1 spectrum, NLSSASQATR |
0.000 |
|
0.000 |
|
0.000 |
0.357 |
0.352 |
0.000 |
0.291 |
|
| | | Plot |
|
Lyso |
|
|
|
|
|
|
|
Other |
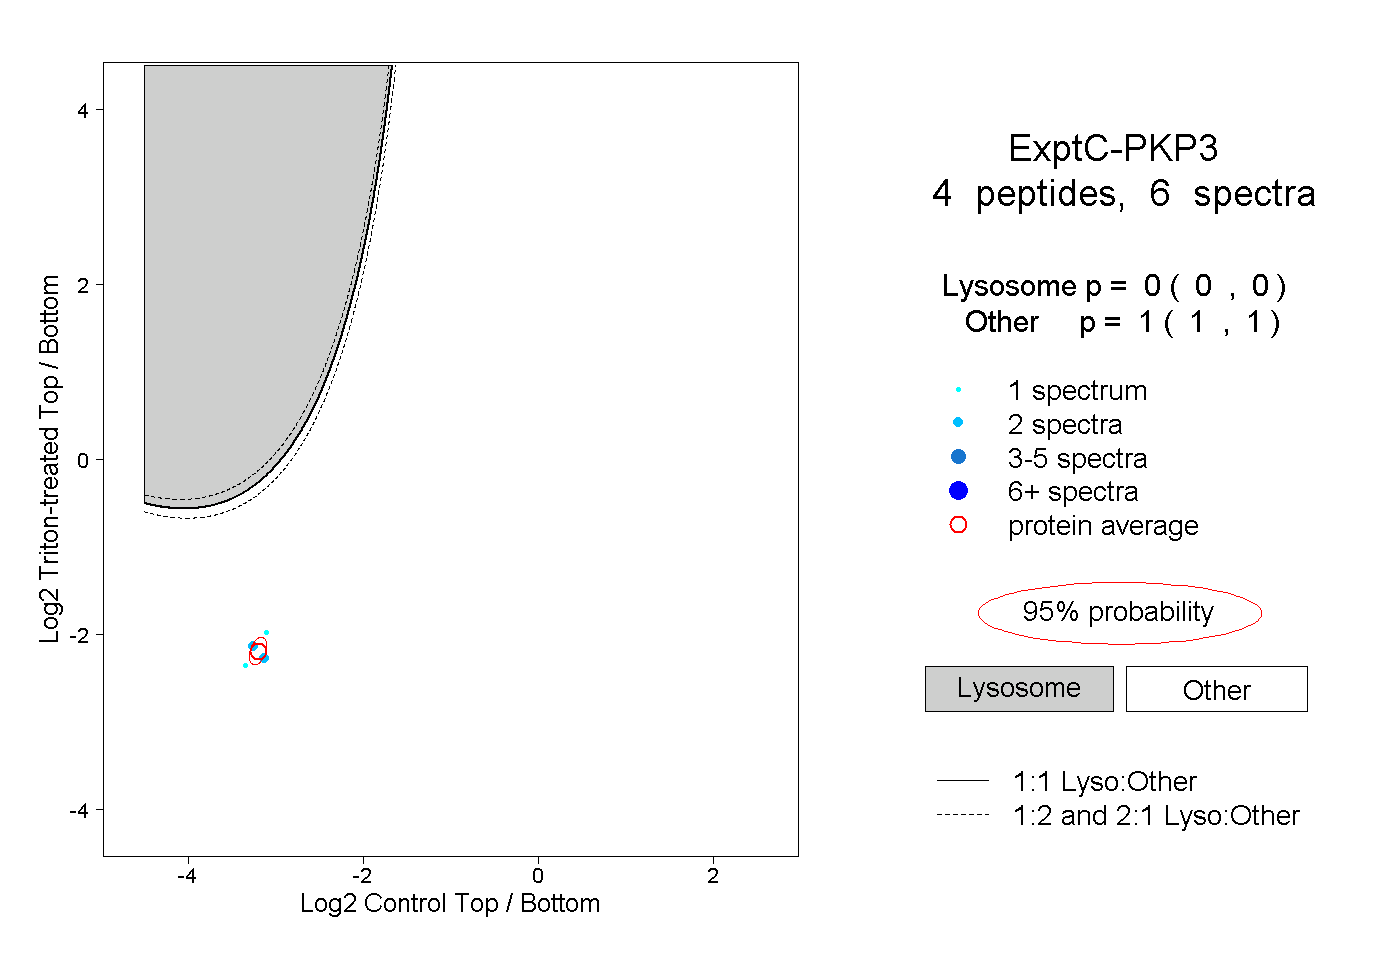
| Expt C |
4
peptides |
6
spectra |
 |
|
0.000
0.000 | 0.000 |
|
|
|
|
|
|
|
1.000
1.000 | 1.000 |