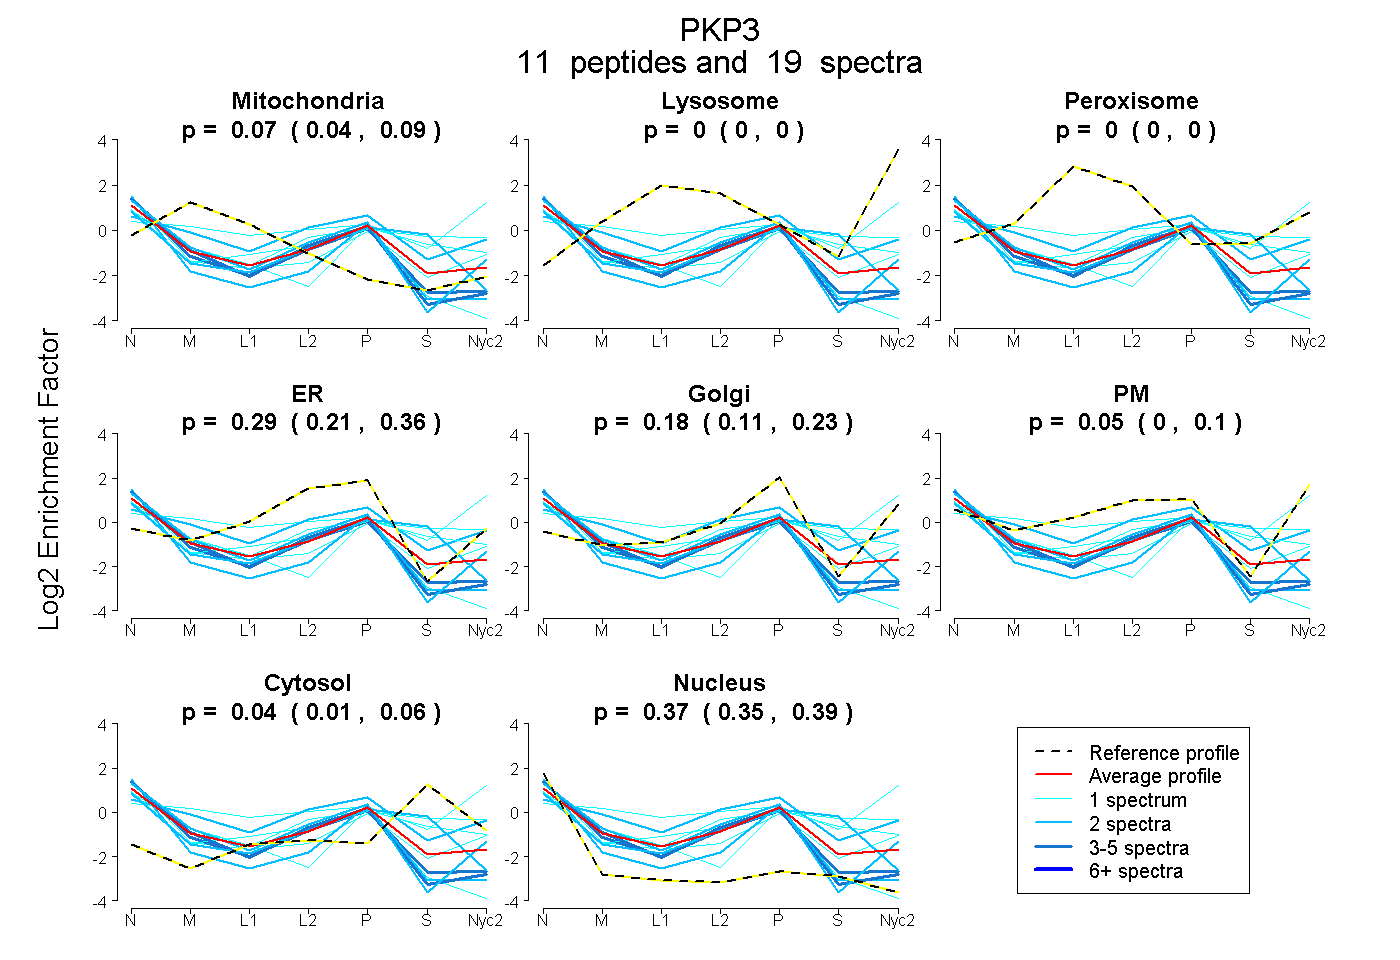
 11
11peptides
spectra
0.044 | 0.089
0.000 | 0.000
0.000 | 0.000
0.214 | 0.361
0.114 | 0.227
0.000 | 0.105
0.006 | 0.065
0.354 | 0.391
| Plot | Mito | Lyso | Perox | ER | Golgi | PM | Cytosol | Nucleus | |||||
| Expt A |
11 peptides |
19 spectra |
|
0.069 0.044 | 0.089 |
0.000 0.000 | 0.000 |
0.000 0.000 | 0.000 |
0.294 0.214 | 0.361 |
0.175 0.114 | 0.227 |
0.049 0.000 | 0.105 |
0.038 0.006 | 0.065 |
0.374 0.354 | 0.391 |
| 2 spectra, SLTGLIR | 0.000 | 0.000 | 0.000 | 0.315 | 0.000 | 0.000 | 0.359 | 0.326 | ||
| 1 spectrum, LYDEMPPSALQR | 0.000 | 0.000 | 0.000 | 0.000 | 0.000 | 0.443 | 0.398 | 0.158 | ||
| 1 spectrum, DLLYFDGLR | 0.000 | 0.000 | 0.000 | 0.000 | 0.246 | 0.284 | 0.012 | 0.458 | ||
| 3 spectra, ILNPLLDR | 0.000 | 0.000 | 0.000 | 0.471 | 0.000 | 0.000 | 0.000 | 0.529 | ||
| 2 spectra, WAGVLSR | 0.000 | 0.000 | 0.000 | 0.360 | 0.039 | 0.200 | 0.000 | 0.402 | ||
| 1 spectrum, GGTGSVSGAGLEPVAR | 0.175 | 0.000 | 0.000 | 0.248 | 0.000 | 0.000 | 0.000 | 0.577 | ||
| 2 spectra, LFNHANQEVQR | 0.140 | 0.000 | 0.000 | 0.205 | 0.125 | 0.304 | 0.156 | 0.070 | ||
| 2 spectra, LLQLGQQSR | 0.000 | 0.000 | 0.000 | 0.272 | 0.095 | 0.000 | 0.000 | 0.633 | ||
| 3 spectra, NLSSASQATR | 0.021 | 0.000 | 0.000 | 0.474 | 0.000 | 0.000 | 0.000 | 0.505 | ||
| 1 spectrum, NLIYDNVDNK | 0.020 | 0.000 | 0.000 | 0.195 | 0.000 | 0.277 | 0.300 | 0.207 | ||
| 1 spectrum, LALVEENGIFELLR | 0.093 | 0.110 | 0.000 | 0.000 | 0.000 | 0.574 | 0.223 | 0.000 |
| Plot | Mito | Lyso or Perox | ER | Golgi | PM | Cytosol | Nucleus | ||||||
| Expt B |
5 peptides |
8 spectra |
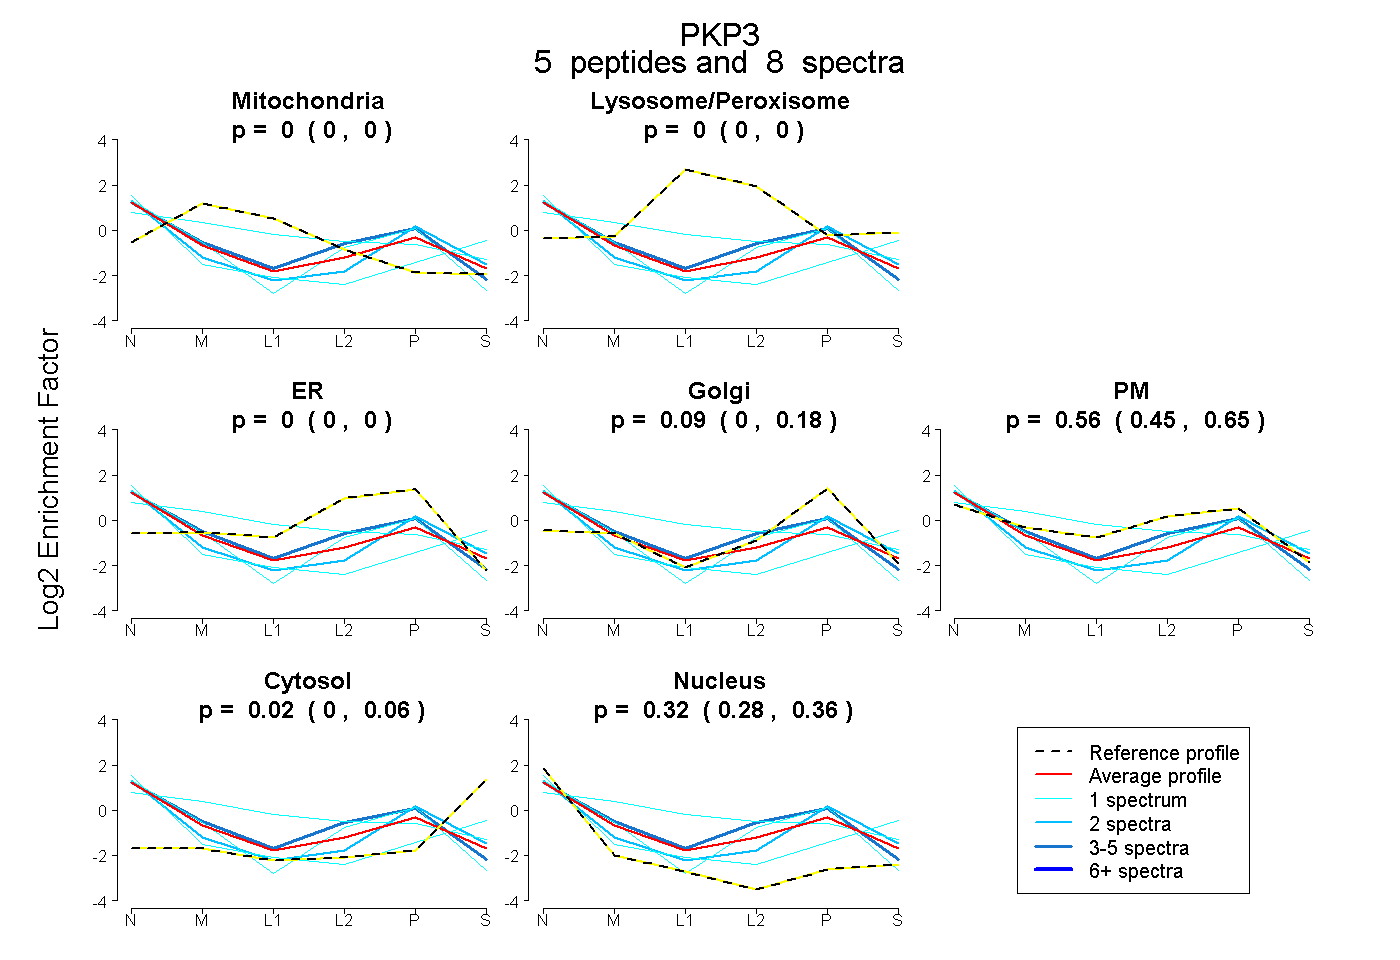 |
0.000 0.000 | 0.000 |
0.000 0.000 | 0.000 |
0.000 0.000 | 0.000 |
0.092 0.000 | 0.176 |
0.564 0.451 | 0.654 |
0.020 0.000 | 0.058 |
0.324 0.281 | 0.361 |
|||
| Plot | Lyso | Other | |||||||||||
| Expt C |
4 peptides |
6 spectra |
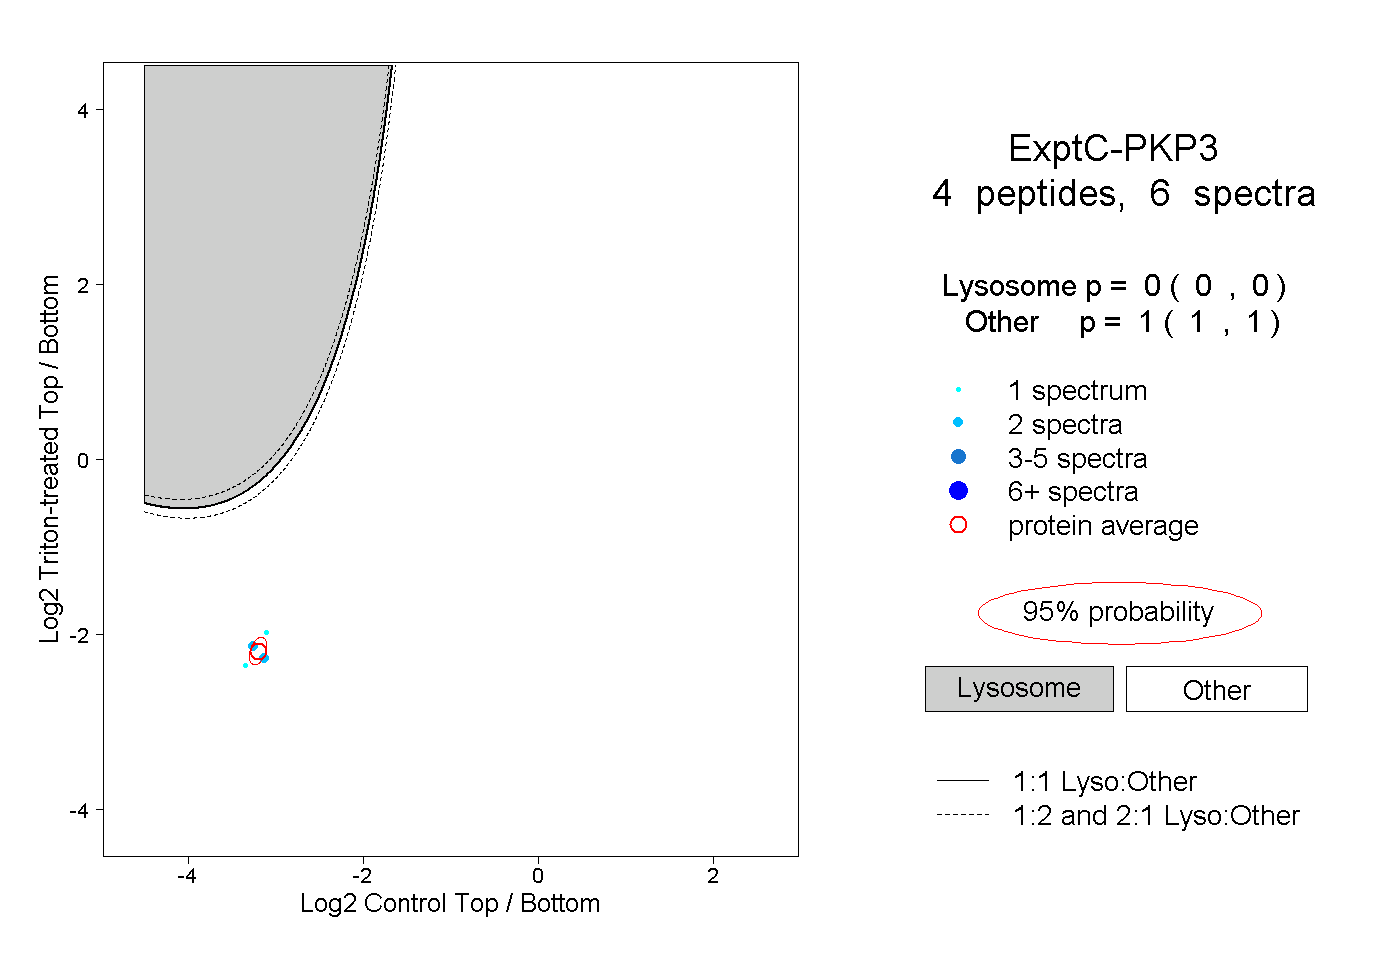 |
0.000 0.000 | 0.000 |
1.000 1.000 | 1.000 |