 54
54peptides
spectra
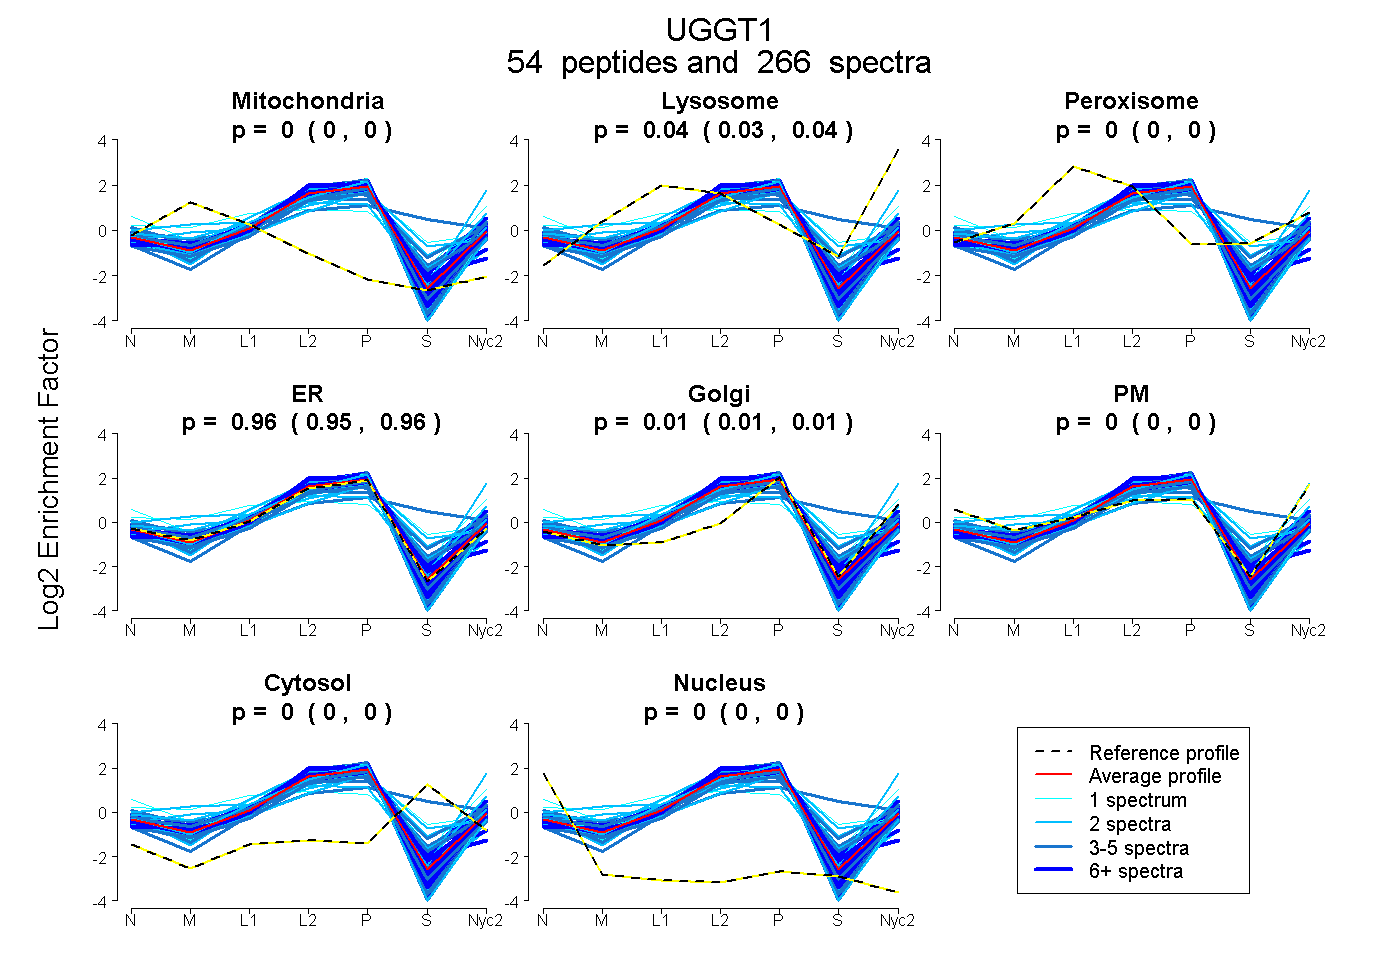
0.000 | 0.000
0.035 | 0.037
0.000 | 0.000
0.953 | 0.957
0.007 | 0.011
0.000 | 0.000
0.000 | 0.000
0.000 | 0.000
33peptides
spectra
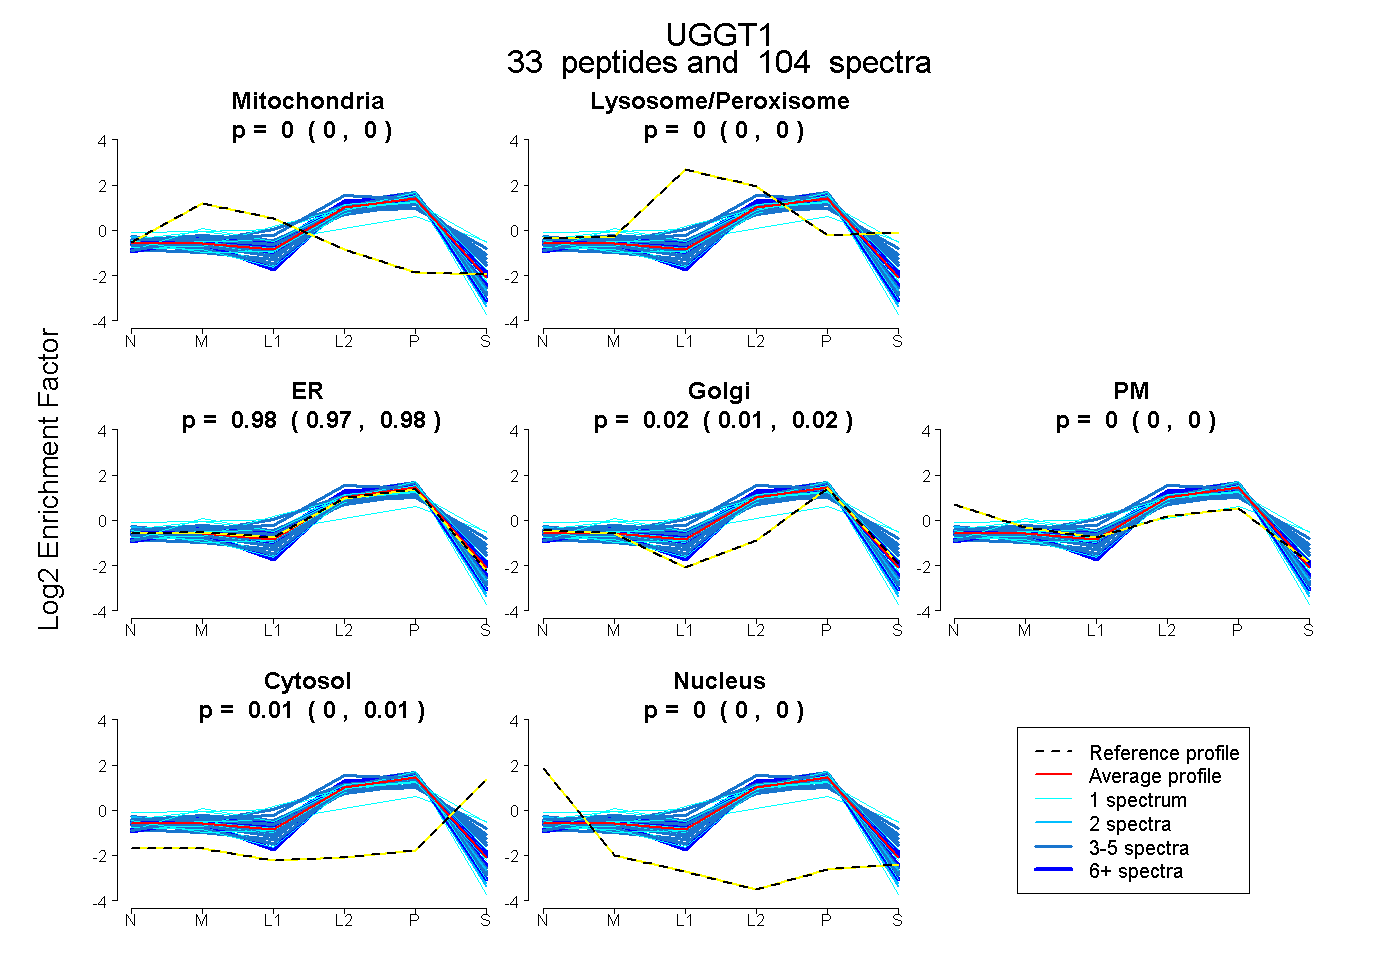
0.000 | 0.000
0.000 | 0.000
0.971 | 0.980
0.012 | 0.024
0.000 | 0.000
0.002 | 0.008
0.000 | 0.000
55peptides
spectra
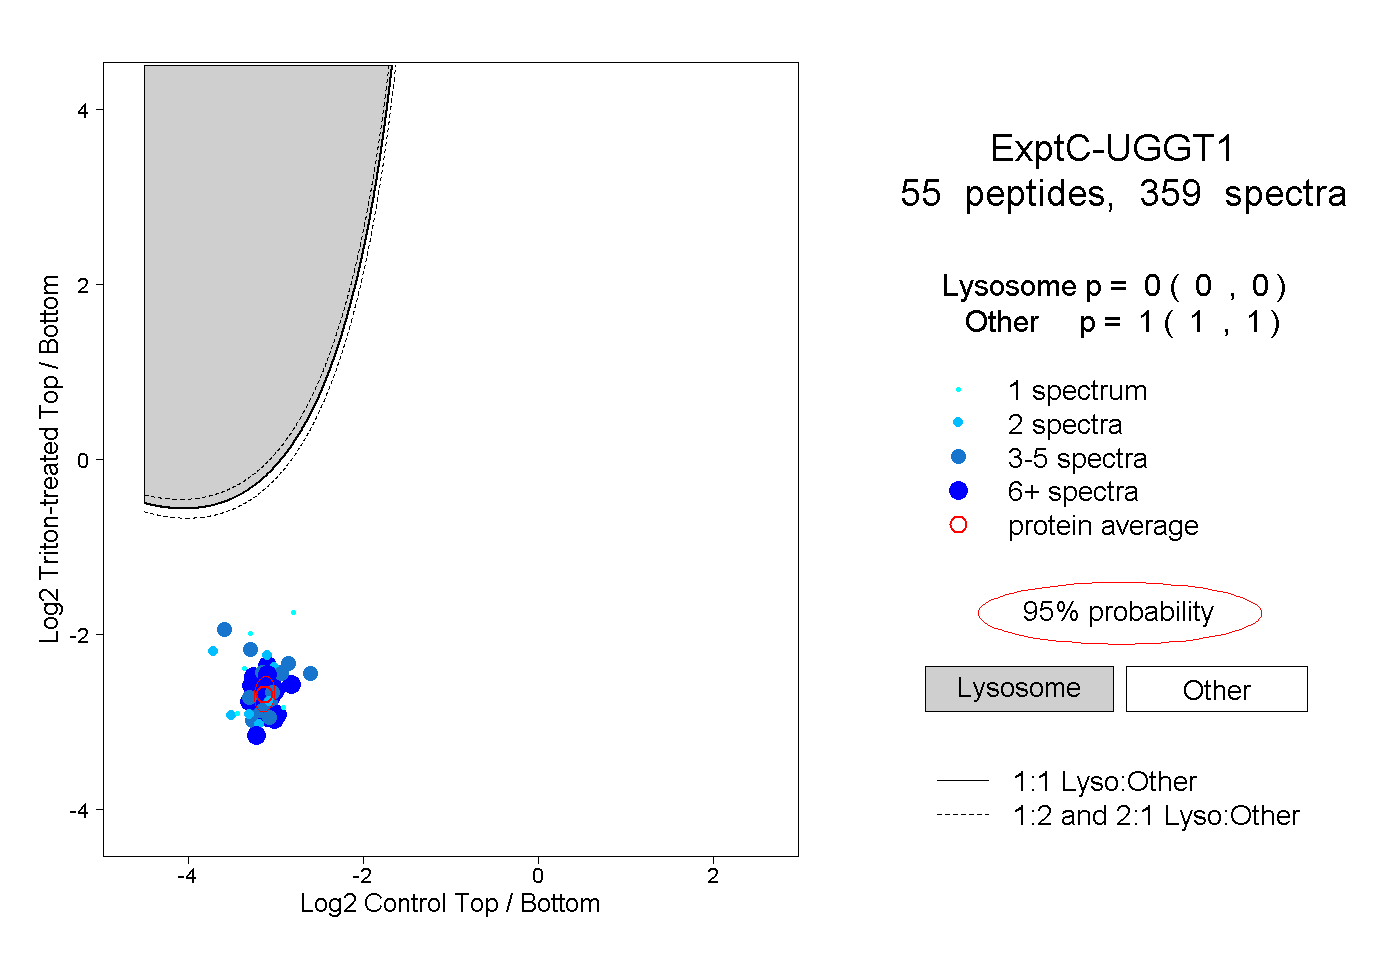
0.000 | 0.000
1.000 | 1.000
27peptides
spectra
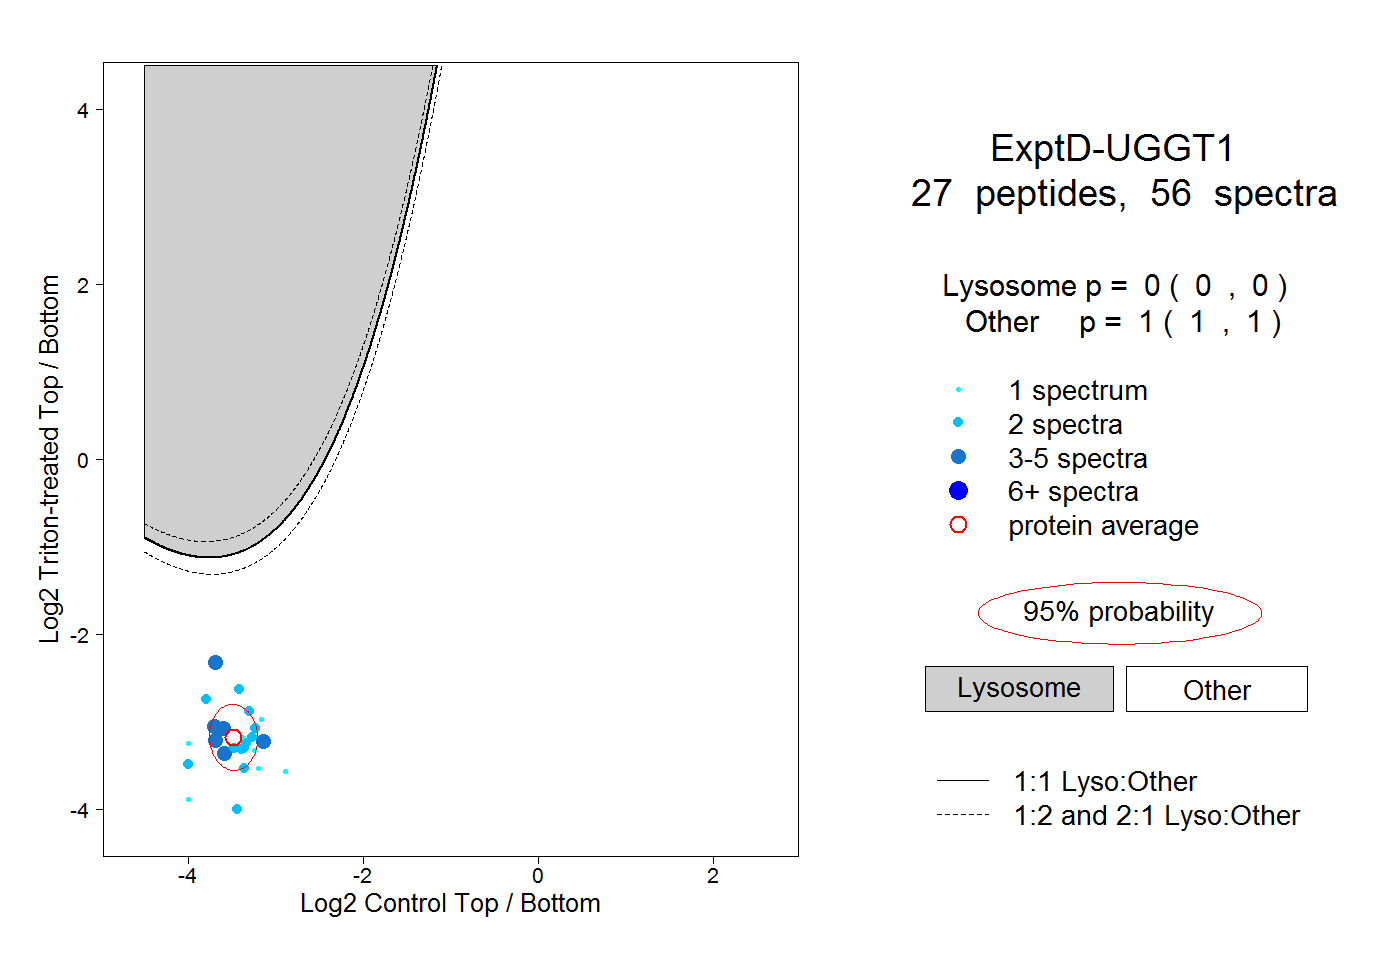
0.000 | 0.000
1.000 | 1.000