 13
13peptides
spectra
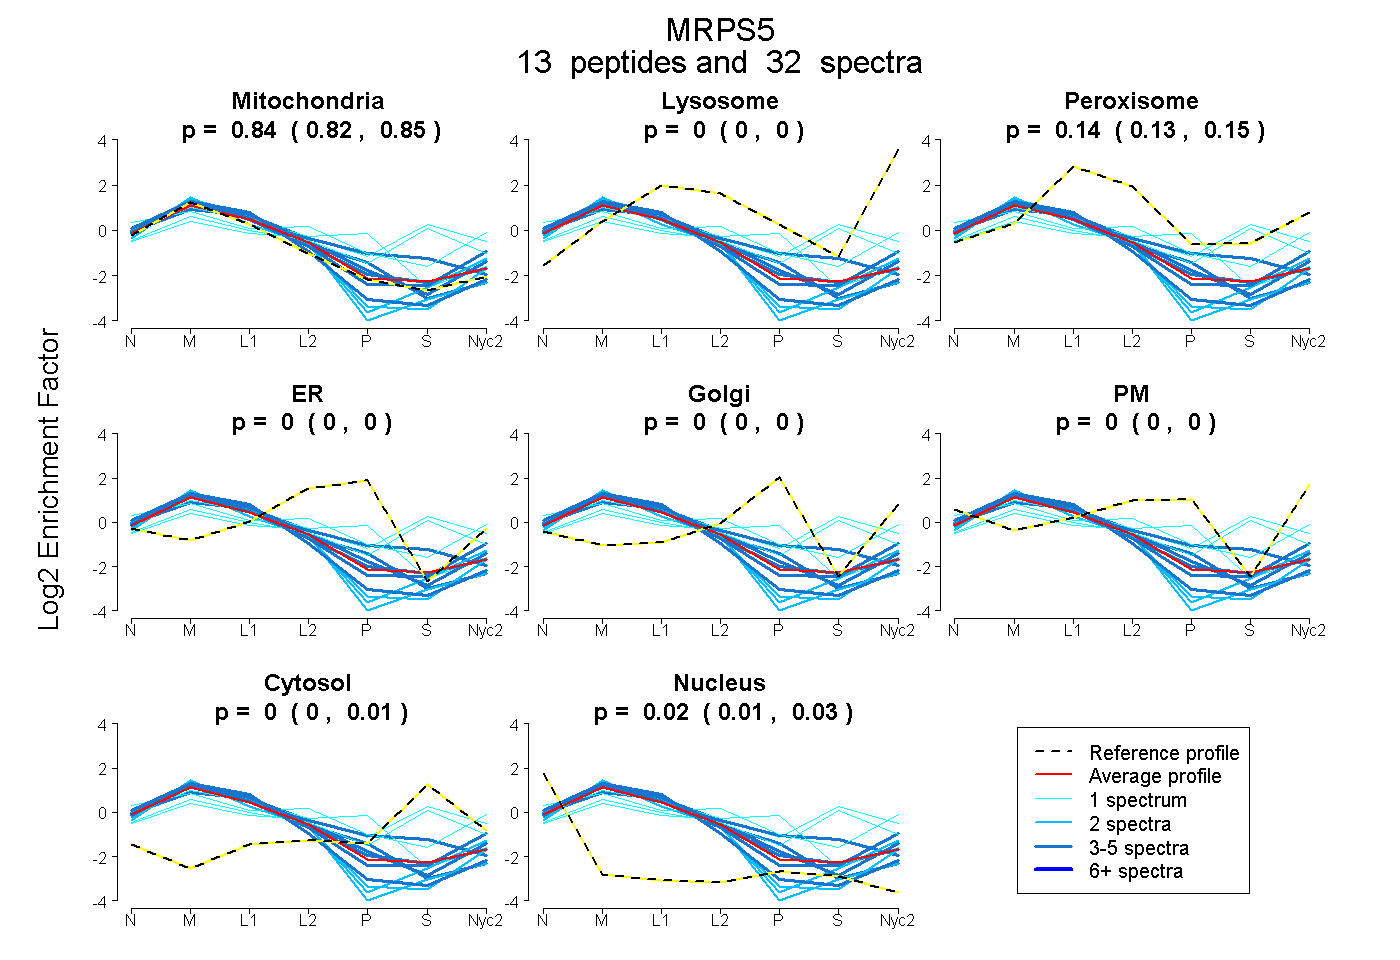
0.823 | 0.850
0.000 | 0.000
0.127 | 0.147
0.000 | 0.000
0.000 | 0.000
0.000 | 0.000
0.000 | 0.014
0.011 | 0.026
4peptides
spectra
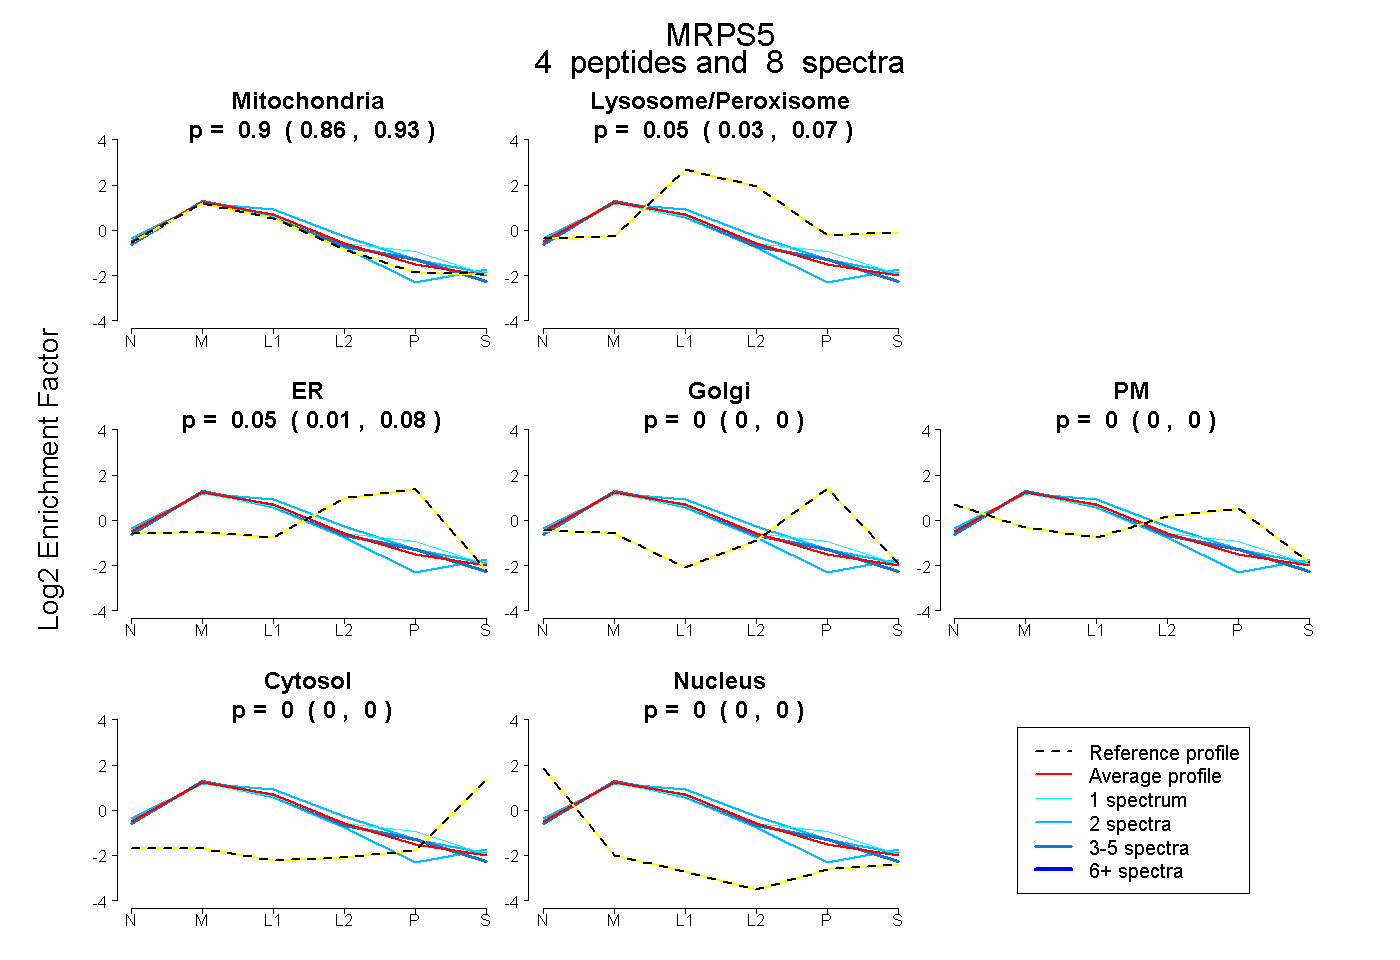
0.864 | 0.933
0.025 | 0.068
0.010 | 0.081
0.000 | 0.000
0.000 | 0.000
0.000 | 0.000
0.000 | 0.000
12peptides
spectra
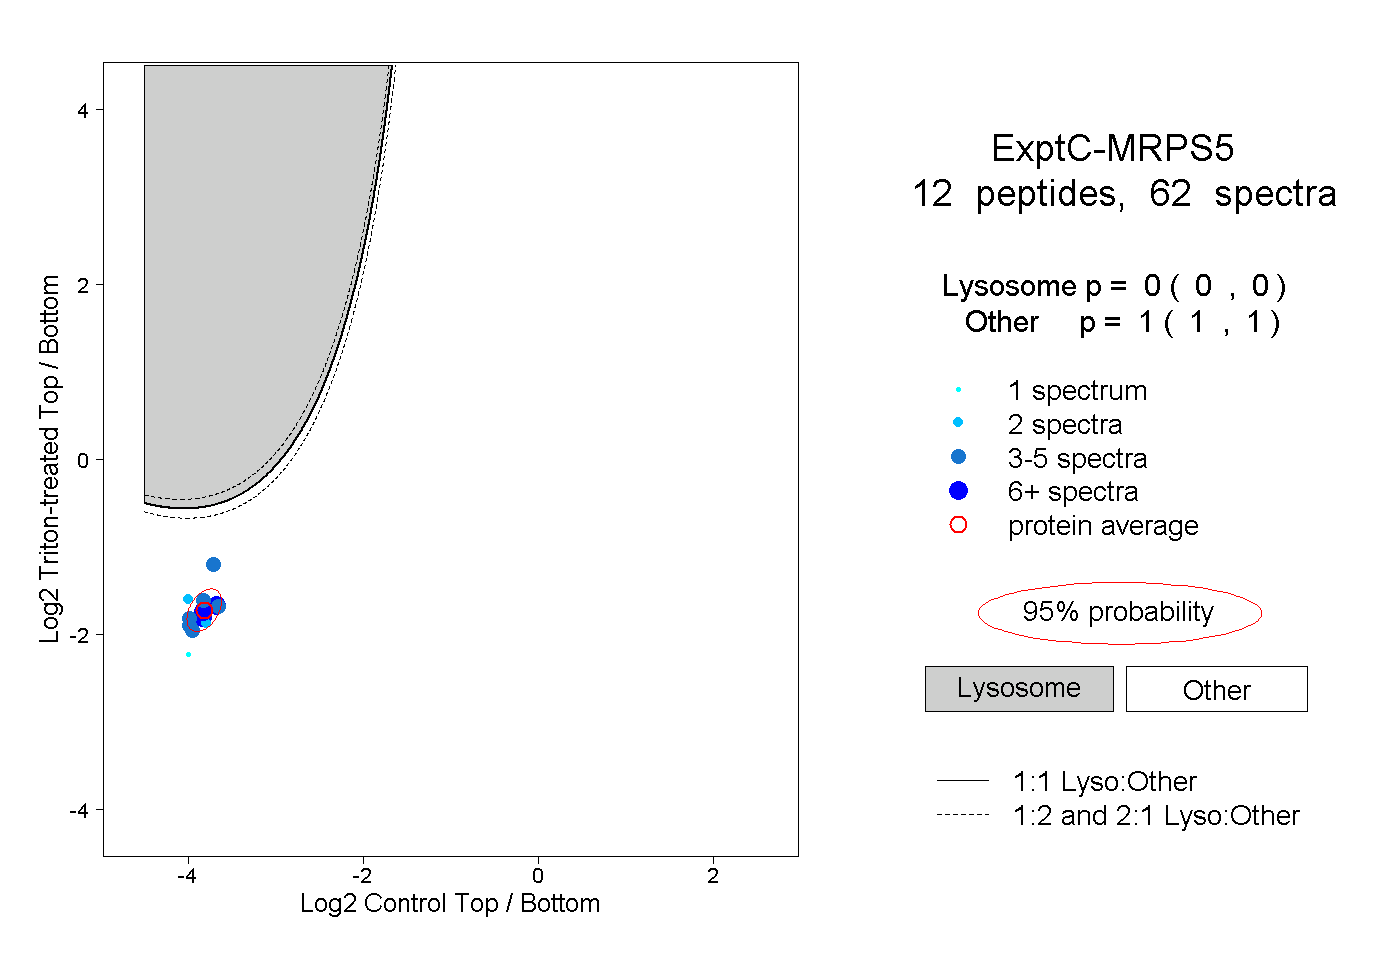
0.000 | 0.000
1.000 | 1.000
5peptides
spectra
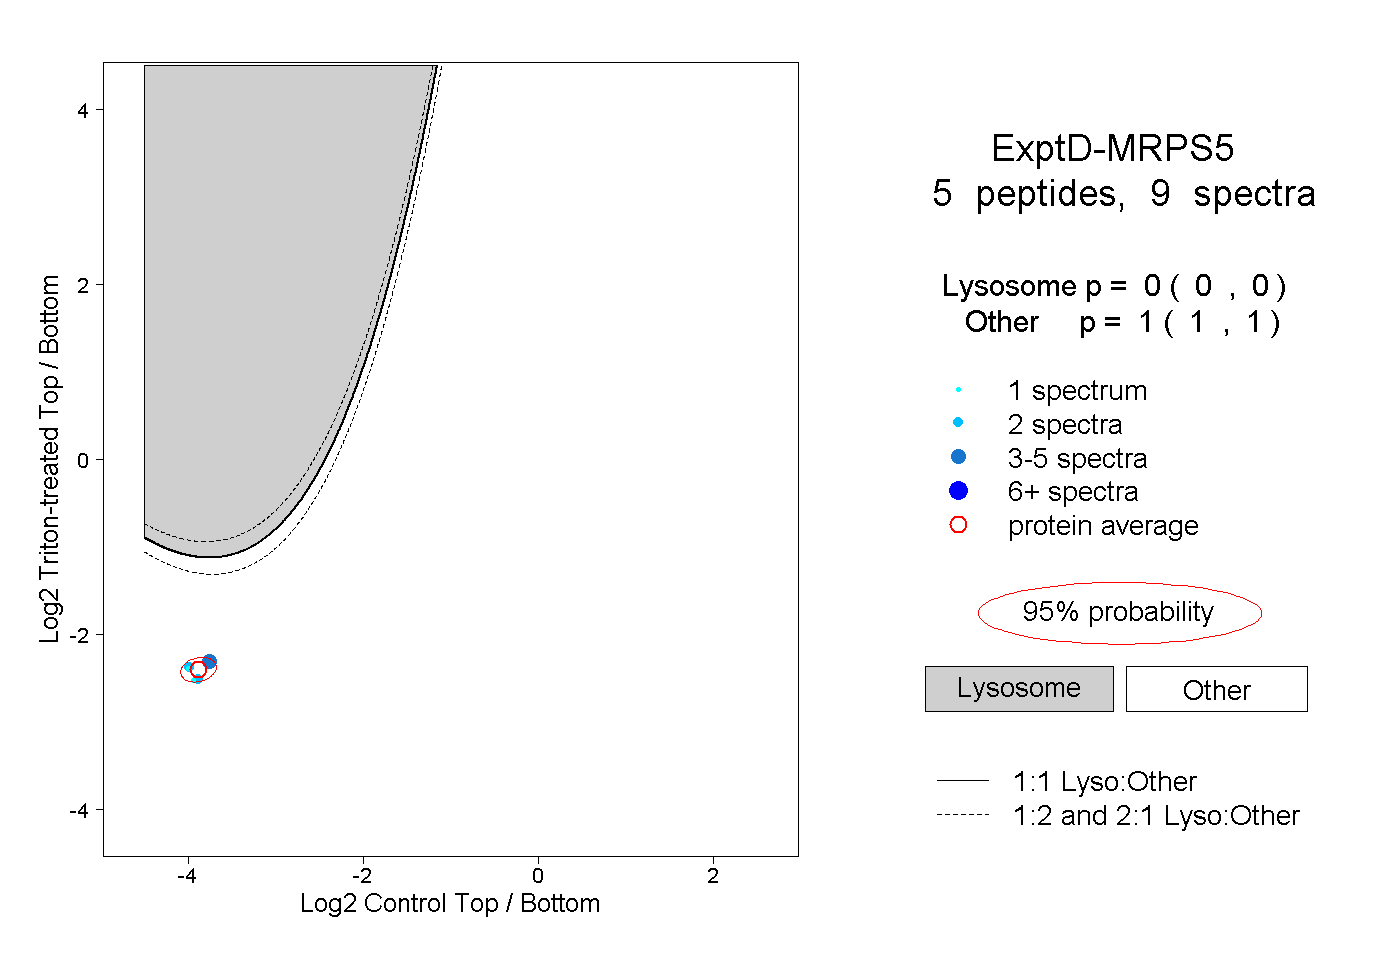
0.000 | 0.000
1.000 | 1.000