MRPS5
[ENSRNOP00000020451]
Main page
| | | Plot |
Mito |
Lyso |
|
Perox |
ER |
Golgi |
PM |
Cytosol |
Nucleus |
|
| Expt A |
 13
13
peptides |
32
spectra |
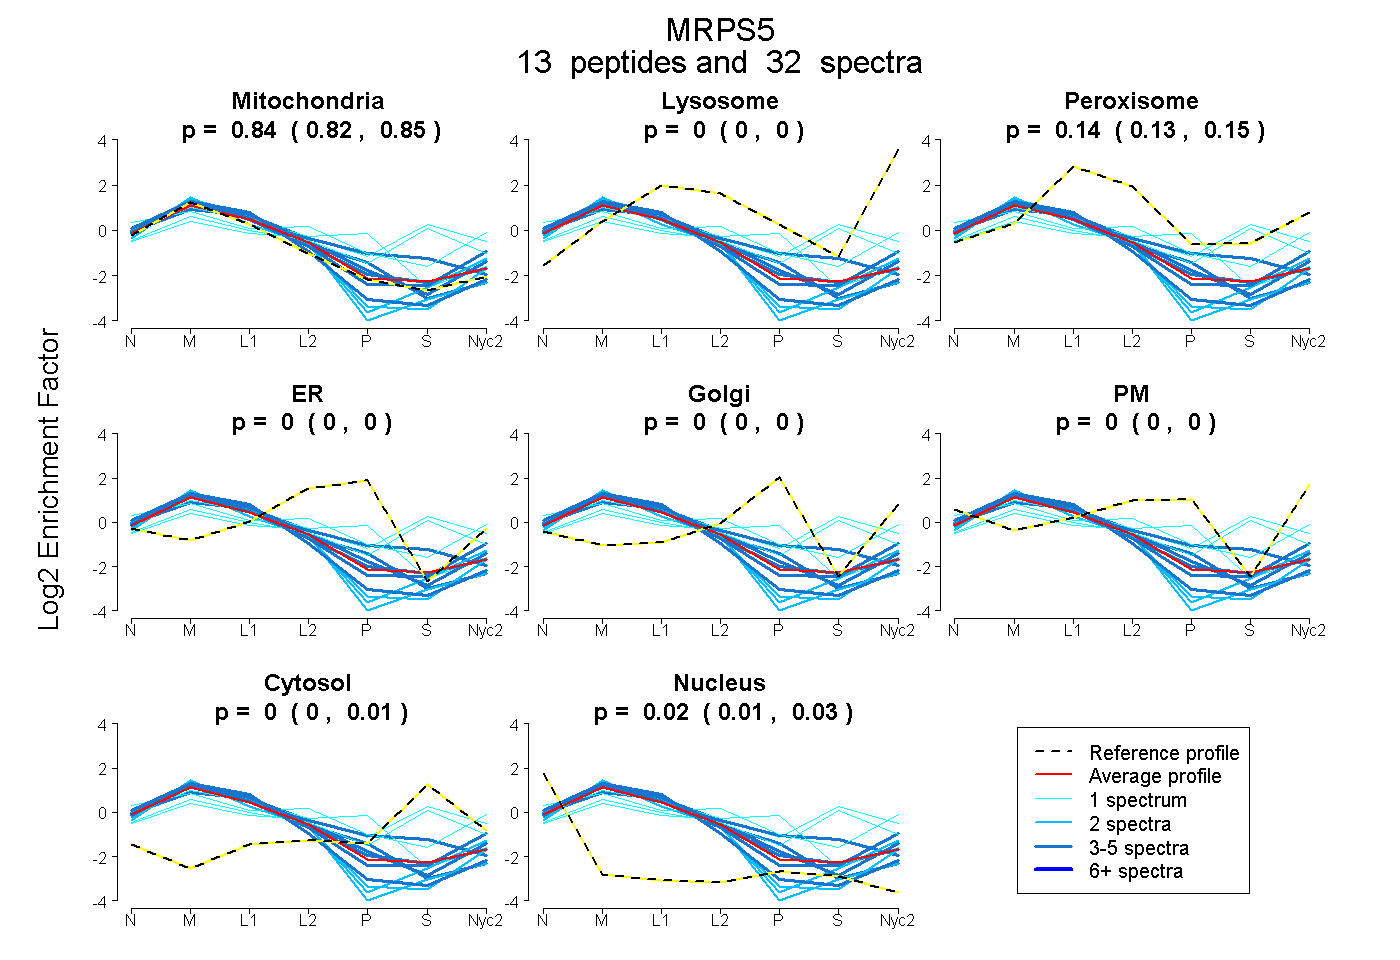 |
0.836
0.823 | 0.850 |
0.000
0.000 | 0.000 |
|
0.141
0.127 | 0.147 |
0.000
0.000 | 0.000 |
0.000
0.000 | 0.000 |
0.000
0.000 | 0.000 |
0.000
0.000 | 0.014 |
0.023
0.011 | 0.026 |
|
| | | Plot |
Mito |
|
Lyso or Perox |
|
ER |
Golgi |
PM |
Cytosol |
Nucleus |
|
| Expt B |
4
peptides |
8
spectra |
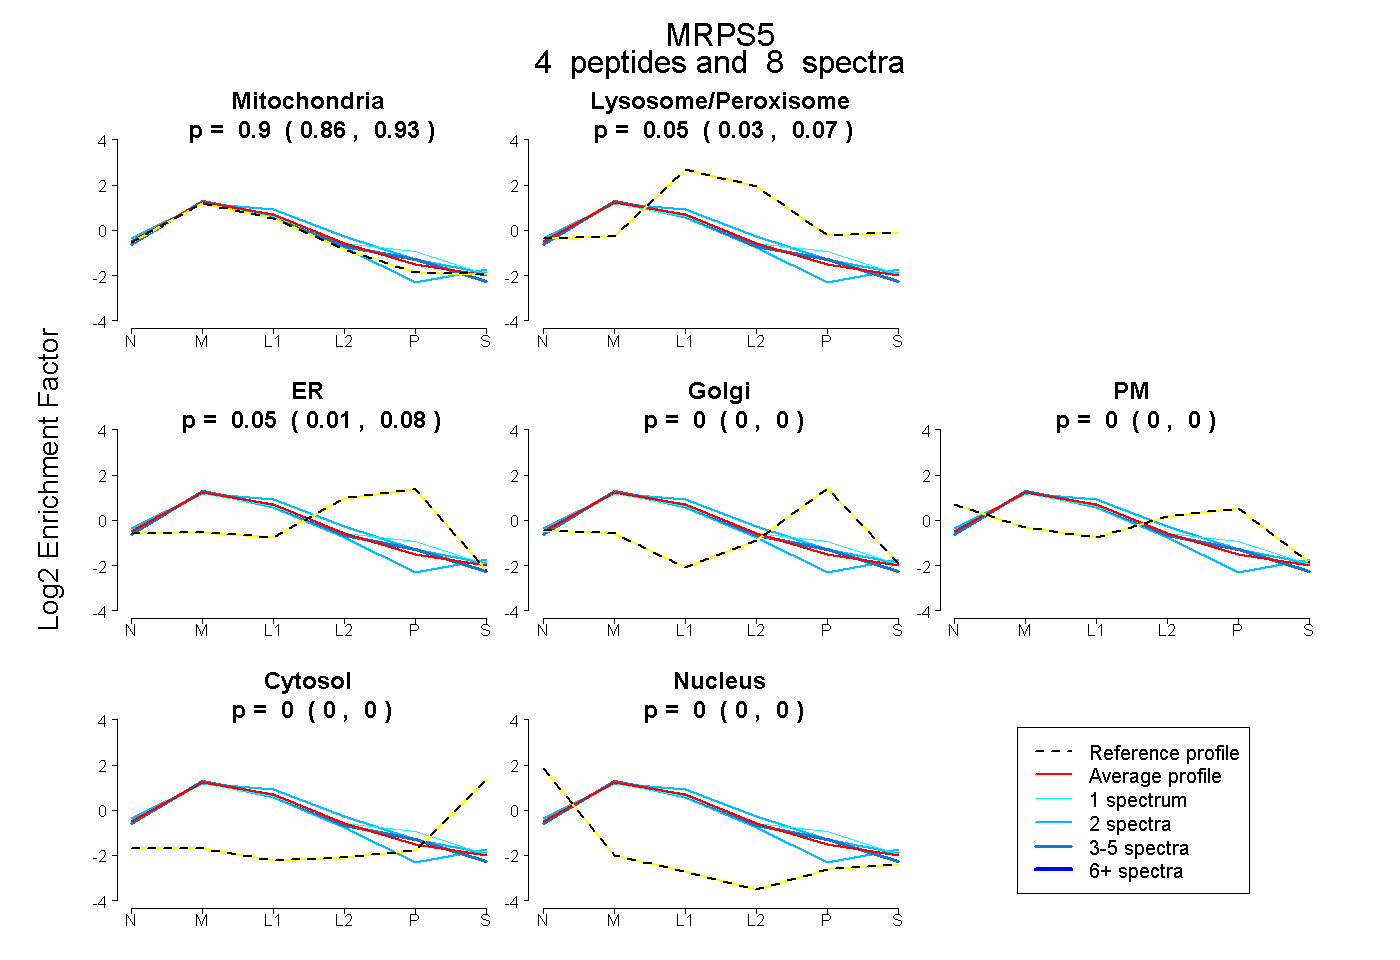 |
0.902
0.864 | 0.933 |
|
0.050
0.025 | 0.068 |
|
0.049
0.010 | 0.081 |
0.000
0.000 | 0.000 |
0.000
0.000 | 0.000 |
0.000
0.000 | 0.000 |
0.000
0.000 | 0.000 |
|
| 2 spectra, AIITICR |
0.804 |
|
0.141 |
|
0.056 |
0.000 |
0.000 |
0.000 |
0.000 |
|
| 2 spectra, GALAETGAGAR |
0.988 |
|
0.000 |
|
0.000 |
0.000 |
0.000 |
0.012 |
0.000 |
|
| 3 spectra, GLFHGLAR |
0.898 |
|
0.000 |
|
0.102 |
0.000 |
0.000 |
0.000 |
0.000 |
|
| 1 spectrum, GQIIGEGR |
0.795 |
|
0.046 |
|
0.153 |
0.006 |
0.000 |
0.000 |
0.000 |
|
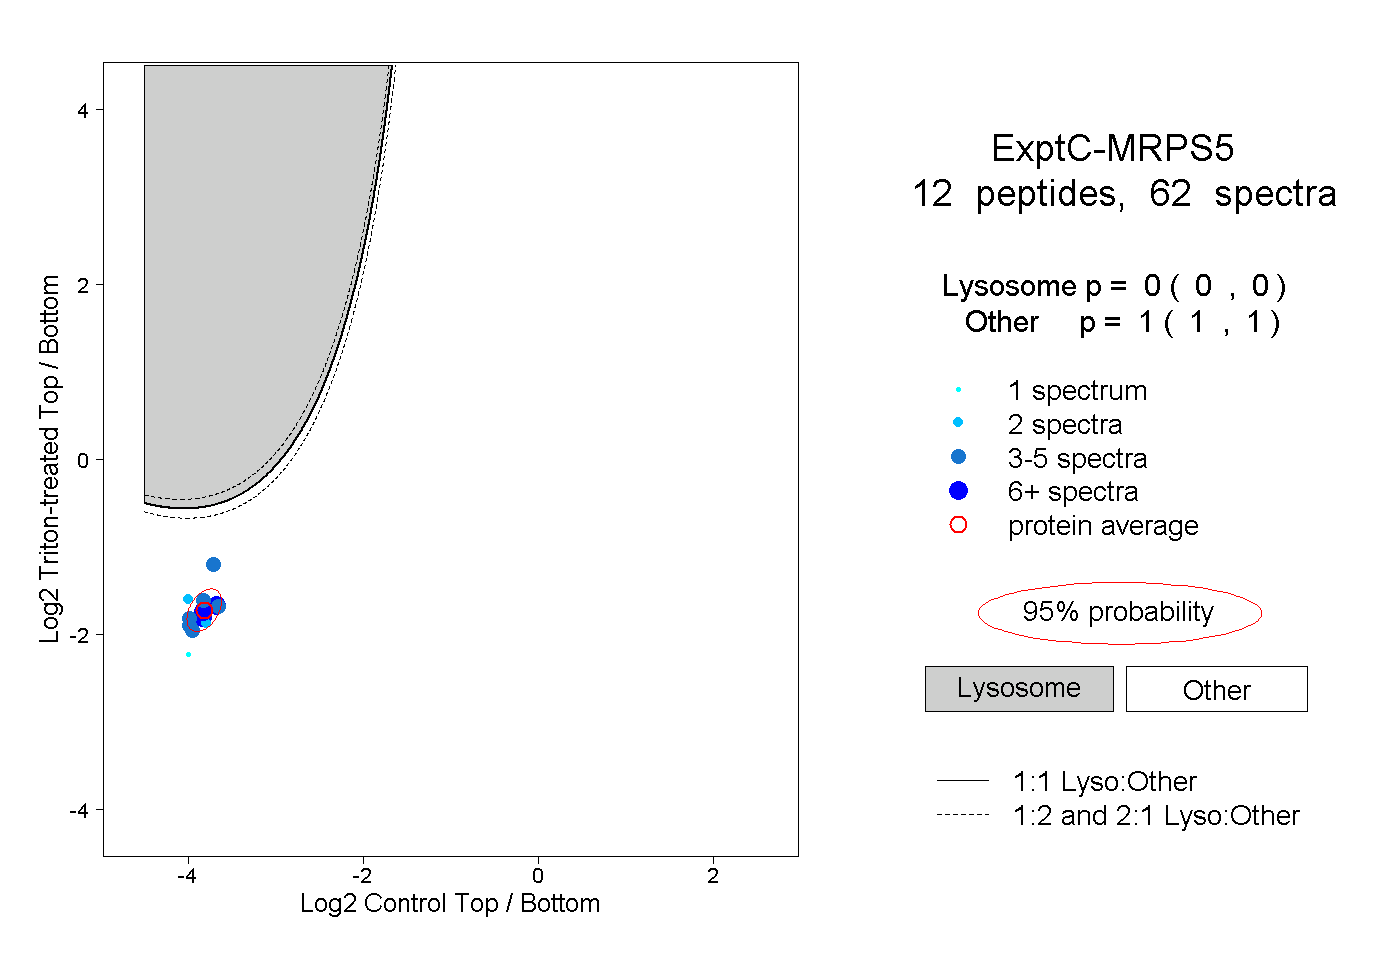
| | | Plot |
|
Lyso |
|
|
|
|
|
|
|
Other |
| Expt C |
12
peptides |
62
spectra |
 |
|
0.000
0.000 | 0.000 |
|
|
|
|
|
|
|
1.000
1.000 | 1.000 |
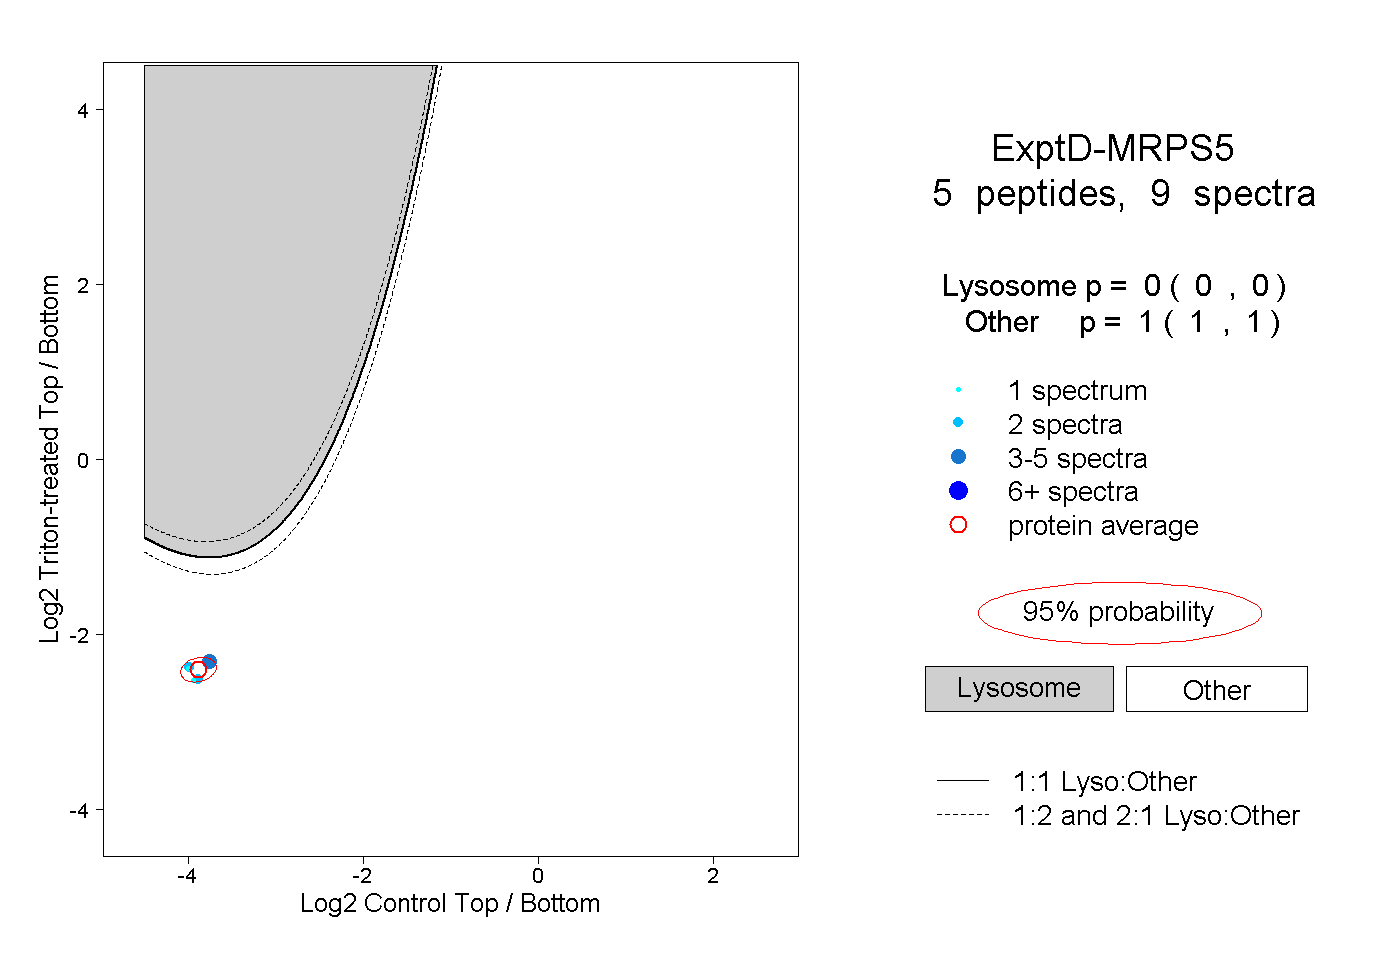
| | | Plot |
|
Lyso |
|
|
|
|
|
|
|
Other |
| Expt D |
5
peptides |
9
spectra |
 |
|
0.000
0.000 | 0.000 |
|
|
|
|
|
|
|
1.000
1.000 | 1.000 |