 13
13peptides
spectra
0.823 | 0.850
0.000 | 0.000
0.127 | 0.147
0.000 | 0.000
0.000 | 0.000
0.000 | 0.000
0.000 | 0.014
0.011 | 0.026
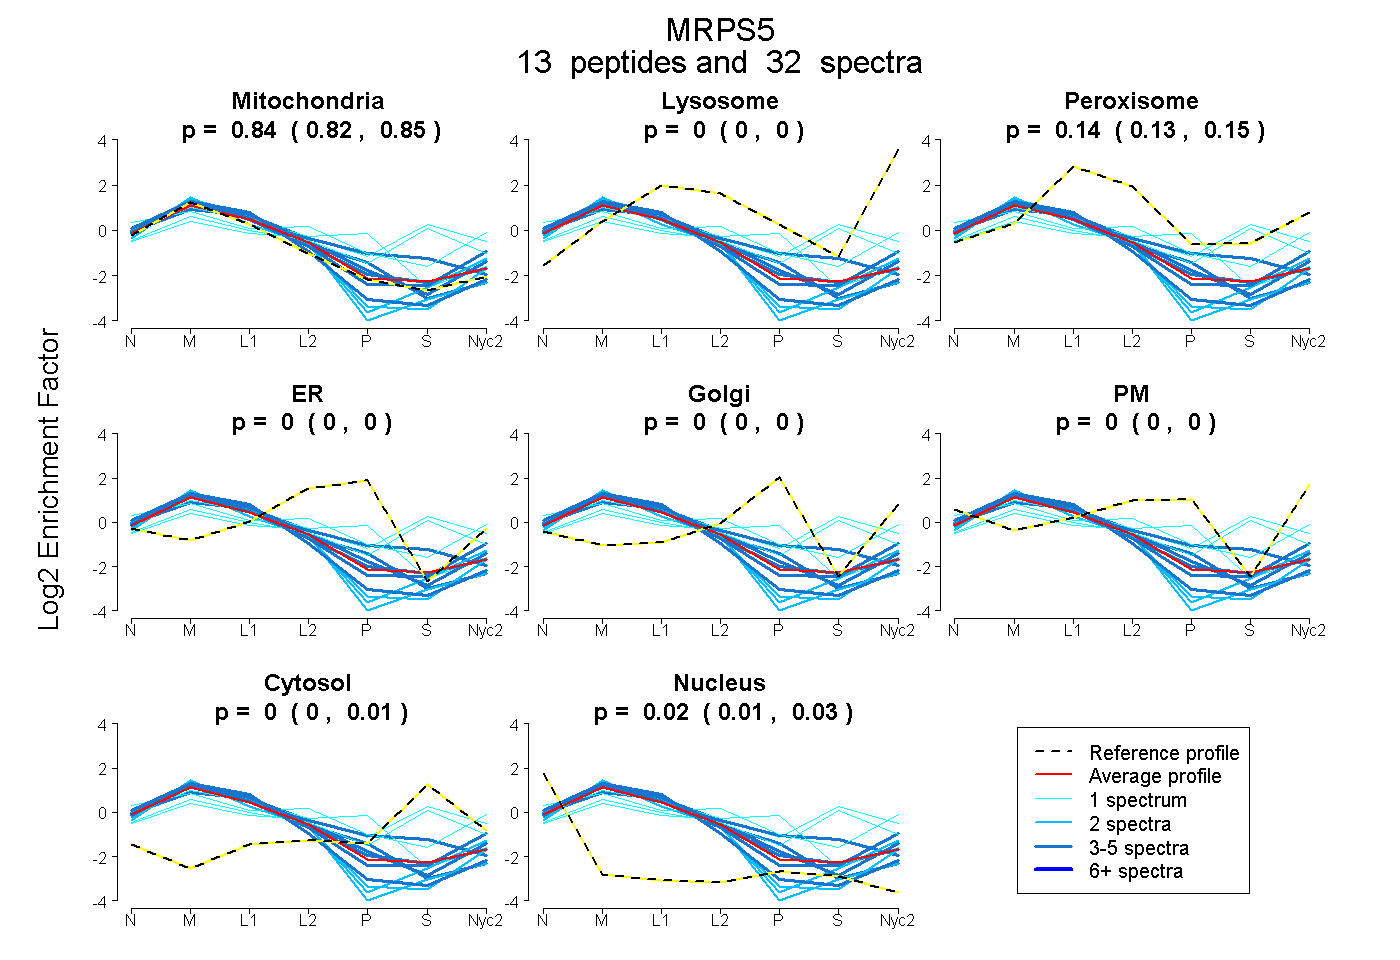
| Plot | Mito | Lyso | Perox | ER | Golgi | PM | Cytosol | Nucleus | |||||
| Expt A |
13 peptides |
32 spectra |
|
0.836 0.823 | 0.850 |
0.000 0.000 | 0.000 |
0.141 0.127 | 0.147 |
0.000 0.000 | 0.000 |
0.000 0.000 | 0.000 |
0.000 0.000 | 0.000 |
0.000 0.000 | 0.014 |
0.023 0.011 | 0.026 |
| 3 spectra, SVWFNLK | 0.835 | 0.026 | 0.064 | 0.000 | 0.000 | 0.075 | 0.000 | 0.000 | ||
| 2 spectra, GLHVVEFR | 1.000 | 0.000 | 0.000 | 0.000 | 0.000 | 0.000 | 0.000 | 0.000 | ||
| 1 spectrum, QETHQHLADK | 0.466 | 0.014 | 0.119 | 0.000 | 0.000 | 0.333 | 0.067 | 0.000 | ||
| 1 spectrum, AIHYLHYIER | 0.307 | 0.063 | 0.225 | 0.000 | 0.000 | 0.000 | 0.405 | 0.000 | ||
| 2 spectra, LDWQDVK | 0.929 | 0.000 | 0.071 | 0.000 | 0.000 | 0.000 | 0.000 | 0.000 | ||
| 4 spectra, AIITICR | 0.643 | 0.000 | 0.180 | 0.070 | 0.000 | 0.000 | 0.107 | 0.000 | ||
| 1 spectrum, AMQGMK | 0.626 | 0.000 | 0.006 | 0.369 | 0.000 | 0.000 | 0.000 | 0.000 | ||
| 4 spectra, GALAETGAGAR | 0.859 | 0.000 | 0.129 | 0.000 | 0.000 | 0.004 | 0.000 | 0.009 | ||
| 1 spectrum, VEADMAEQR | 0.412 | 0.000 | 0.233 | 0.000 | 0.000 | 0.000 | 0.355 | 0.000 | ||
| 3 spectra, SGVVQNIGQR | 0.868 | 0.132 | 0.000 | 0.000 | 0.000 | 0.000 | 0.000 | 0.000 | ||
| 5 spectra, GLFHGLAR | 0.879 | 0.000 | 0.000 | 0.121 | 0.000 | 0.000 | 0.000 | 0.000 | ||
| 3 spectra, YEGHTIFHDISLR | 1.000 | 0.000 | 0.000 | 0.000 | 0.000 | 0.000 | 0.000 | 0.000 | ||
| 2 spectra, LTAEELWK | 1.000 | 0.000 | 0.000 | 0.000 | 0.000 | 0.000 | 0.000 | 0.000 |
| Plot | Mito | Lyso or Perox | ER | Golgi | PM | Cytosol | Nucleus | ||||||
| Expt B |
4 peptides |
8 spectra |
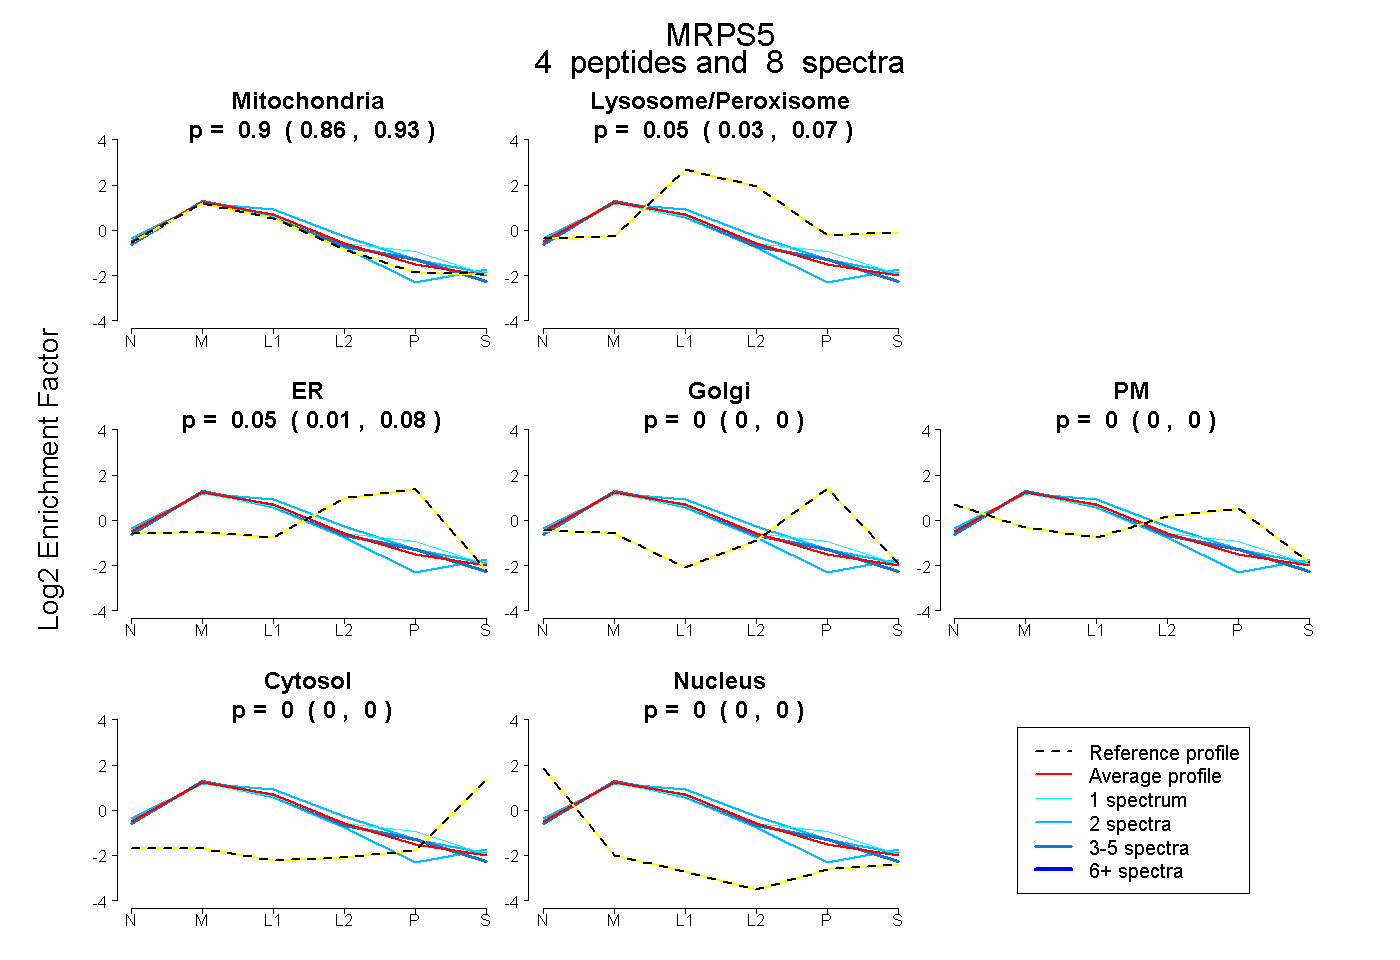 |
0.902 0.864 | 0.933 |
0.050 0.025 | 0.068 |
0.049 0.010 | 0.081 |
0.000 0.000 | 0.000 |
0.000 0.000 | 0.000 |
0.000 0.000 | 0.000 |
0.000 0.000 | 0.000 |
|||
| Plot | Lyso | Other | |||||||||||
| Expt C |
12 peptides |
62 spectra |
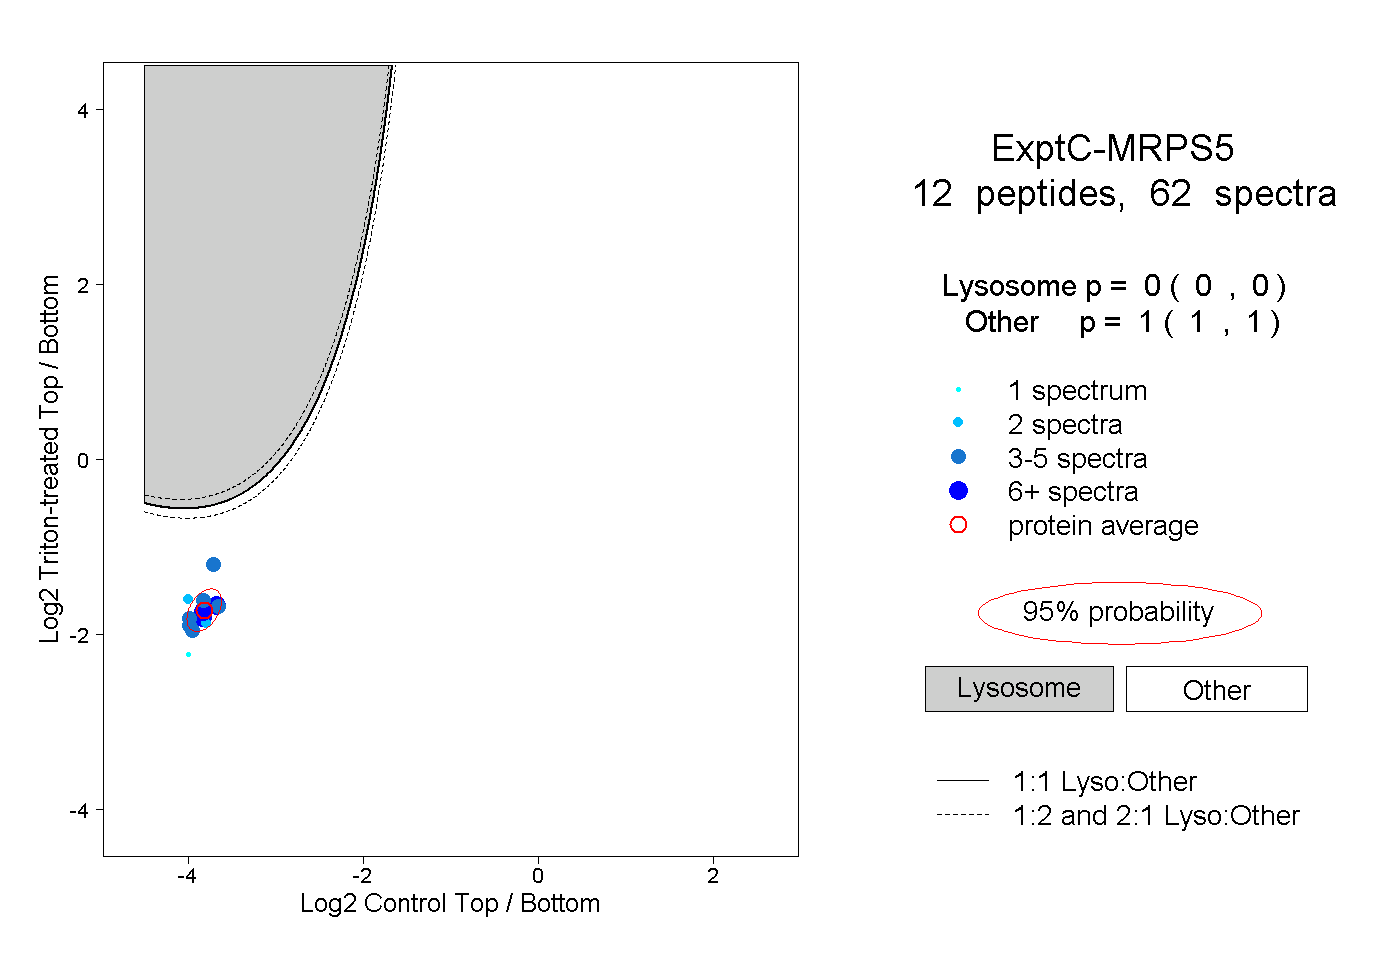 |
0.000 0.000 | 0.000 |
1.000 1.000 | 1.000 |
||||||||
| Plot | Lyso | Other | |||||||||||
| Expt D |
5 peptides |
9 spectra |
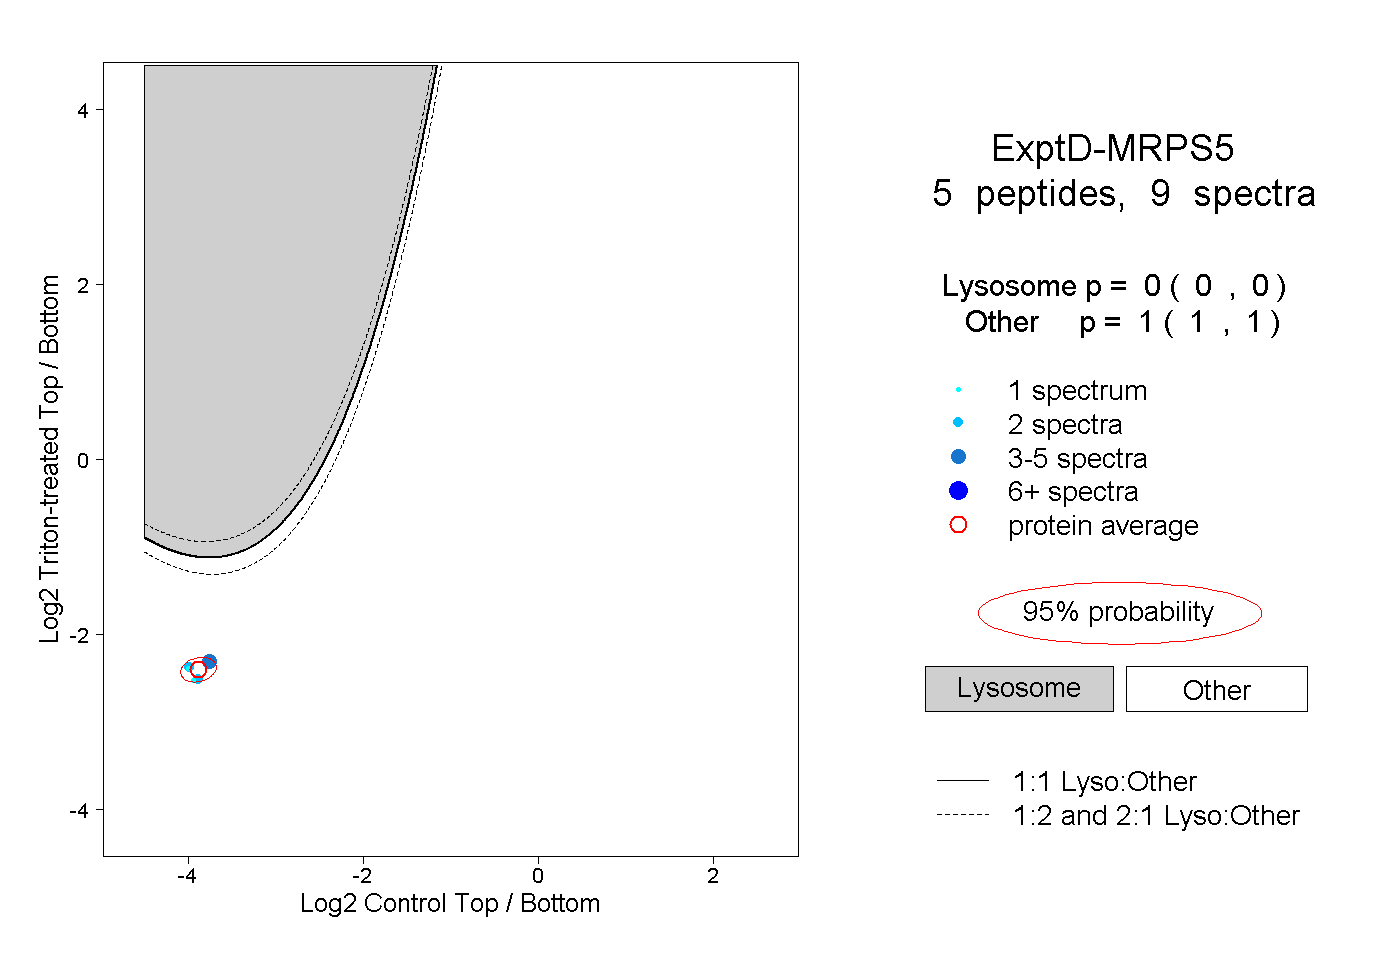 |
0.000 0.000 | 0.000 |
1.000 1.000 | 1.000 |