 8
8peptides
spectra
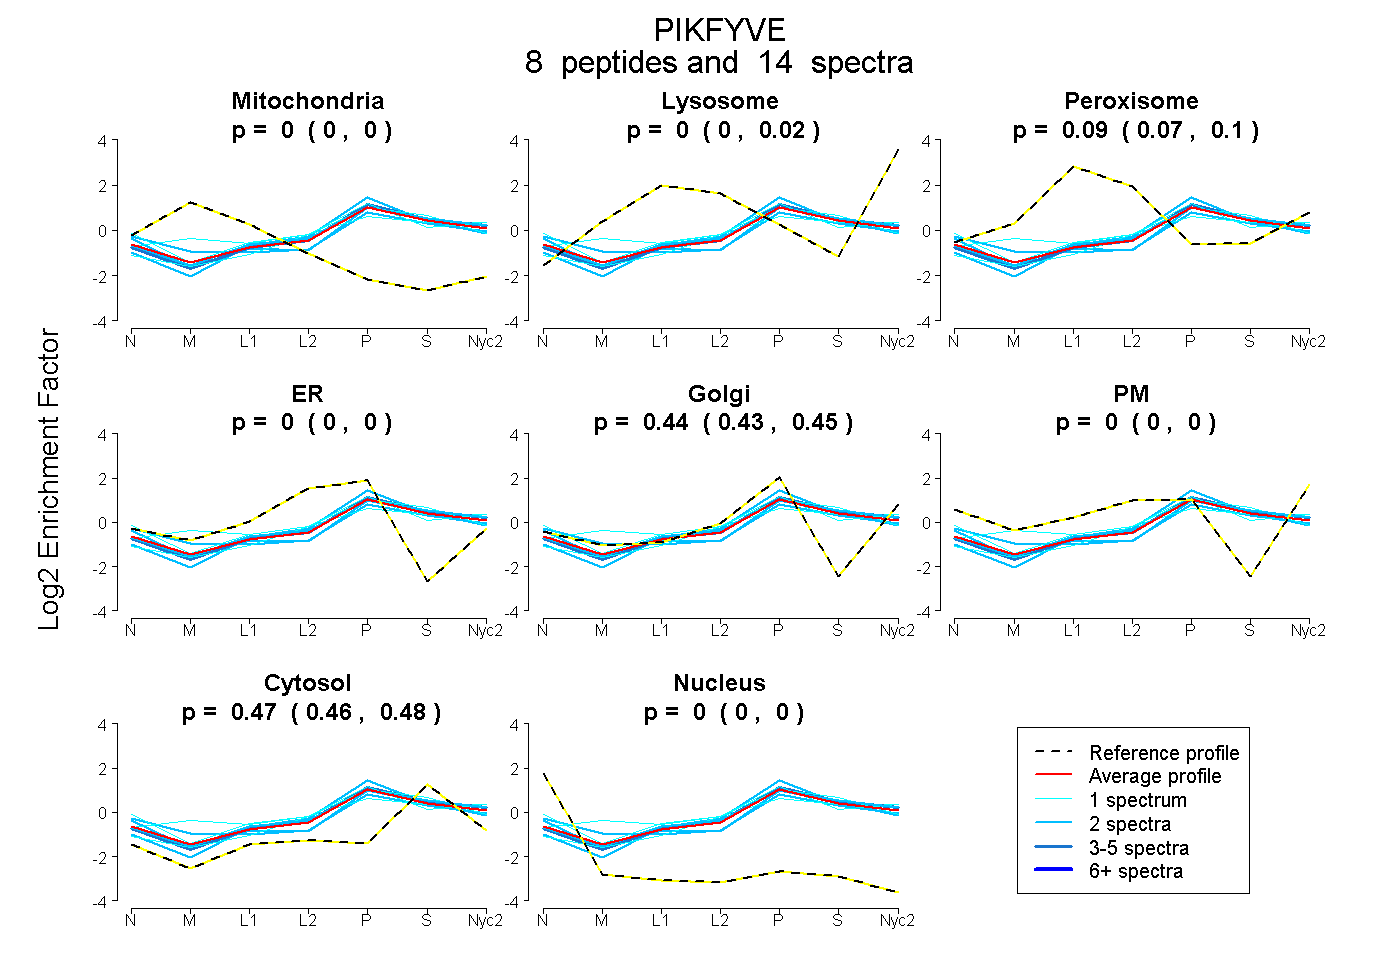
0.000 | 0.000
0.000 | 0.015
0.072 | 0.097
0.000 | 0.000
0.431 | 0.448
0.000 | 0.000
0.460 | 0.476
0.000 | 0.000
1peptide
spectrum
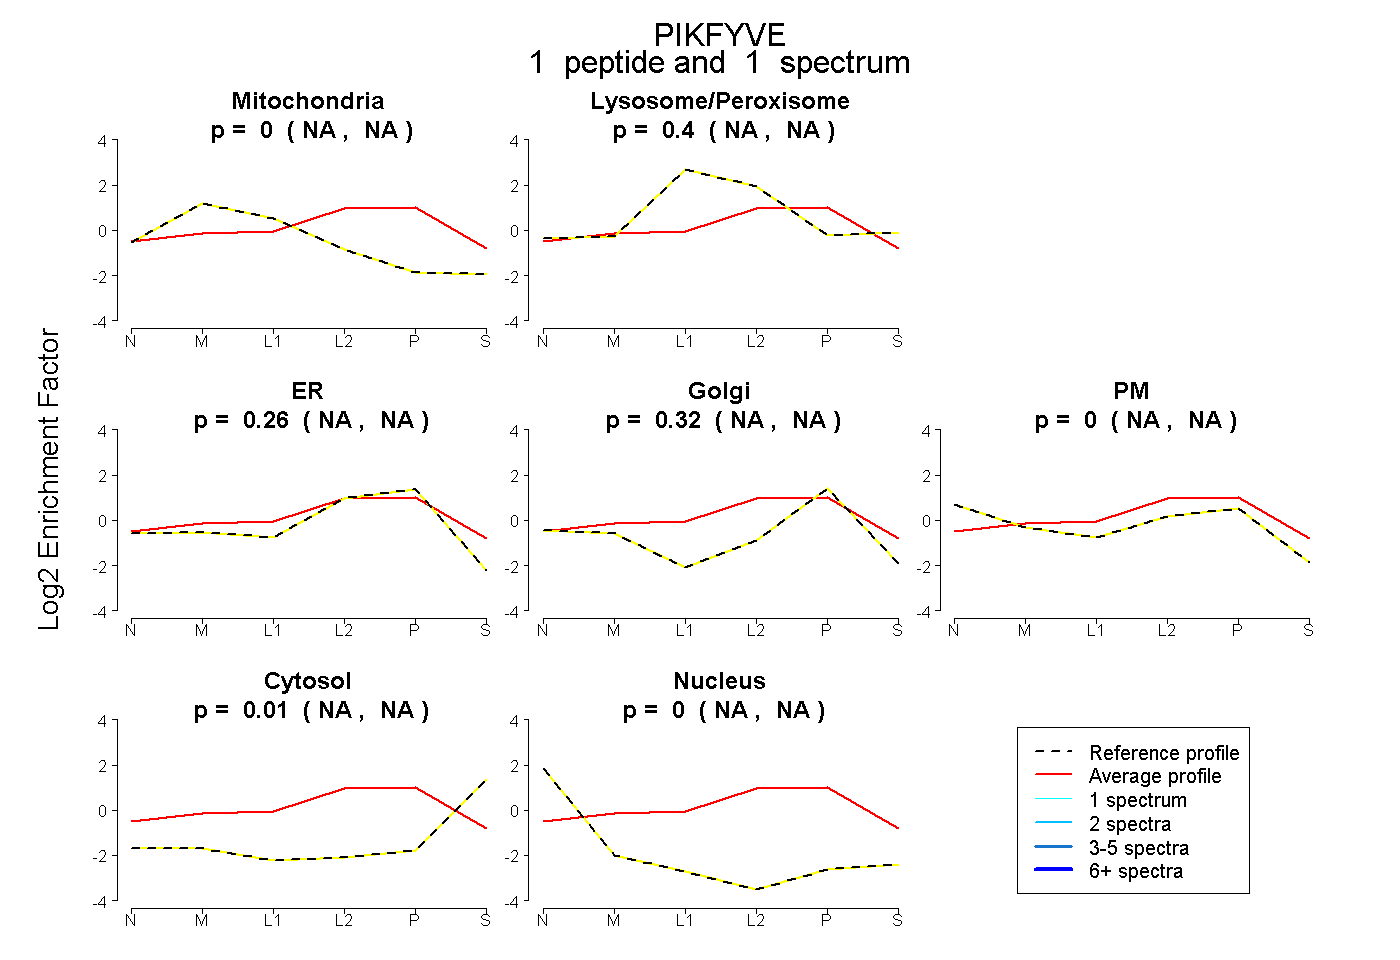
NA | NA
NA | NA
NA | NA
NA | NA
NA | NA
NA | NA
NA | NA
7peptides
spectra
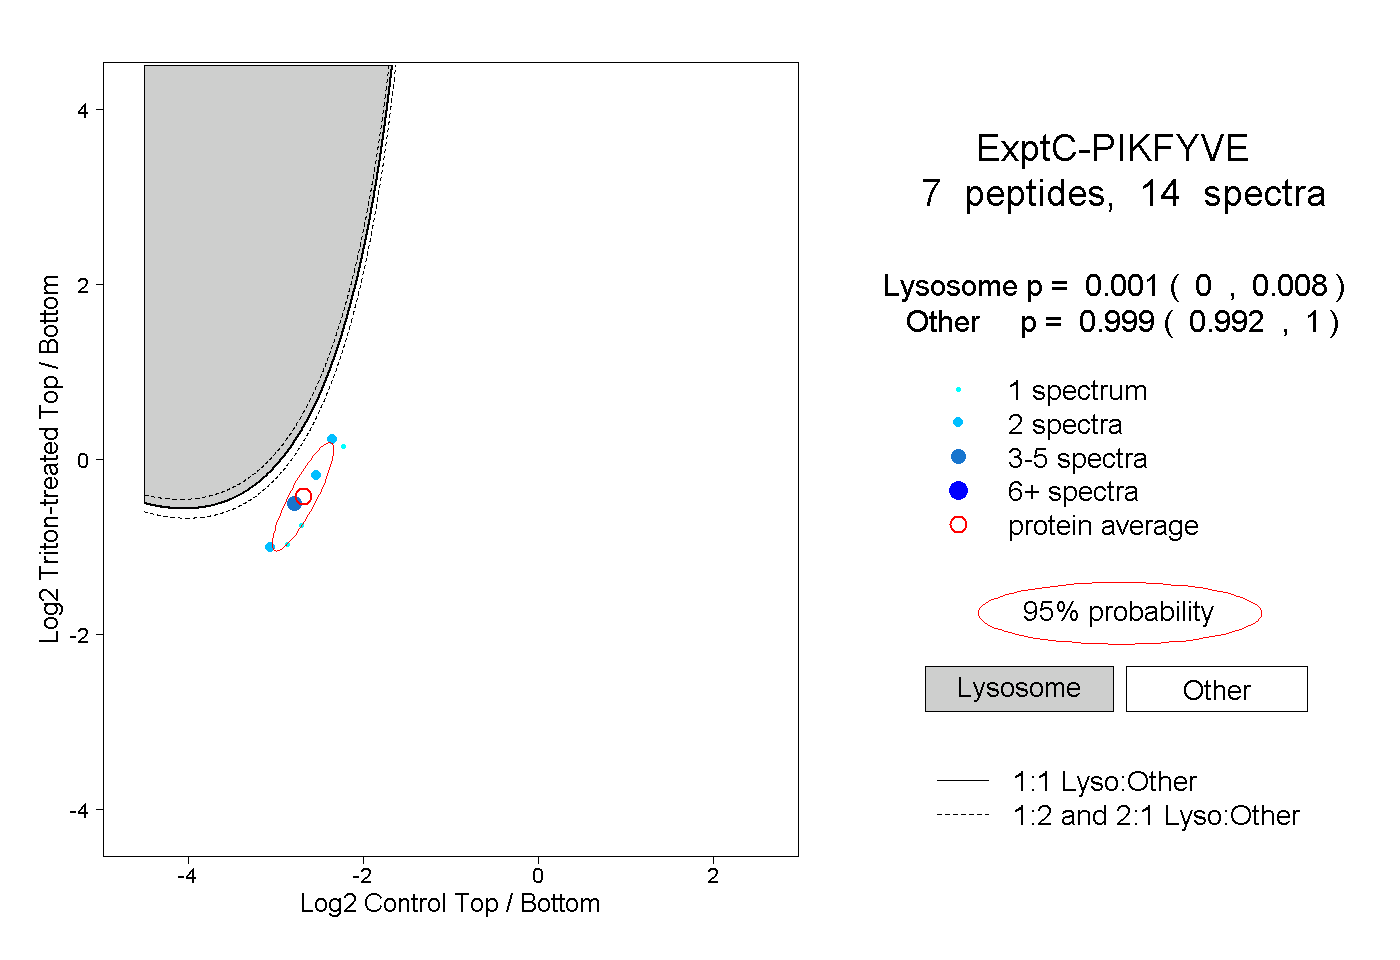
0.000 | 0.008
0.992 | 1.000