 8
8peptides
spectra
0.000 | 0.000
0.000 | 0.015
0.072 | 0.097
0.000 | 0.000
0.431 | 0.448
0.000 | 0.000
0.460 | 0.476
0.000 | 0.000
| Plot | Mito | Lyso | Perox | ER | Golgi | PM | Cytosol | Nucleus | |||||
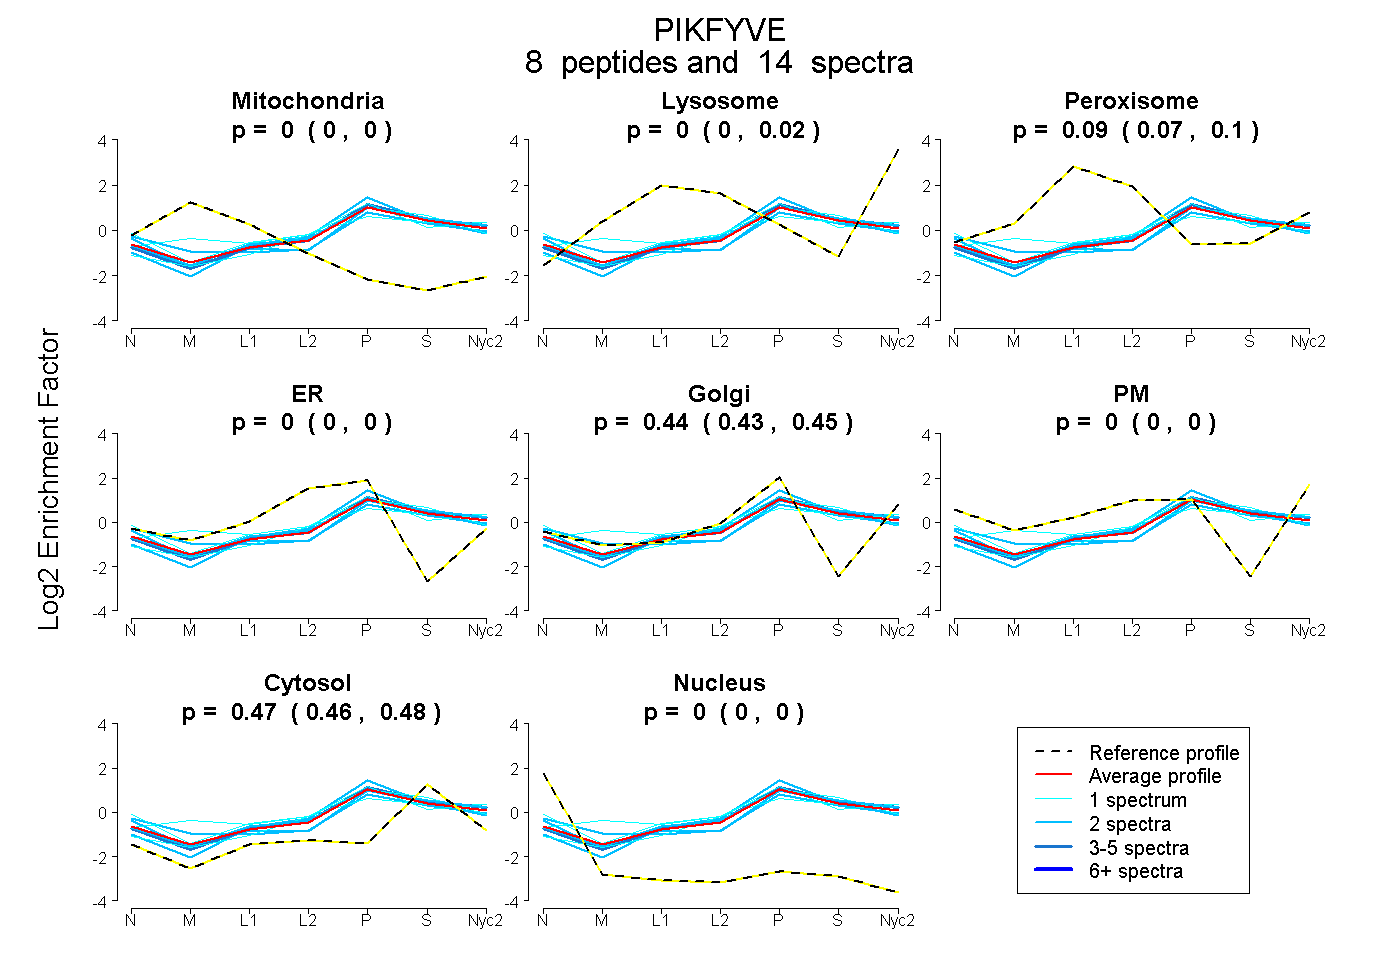
| Expt A |
8 peptides |
14 spectra |
|
0.000 0.000 | 0.000 |
0.002 0.000 | 0.015 |
0.088 0.072 | 0.097 |
0.000 0.000 | 0.000 |
0.442 0.431 | 0.448 |
0.000 0.000 | 0.000 |
0.468 0.460 | 0.476 |
0.000 0.000 | 0.000 |
| 2 spectra, ASGMLSFFR | 0.000 | 0.020 | 0.000 | 0.137 | 0.347 | 0.000 | 0.496 | 0.000 | ||
| 3 spectra, HLDPFVHSK | 0.000 | 0.065 | 0.021 | 0.000 | 0.426 | 0.000 | 0.487 | 0.000 | ||
| 2 spectra, ELVNWLIR | 0.000 | 0.000 | 0.056 | 0.000 | 0.440 | 0.024 | 0.480 | 0.000 | ||
| 2 spectra, EMEEGEFK | 0.000 | 0.000 | 0.030 | 0.000 | 0.452 | 0.000 | 0.517 | 0.000 | ||
| 1 spectrum, HQDDDMDIR | 0.000 | 0.050 | 0.000 | 0.125 | 0.272 | 0.000 | 0.552 | 0.000 | ||
| 2 spectra, RPTALAK | 0.000 | 0.052 | 0.074 | 0.000 | 0.393 | 0.000 | 0.481 | 0.000 | ||
| 1 spectrum, FYGHQYTR | 0.000 | 0.099 | 0.154 | 0.000 | 0.339 | 0.000 | 0.408 | 0.000 | ||
| 1 spectrum, MEDIFAQK | 0.000 | 0.000 | 0.108 | 0.000 | 0.435 | 0.082 | 0.375 | 0.000 |
| Plot | Mito | Lyso or Perox | ER | Golgi | PM | Cytosol | Nucleus | ||||||
| Expt B |
1 peptide |
1 spectrum |
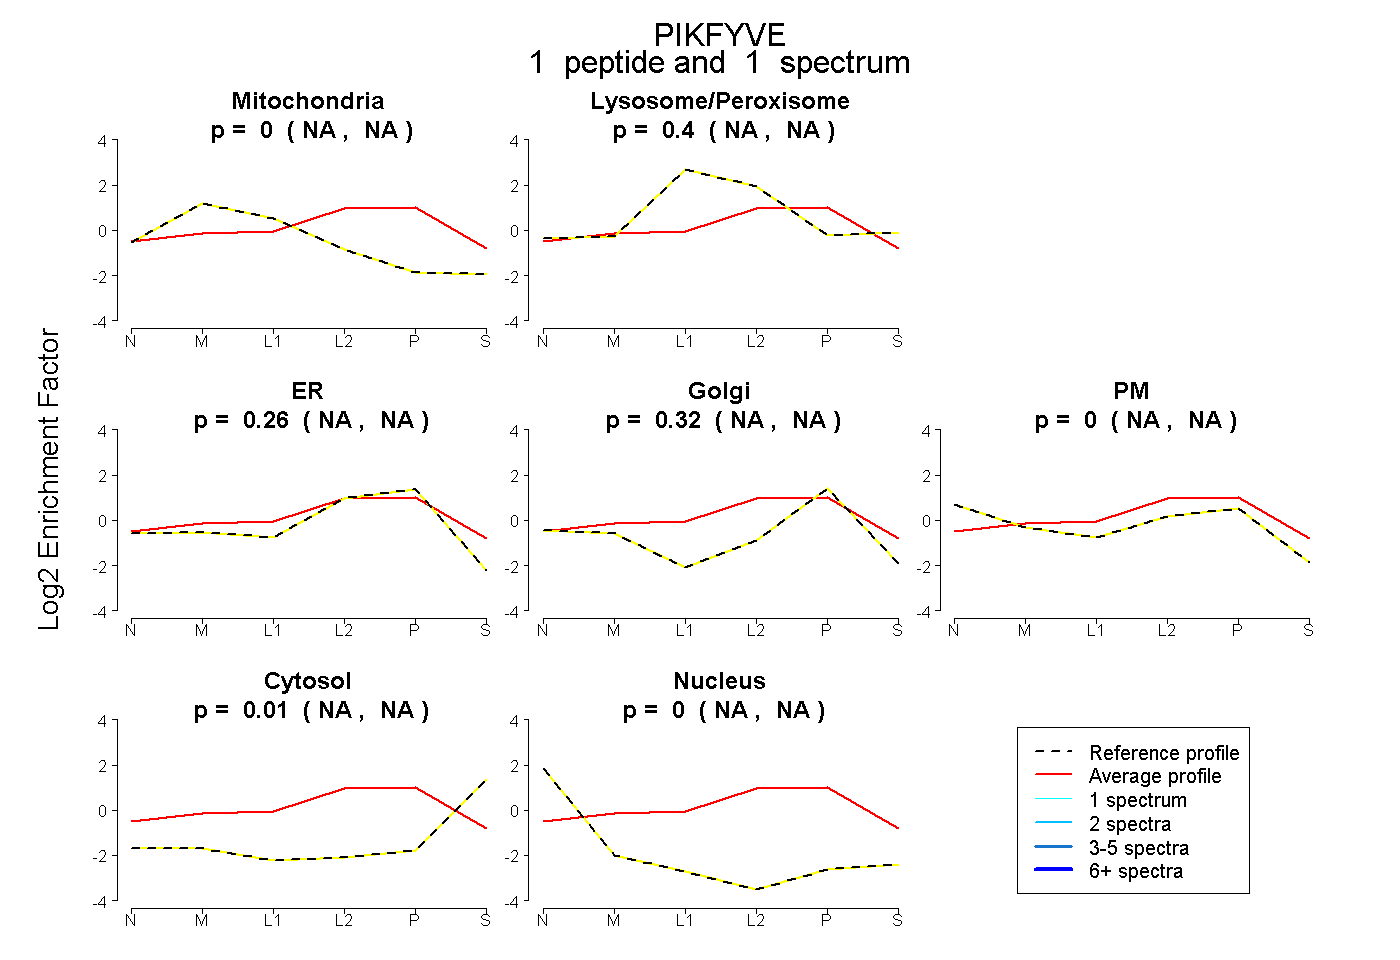 |
0.000 NA | NA |
0.401 NA | NA |
0.264 NA | NA |
0.322 NA | NA |
0.000 NA | NA |
0.013 NA | NA |
0.000 NA | NA |
|||
| Plot | Lyso | Other | |||||||||||
| Expt C |
7 peptides |
14 spectra |
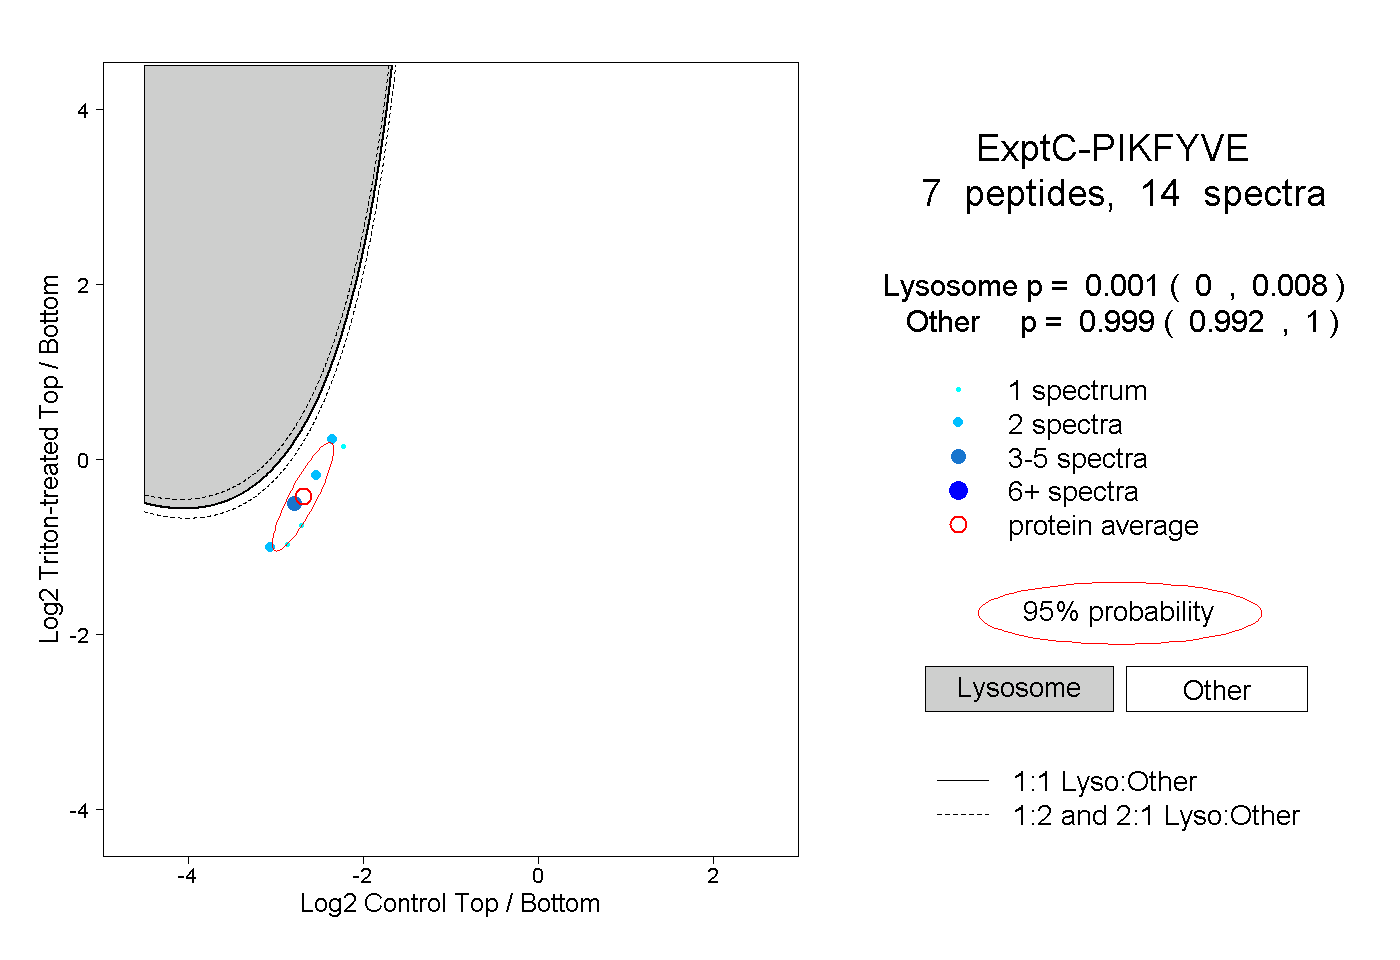 |
0.001 0.000 | 0.008 |
0.999 0.992 | 1.000 |