PIKFYVE
[ENSRNOP00000020447]
Main page
| | | Plot |
Mito |
Lyso |
|
Perox |
ER |
Golgi |
PM |
Cytosol |
Nucleus |
|
| Expt A |
 8
8
peptides |
14
spectra |
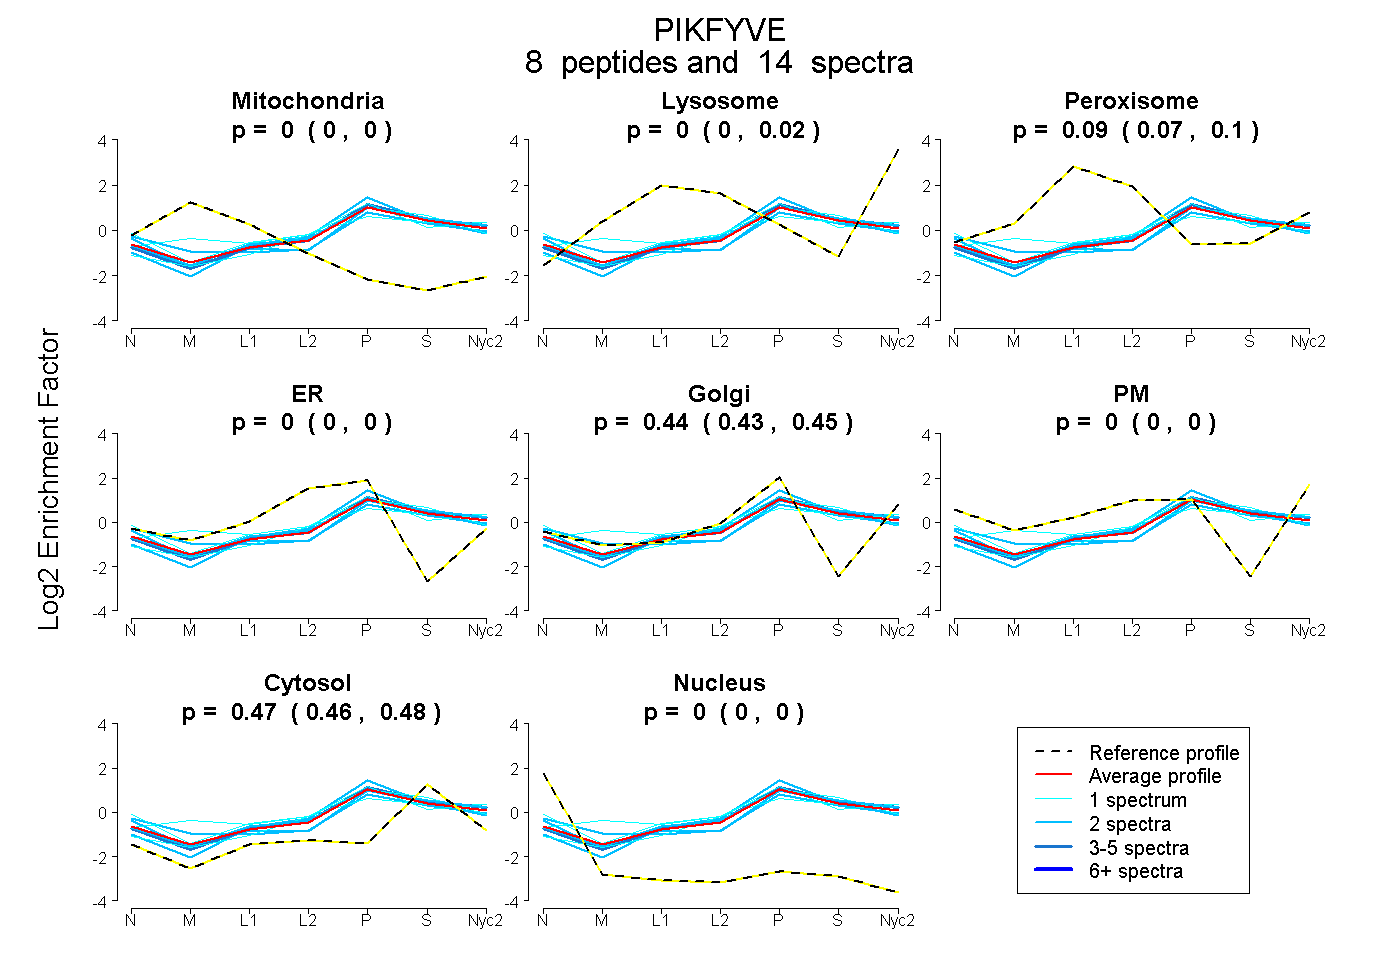 |
0.000
0.000 | 0.000 |
0.002
0.000 | 0.015 |
|
0.088
0.072 | 0.097 |
0.000
0.000 | 0.000 |
0.442
0.431 | 0.448 |
0.000
0.000 | 0.000 |
0.468
0.460 | 0.476 |
0.000
0.000 | 0.000 |
|
| | | Plot |
Mito |
|
Lyso or Perox |
|
ER |
Golgi |
PM |
Cytosol |
Nucleus |
|
| Expt B |
1
peptide |
1
spectrum |
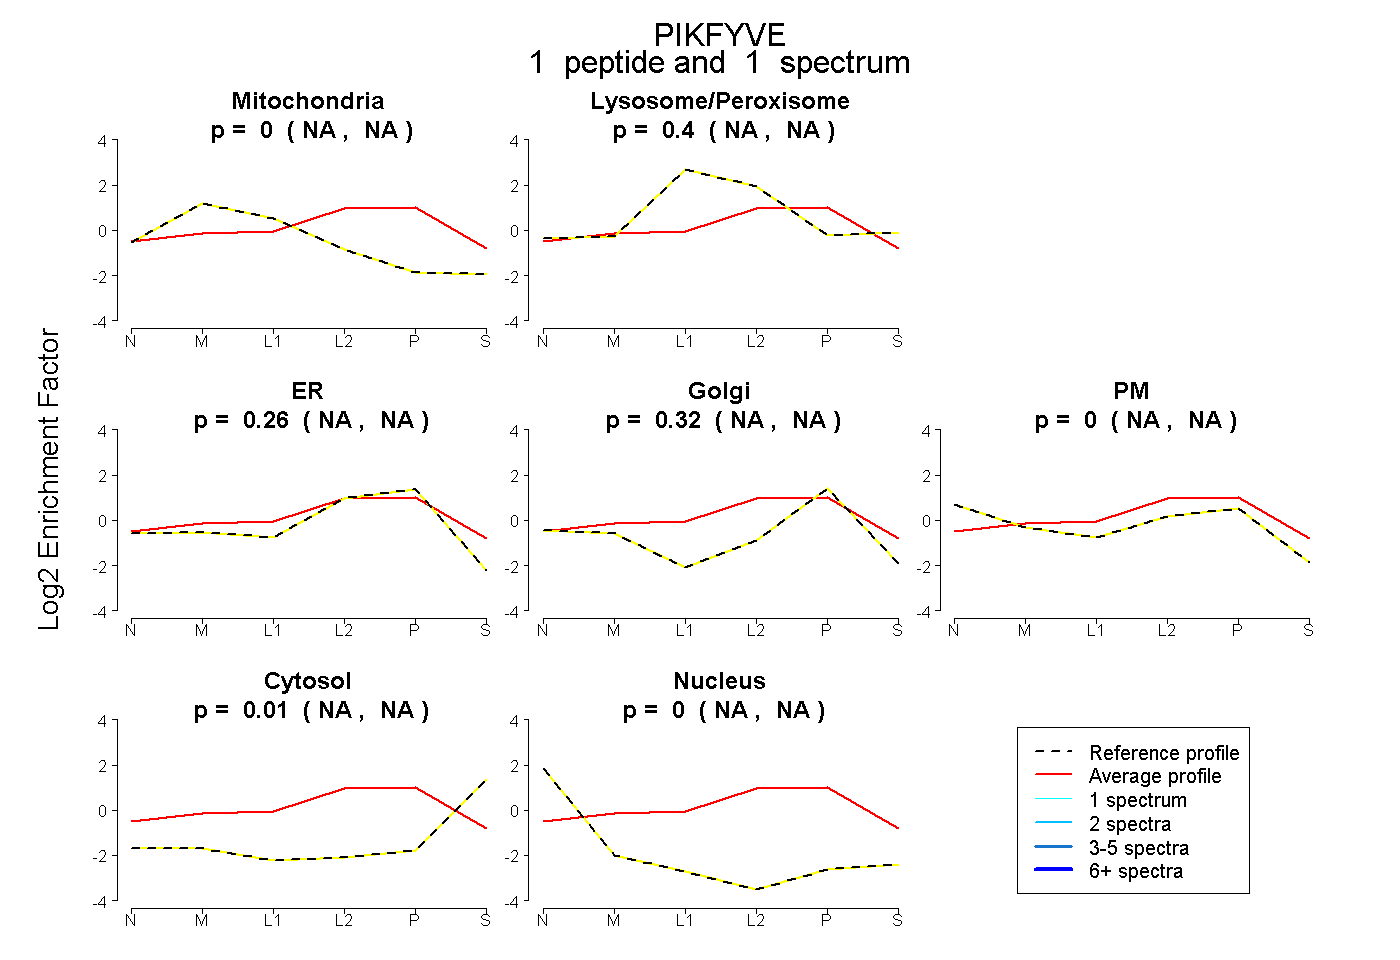 |
0.000
NA | NA |
|
0.401
NA | NA |
|
0.264
NA | NA |
0.322
NA | NA |
0.000
NA | NA |
0.013
NA | NA |
0.000
NA | NA |
|
| | | Plot |
|
Lyso |
|
|
|
|
|
|
|
Other |
| Expt C |
7
peptides |
14
spectra |
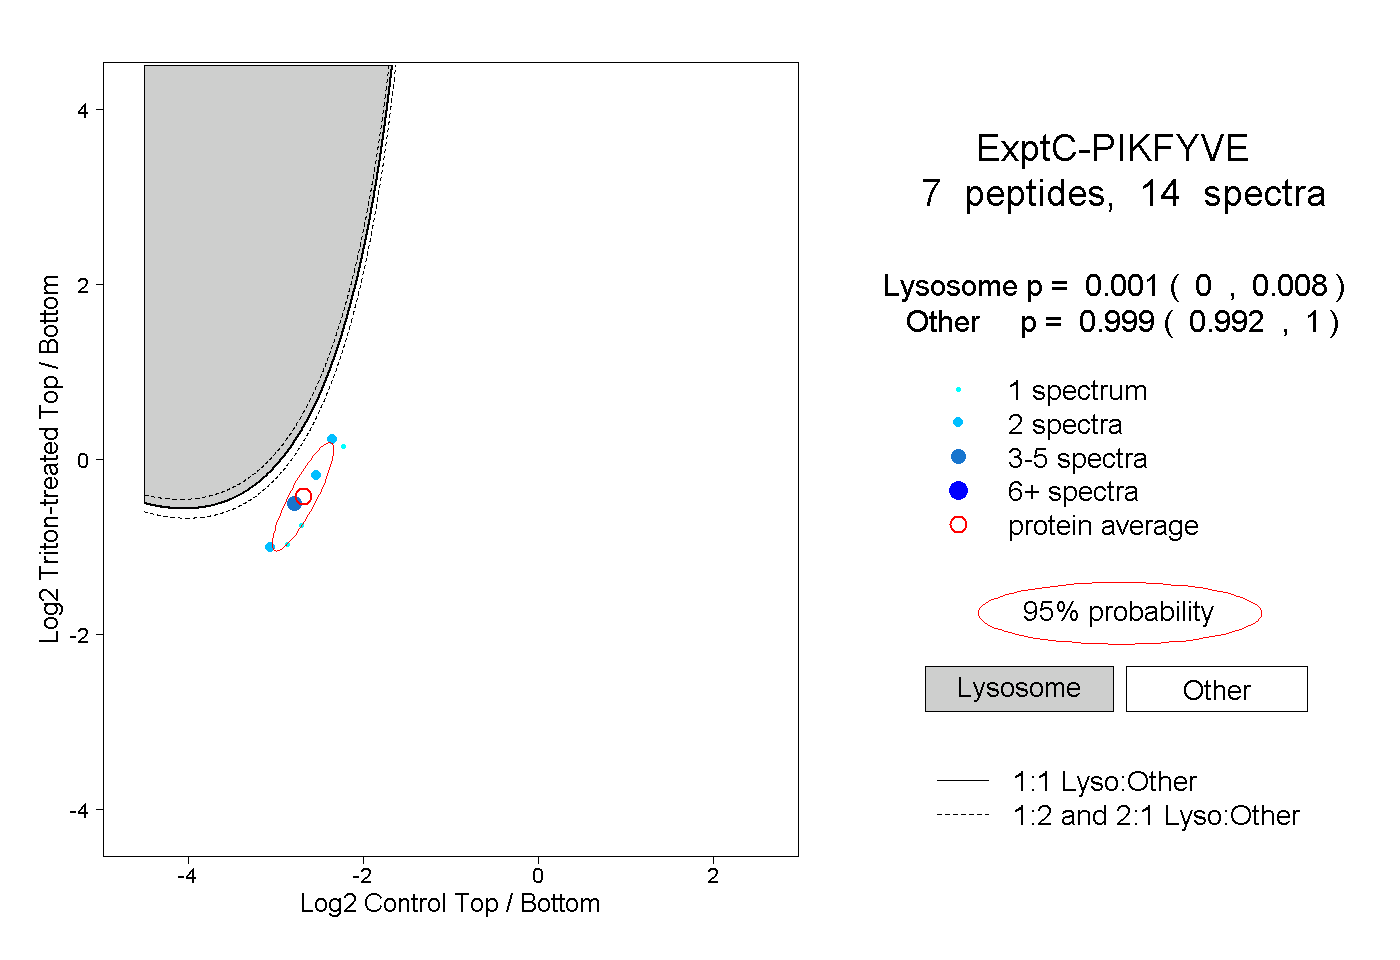 |
|
0.001
0.000 | 0.008 |
|
|
|
|
|
|
|
0.999
0.992 | 1.000 |
| 2 spectra, NSQNNTEK |
|
0.002 |
|
|
|
|
|
|
|
0.998 |
| 2 spectra, ILGVYR |
|
0.000 |
|
|
|
|
|
|
|
1.000 |
| 2 spectra, LVSVQEDAGK |
|
0.001 |
|
|
|
|
|
|
|
0.999 |
| 5 spectra, IVDVRPTLVLVEK |
|
0.002 |
|
|
|
|
|
|
|
0.998 |
| 1 spectrum, DTSCTSGSK |
|
0.000 |
|
|
|
|
|
|
|
1.000 |
| 1 spectrum, VSLLQDLK |
|
0.000 |
|
|
|
|
|
|
|
1.000 |
| 1 spectrum, SQDSDLK |
|
0.000 |
|
|
|
|
|
|
|
1.000 |