 5
5peptides
spectra
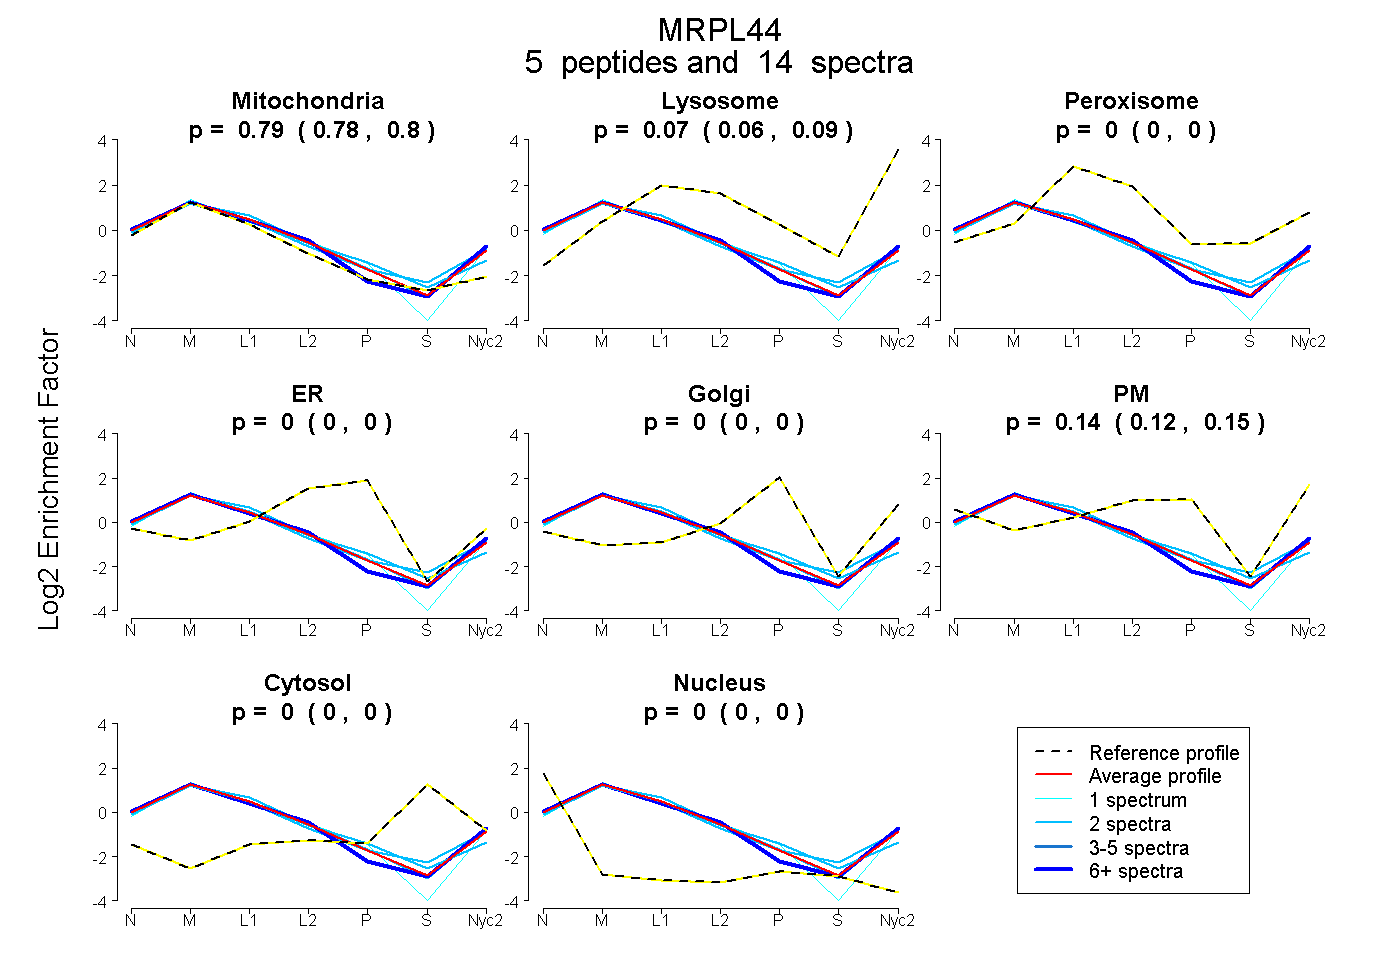
0.778 | 0.799
0.061 | 0.085
0.000 | 0.000
0.000 | 0.000
0.000 | 0.000
0.117 | 0.151
0.000 | 0.000
0.000 | 0.000
2peptides
spectra
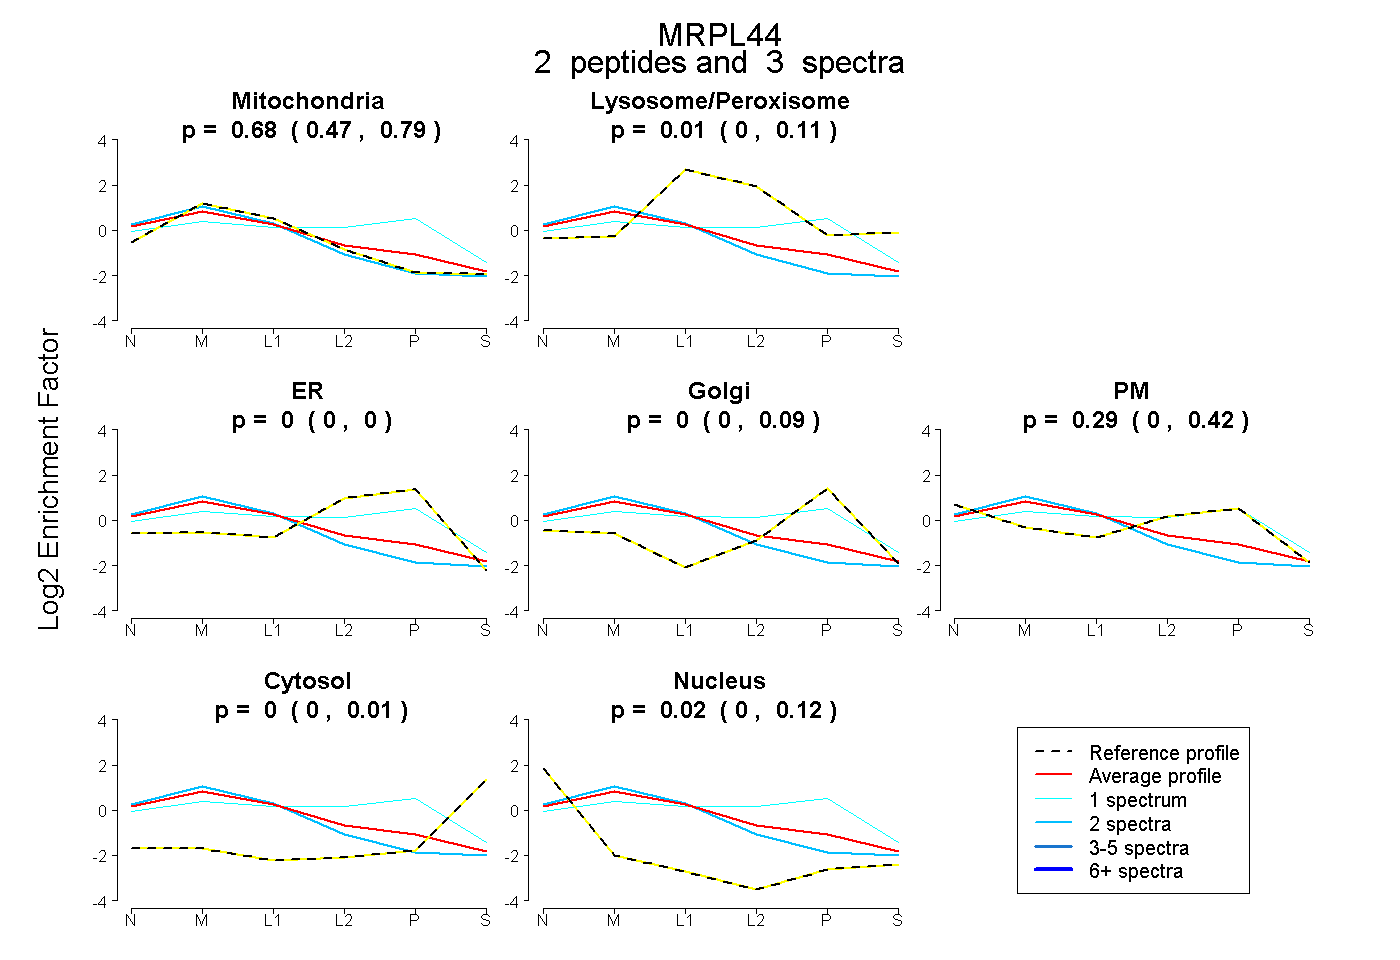
0.473 | 0.790
0.000 | 0.115
0.000 | 0.000
0.000 | 0.085
0.000 | 0.416
0.000 | 0.010
0.000 | 0.123
10peptides
spectra
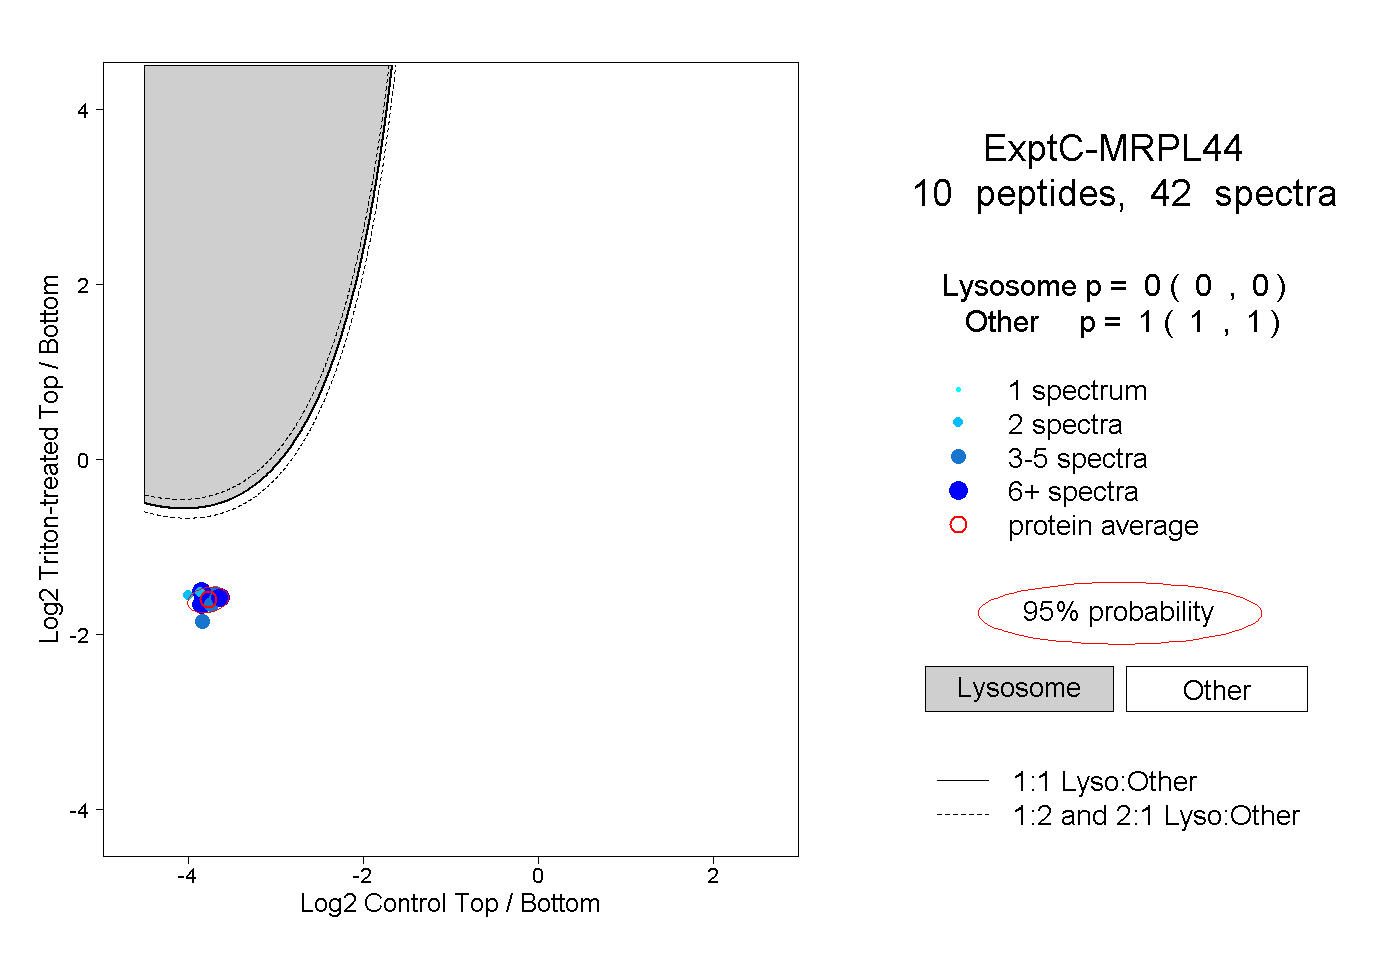
0.000 | 0.000
1.000 | 1.000
6peptides
spectra
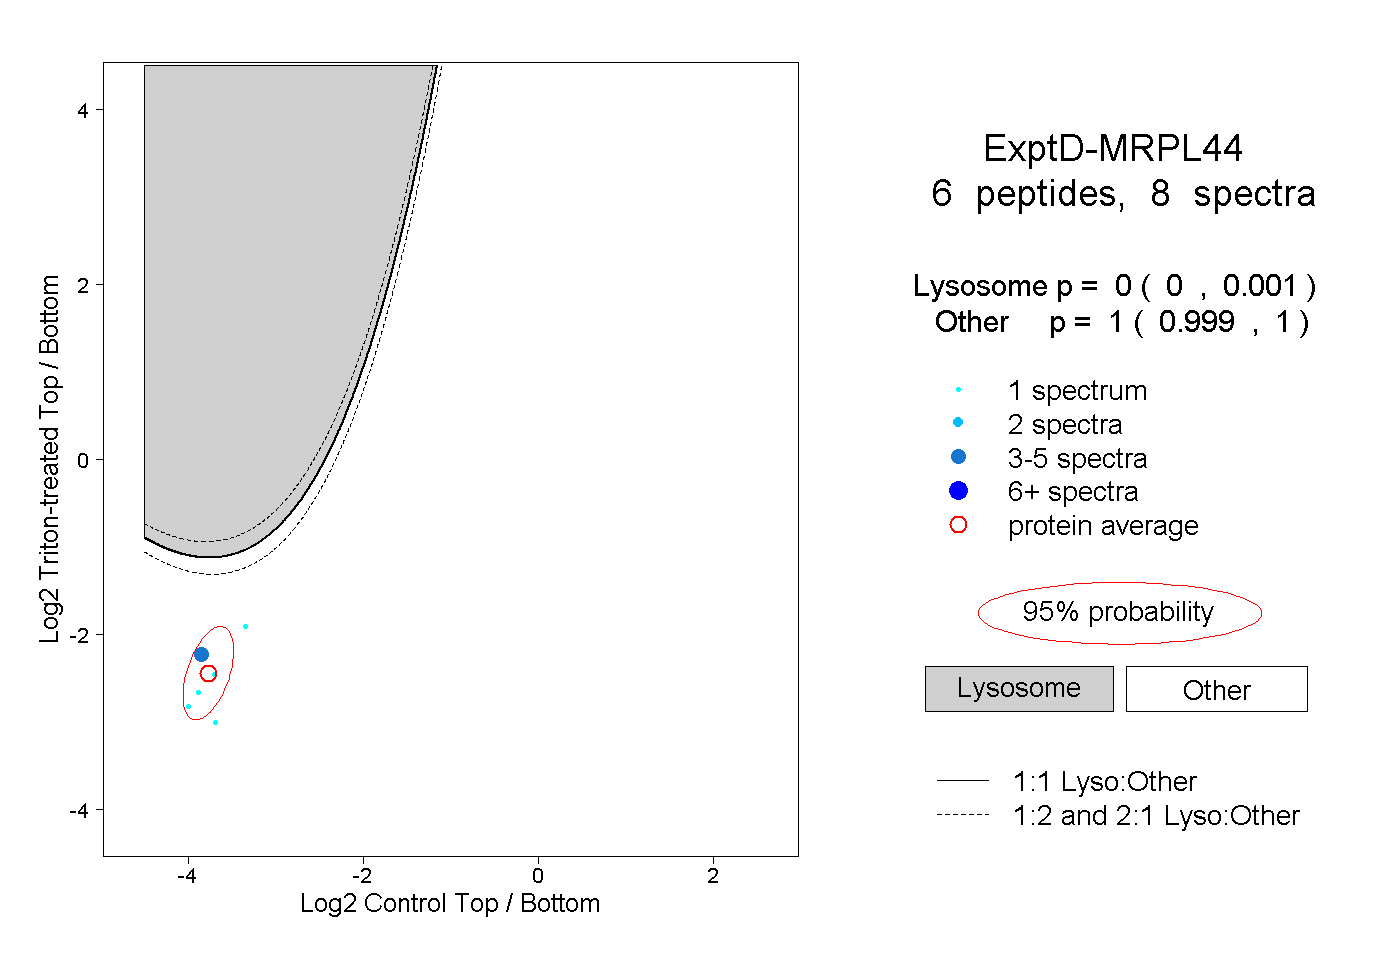
0.000 | 0.001
0.999 | 1.000