 5
5peptides
spectra
0.778 | 0.799
0.061 | 0.085
0.000 | 0.000
0.000 | 0.000
0.000 | 0.000
0.117 | 0.151
0.000 | 0.000
0.000 | 0.000
| Plot | Mito | Lyso | Perox | ER | Golgi | PM | Cytosol | Nucleus | |||||
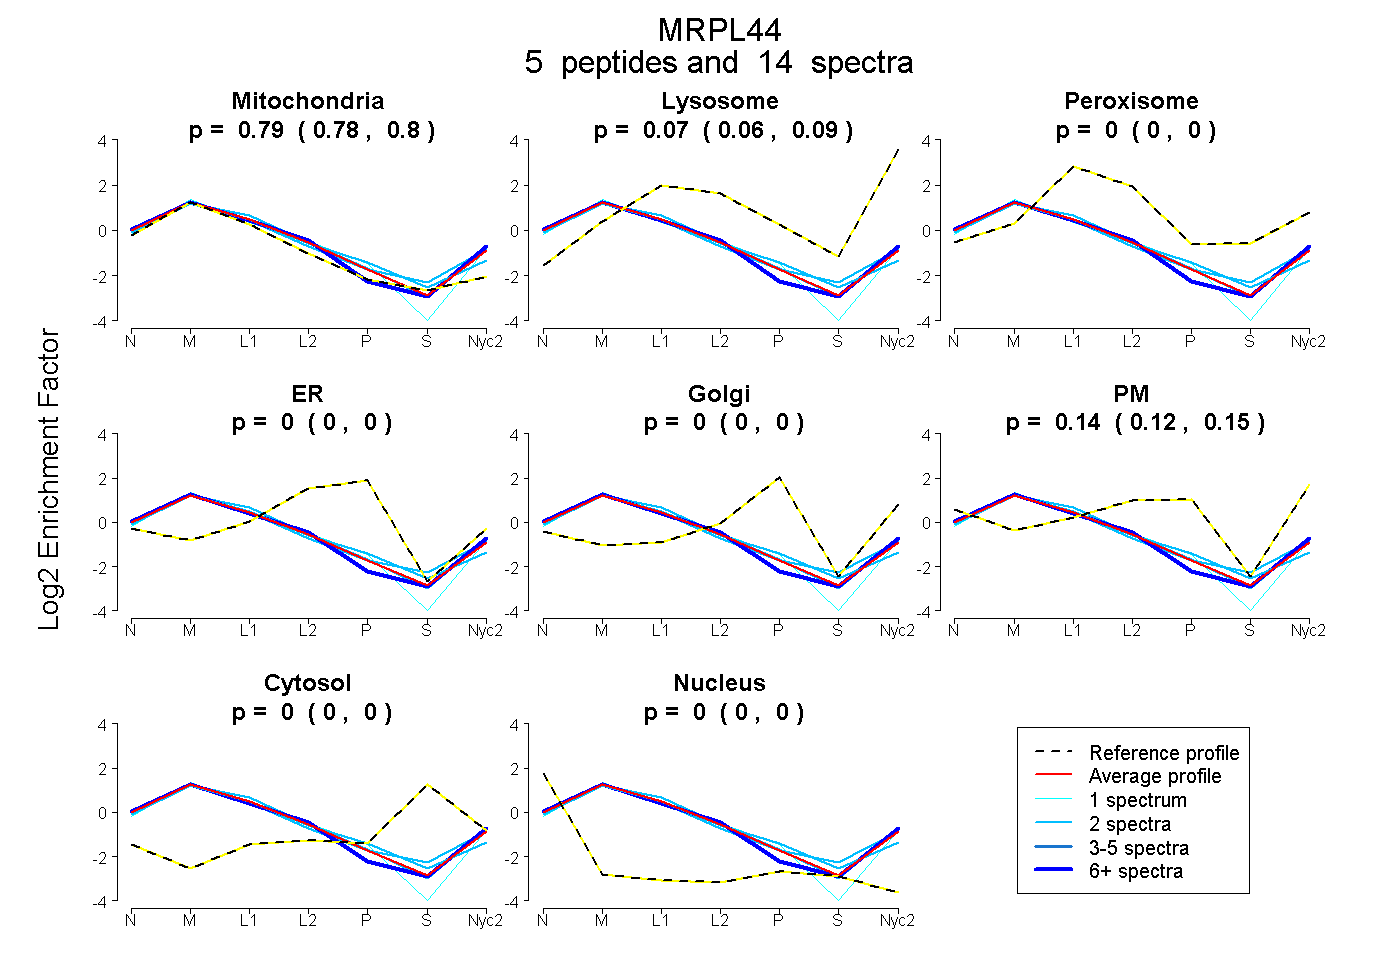
| Expt A |
5 peptides |
14 spectra |
|
0.790 0.778 | 0.799 |
0.075 0.061 | 0.085 |
0.000 0.000 | 0.000 |
0.000 0.000 | 0.000 |
0.000 0.000 | 0.000 |
0.135 0.117 | 0.151 |
0.000 0.000 | 0.000 |
0.000 0.000 | 0.000 |
| 2 spectra, SPPPPVR | 0.791 | 0.000 | 0.051 | 0.007 | 0.000 | 0.151 | 0.000 | 0.000 | ||
| 2 spectra, AALFIR | 0.763 | 0.081 | 0.000 | 0.000 | 0.000 | 0.156 | 0.000 | 0.000 | ||
| 7 spectra, NISAPESR | 0.820 | 0.113 | 0.000 | 0.000 | 0.000 | 0.067 | 0.000 | 0.000 | ||
| 2 spectra, LQEAFSLDLLK | 0.794 | 0.134 | 0.000 | 0.000 | 0.000 | 0.068 | 0.000 | 0.003 | ||
| 1 spectrum, EAALLNLK | 0.763 | 0.000 | 0.000 | 0.000 | 0.000 | 0.237 | 0.000 | 0.000 |
| Plot | Mito | Lyso or Perox | ER | Golgi | PM | Cytosol | Nucleus | ||||||
| Expt B |
2 peptides |
3 spectra |
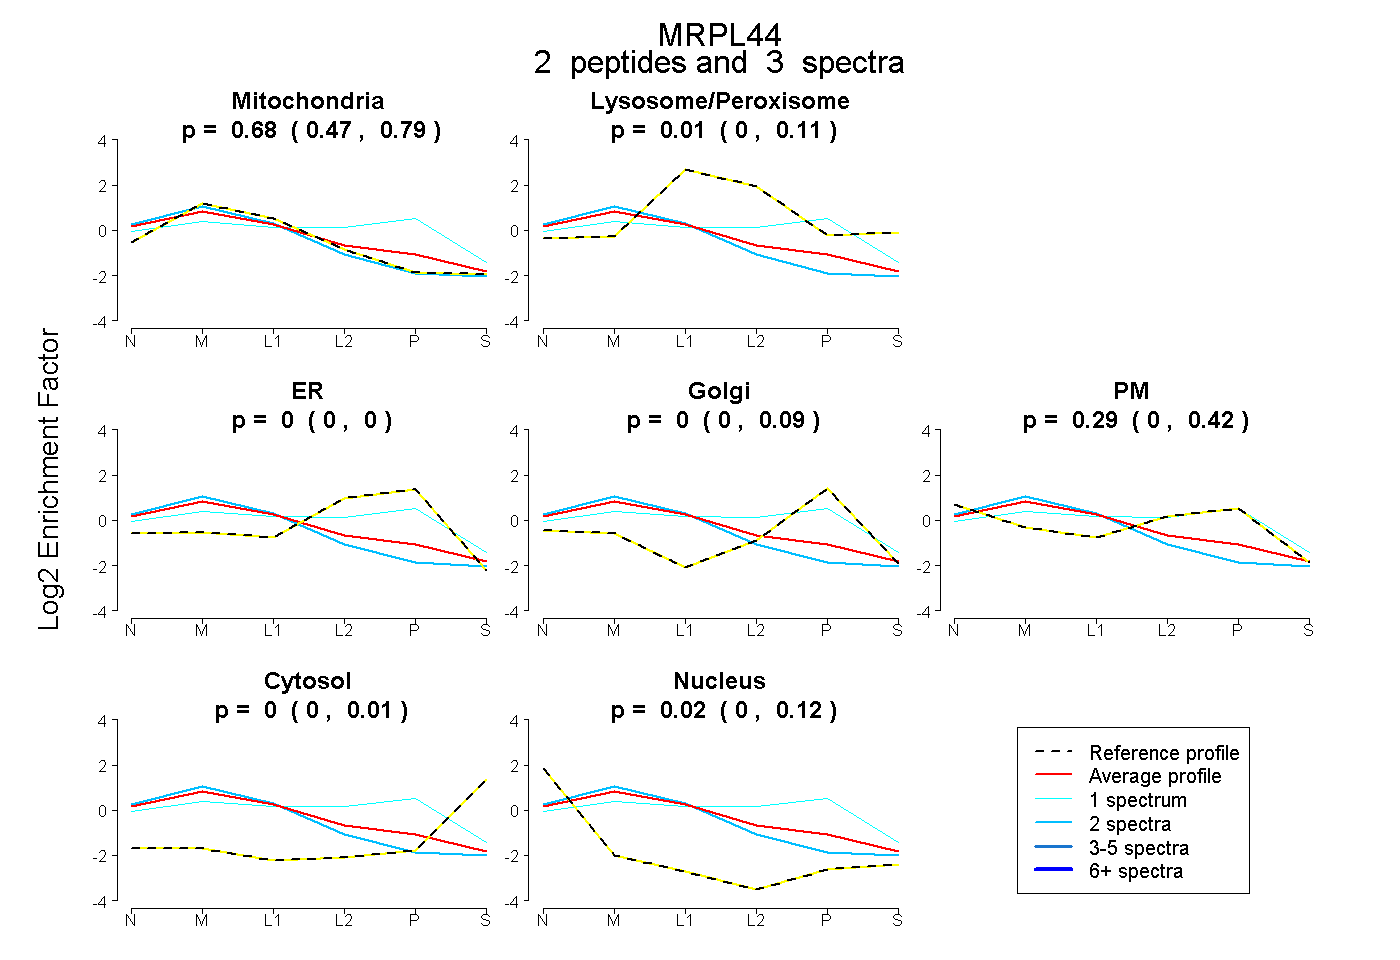 |
0.676 0.473 | 0.790 |
0.014 0.000 | 0.115 |
0.000 0.000 | 0.000 |
0.000 0.000 | 0.085 |
0.295 0.000 | 0.416 |
0.000 0.000 | 0.010 |
0.015 0.000 | 0.123 |
|||
| Plot | Lyso | Other | |||||||||||
| Expt C |
10 peptides |
42 spectra |
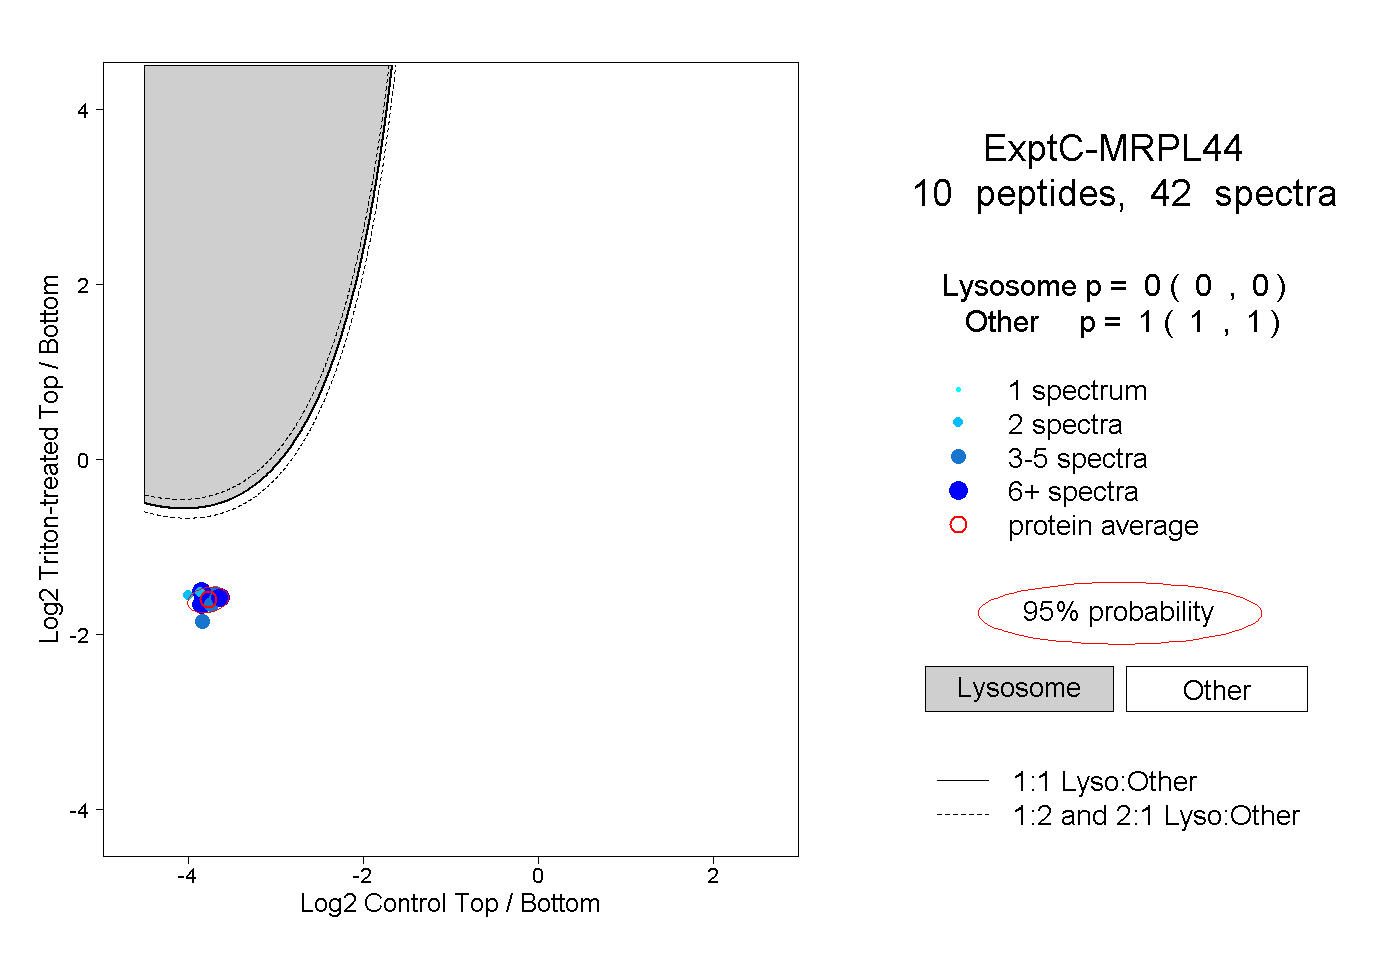 |
0.000 0.000 | 0.000 |
1.000 1.000 | 1.000 |
||||||||
| Plot | Lyso | Other | |||||||||||
| Expt D |
6 peptides |
8 spectra |
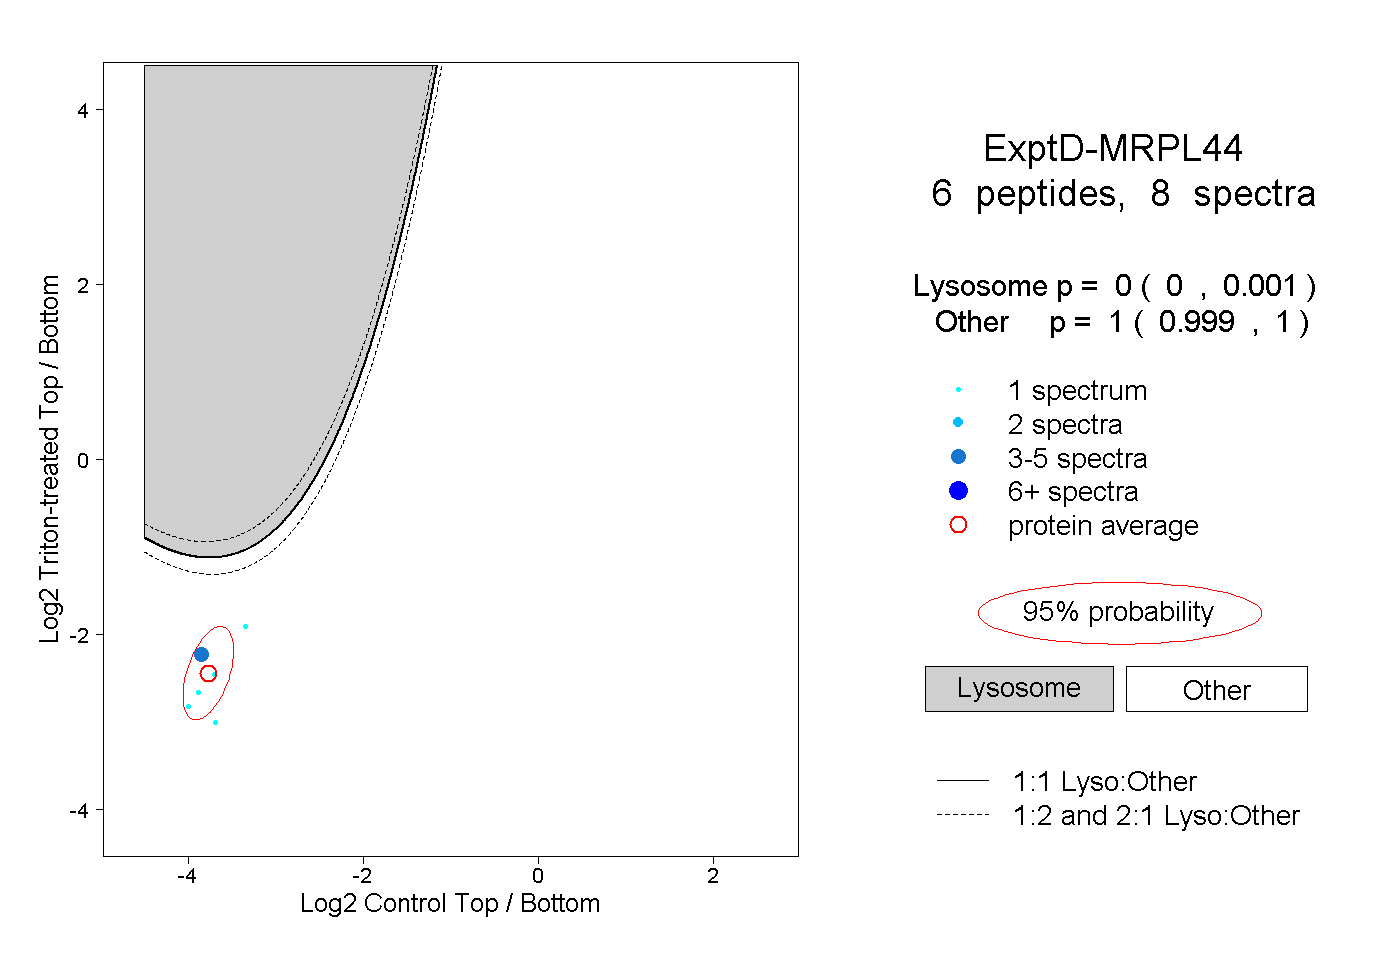 |
0.000 0.000 | 0.001 |
1.000 0.999 | 1.000 |