MRPL44
[ENSRNOP00000020420]
Main page
| | | Plot |
Mito |
Lyso |
|
Perox |
ER |
Golgi |
PM |
Cytosol |
Nucleus |
|
| Expt A |
 5
5
peptides |
14
spectra |
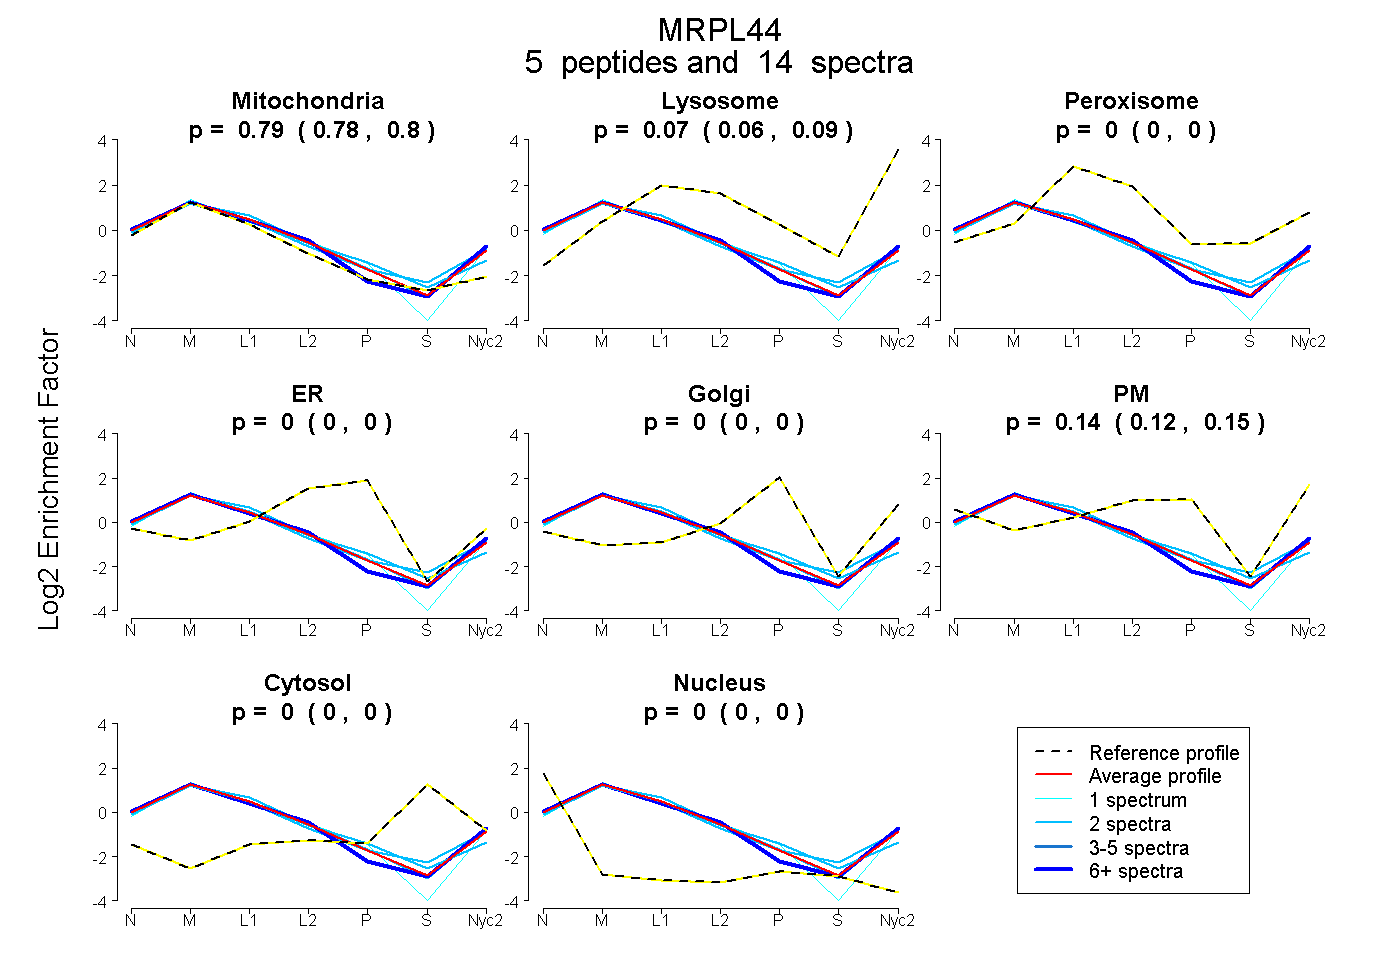 |
0.790
0.778 | 0.799 |
0.075
0.061 | 0.085 |
|
0.000
0.000 | 0.000 |
0.000
0.000 | 0.000 |
0.000
0.000 | 0.000 |
0.135
0.117 | 0.151 |
0.000
0.000 | 0.000 |
0.000
0.000 | 0.000 |
|
| | | Plot |
Mito |
|
Lyso or Perox |
|
ER |
Golgi |
PM |
Cytosol |
Nucleus |
|
| Expt B |
2
peptides |
3
spectra |
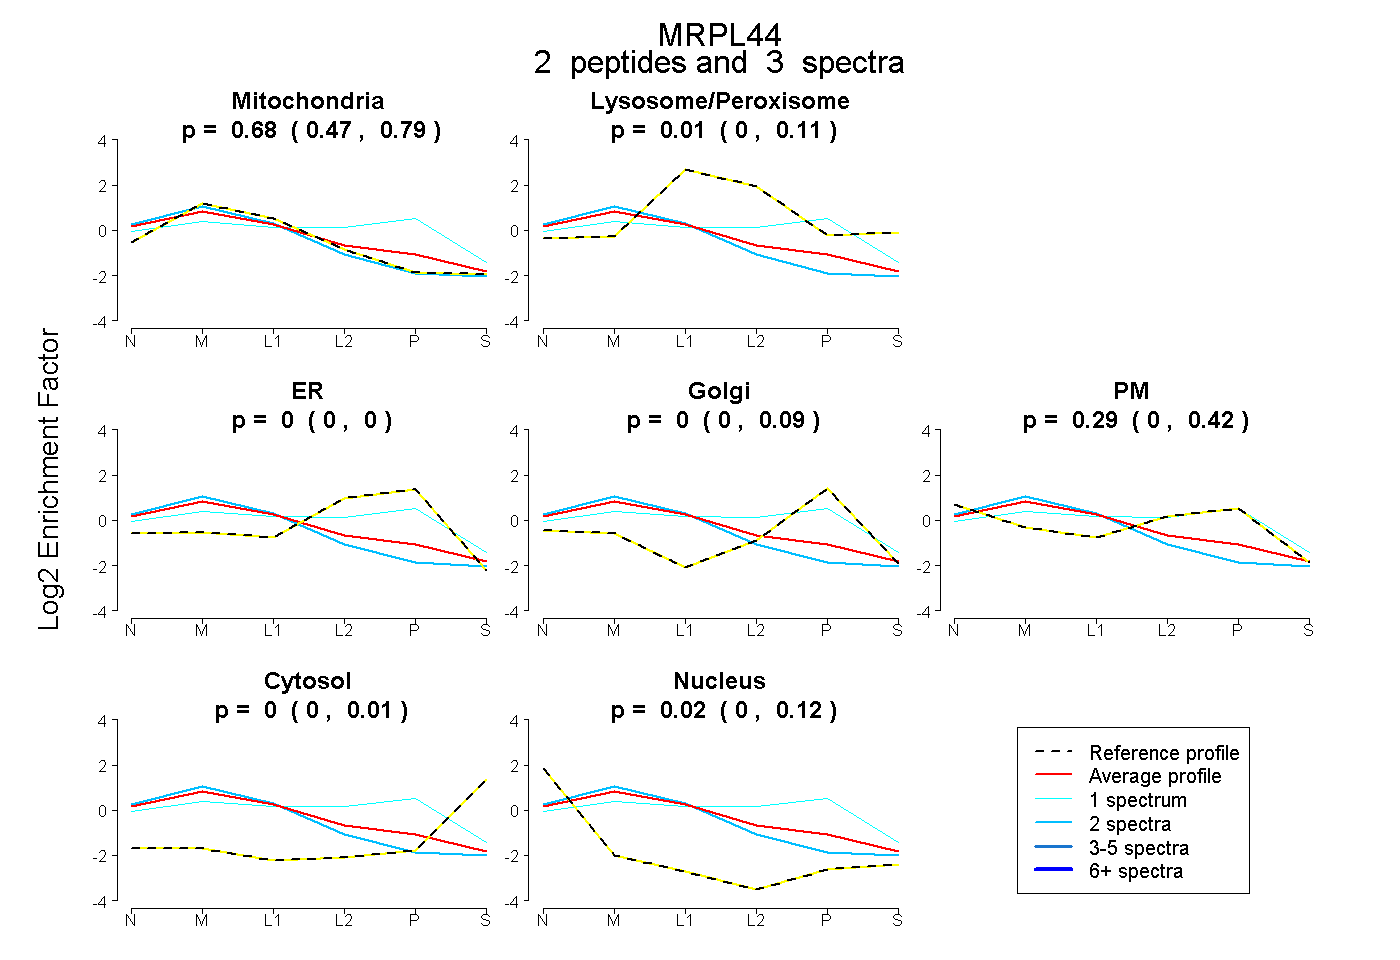 |
0.676
0.473 | 0.790 |
|
0.014
0.000 | 0.115 |
|
0.000
0.000 | 0.000 |
0.000
0.000 | 0.085 |
0.295
0.000 | 0.416 |
0.000
0.000 | 0.010 |
0.015
0.000 | 0.123 |
|
| | | Plot |
|
Lyso |
|
|
|
|
|
|
|
Other |
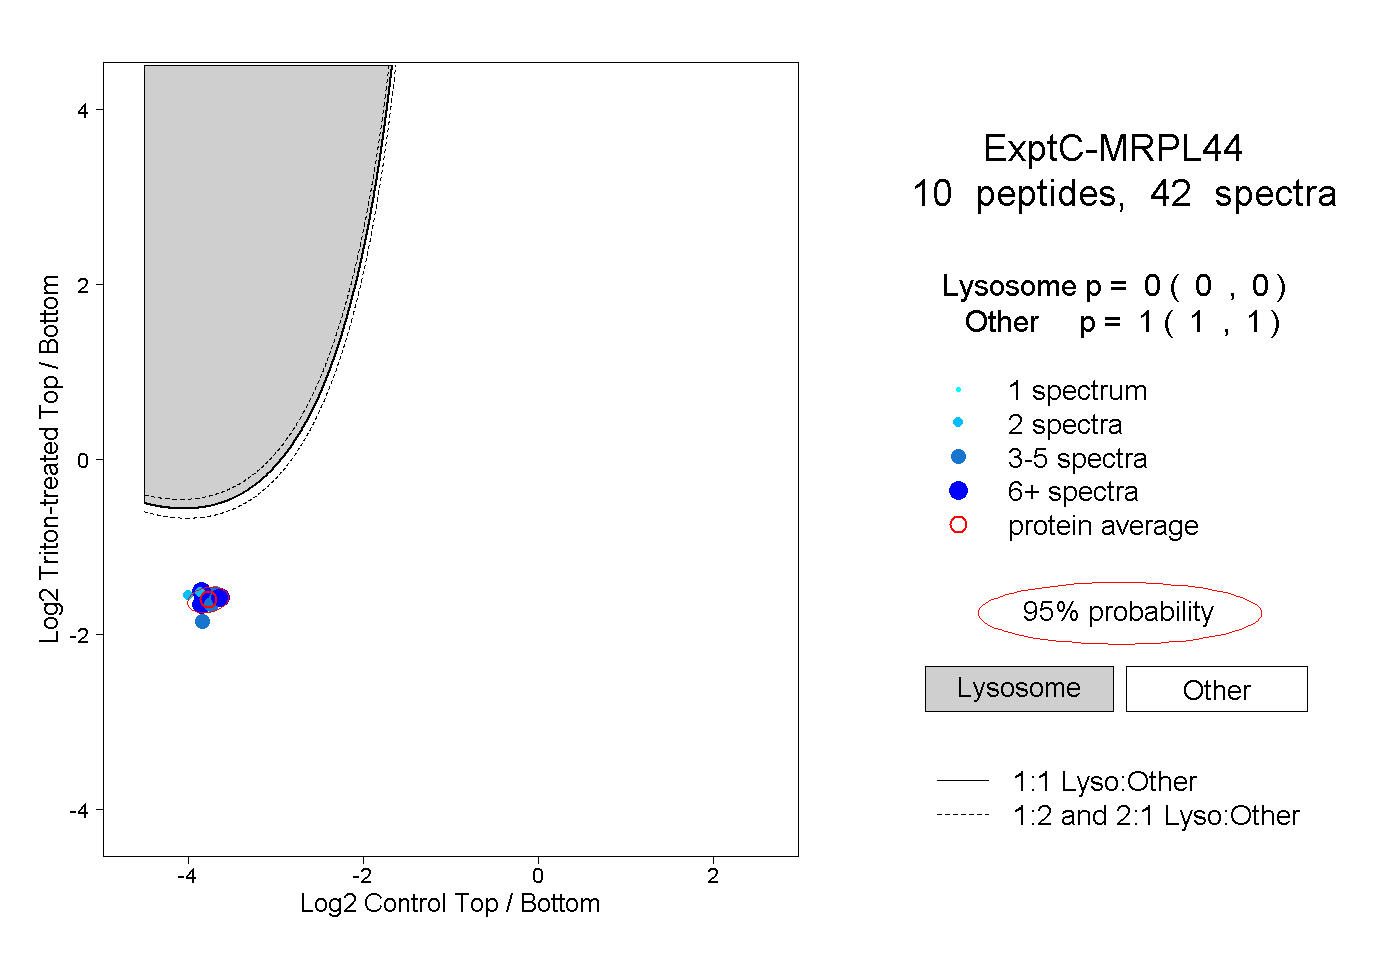
| Expt C |
10
peptides |
42
spectra |
 |
|
0.000
0.000 | 0.000 |
|
|
|
|
|
|
|
1.000
1.000 | 1.000 |
| 7 spectra, AALFIR |
|
0.000 |
|
|
|
|
|
|
|
1.000 |
| 3 spectra, NISAPESR |
|
0.000 |
|
|
|
|
|
|
|
1.000 |
| 2 spectra, EAALLNLK |
|
0.000 |
|
|
|
|
|
|
|
1.000 |
| 2 spectra, TAFVNSCYIK |
|
0.000 |
|
|
|
|
|
|
|
1.000 |
| 10 spectra, SPPPPVR |
|
0.000 |
|
|
|
|
|
|
|
1.000 |
| 2 spectra, DFLITQMTGK |
|
0.000 |
|
|
|
|
|
|
|
1.000 |
| 3 spectra, LQEAFSLDLLK |
|
0.000 |
|
|
|
|
|
|
|
1.000 |
| 6 spectra, LYGFTENR |
|
0.000 |
|
|
|
|
|
|
|
1.000 |
| 5 spectra, QNLGIEK |
|
0.000 |
|
|
|
|
|
|
|
1.000 |
| 2 spectra, RPWDYSKPK |
|
0.000 |
|
|
|
|
|
|
|
1.000 |
| | | Plot |
|
Lyso |
|
|
|
|
|
|
|
Other |
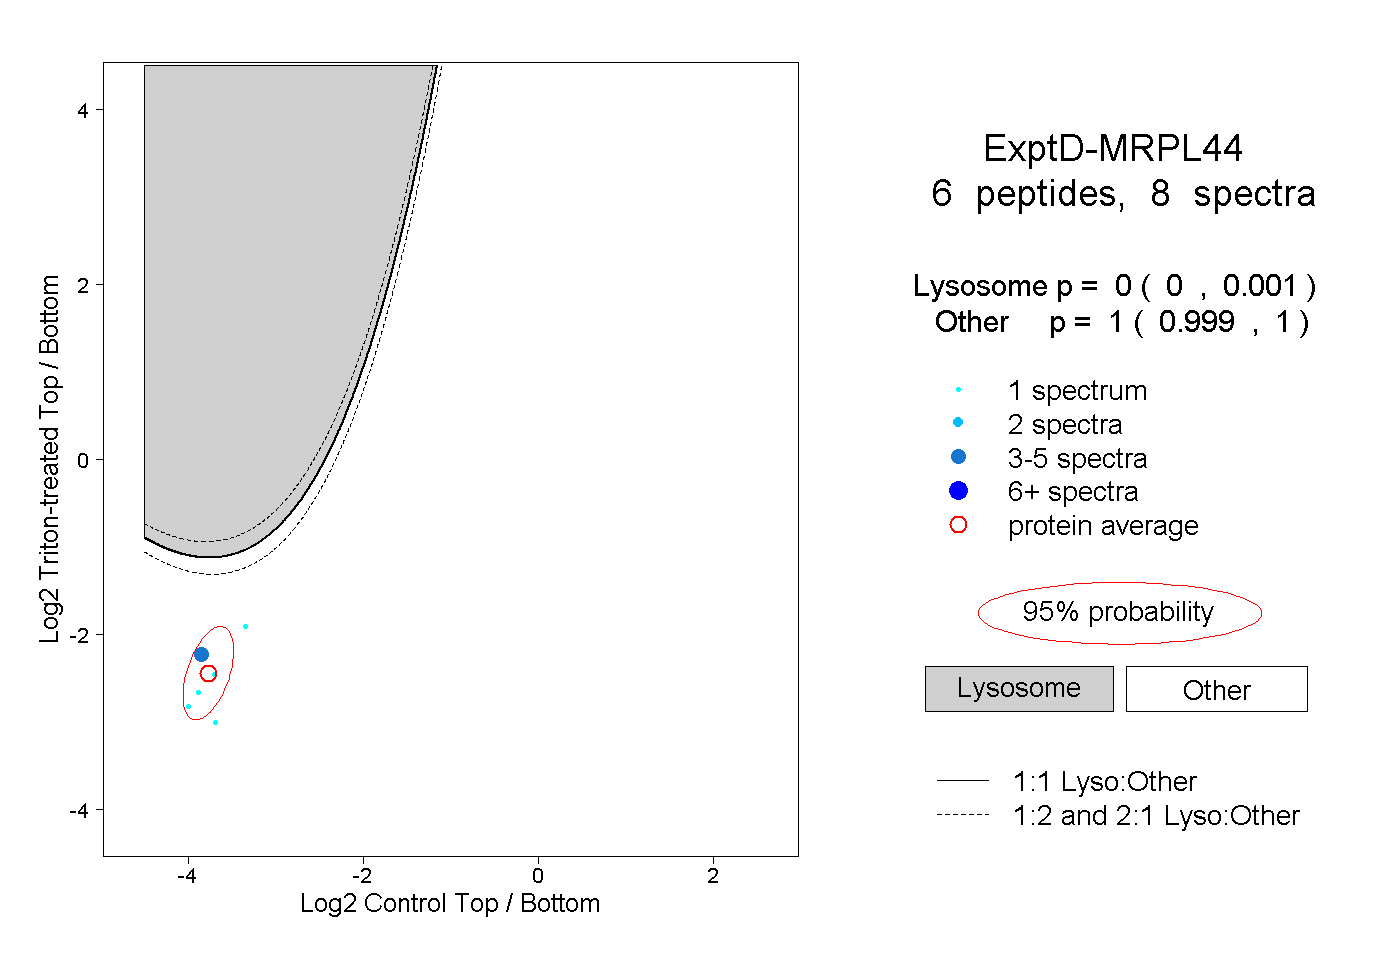
| Expt D |
6
peptides |
8
spectra |
 |
|
0.000
0.000 | 0.001 |
|
|
|
|
|
|
|
1.000
0.999 | 1.000 |