 20
20peptides
spectra
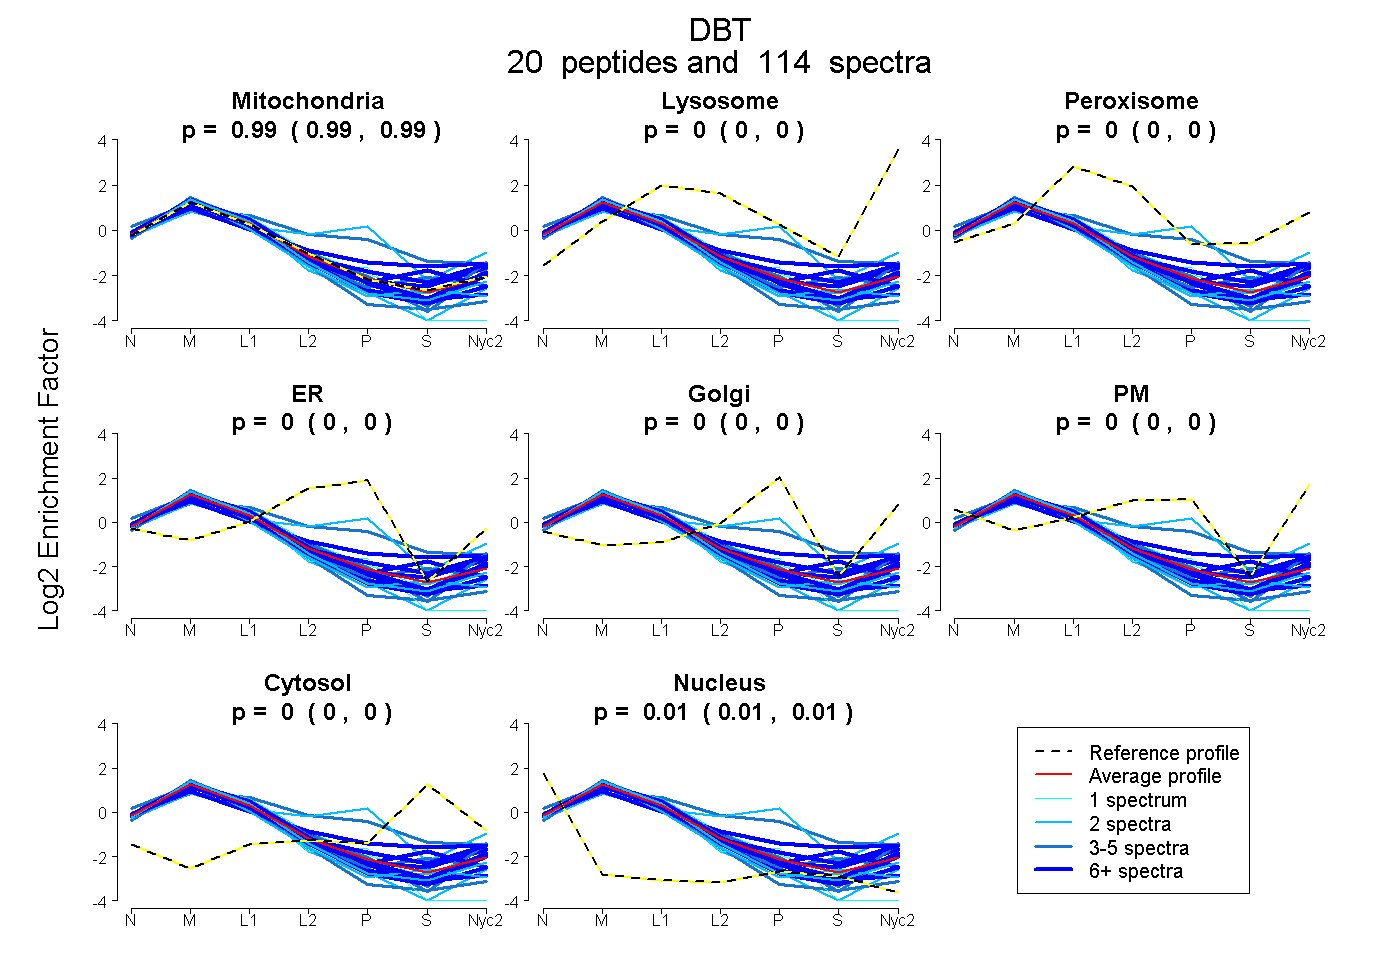
0.988 | 0.992
0.000 | 0.000
0.000 | 0.000
0.000 | 0.000
0.000 | 0.000
0.000 | 0.000
0.000 | 0.000
0.008 | 0.011
17peptides
spectra
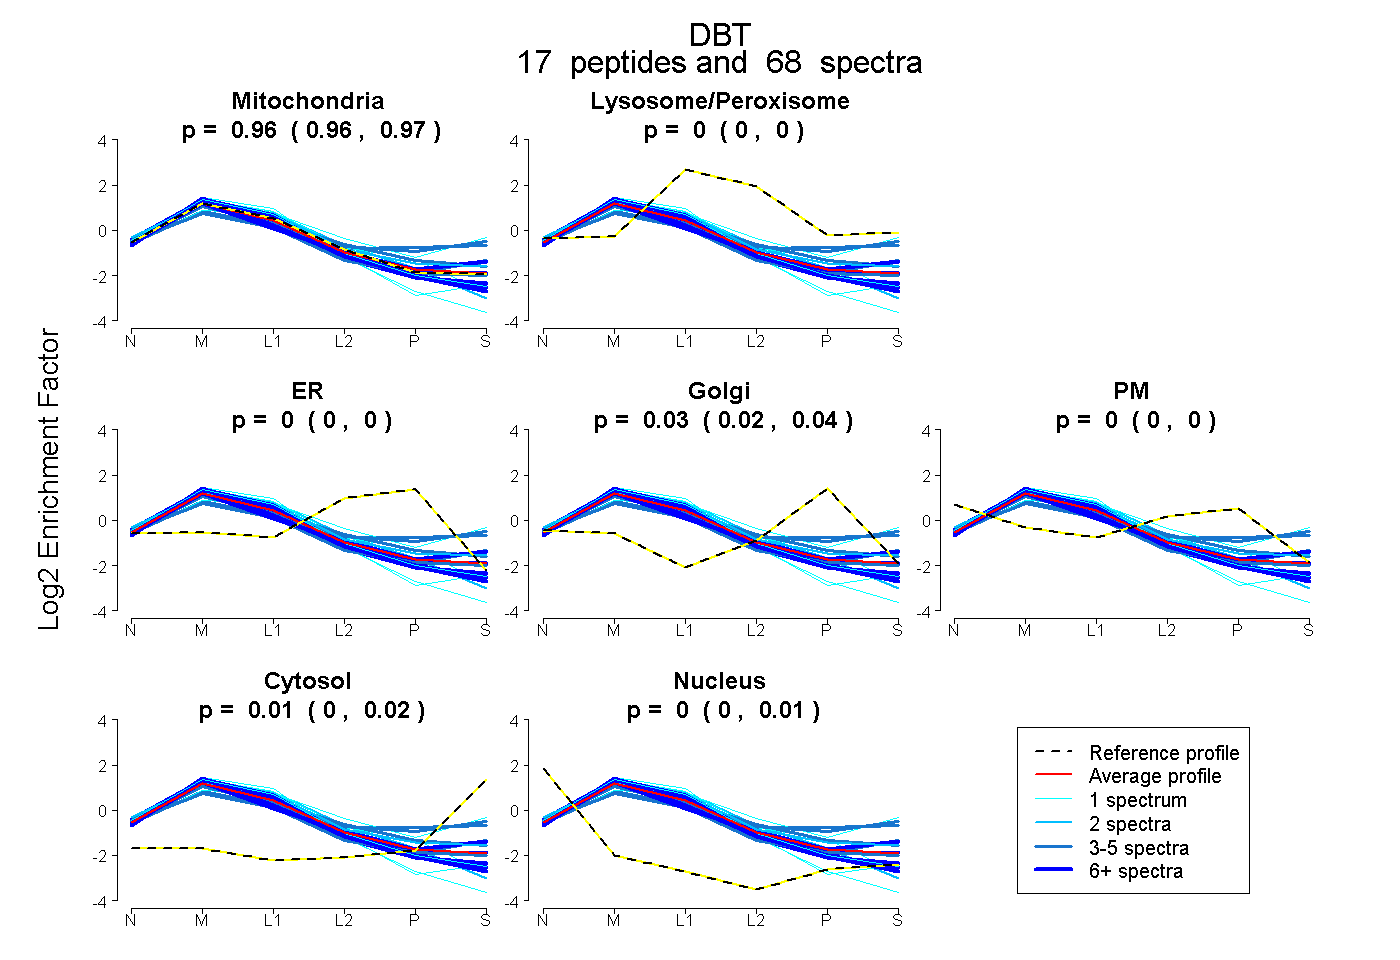
0.956 | 0.965
0.000 | 0.000
0.000 | 0.000
0.022 | 0.035
0.000 | 0.000
0.000 | 0.015
0.000 | 0.005
22peptides
spectra
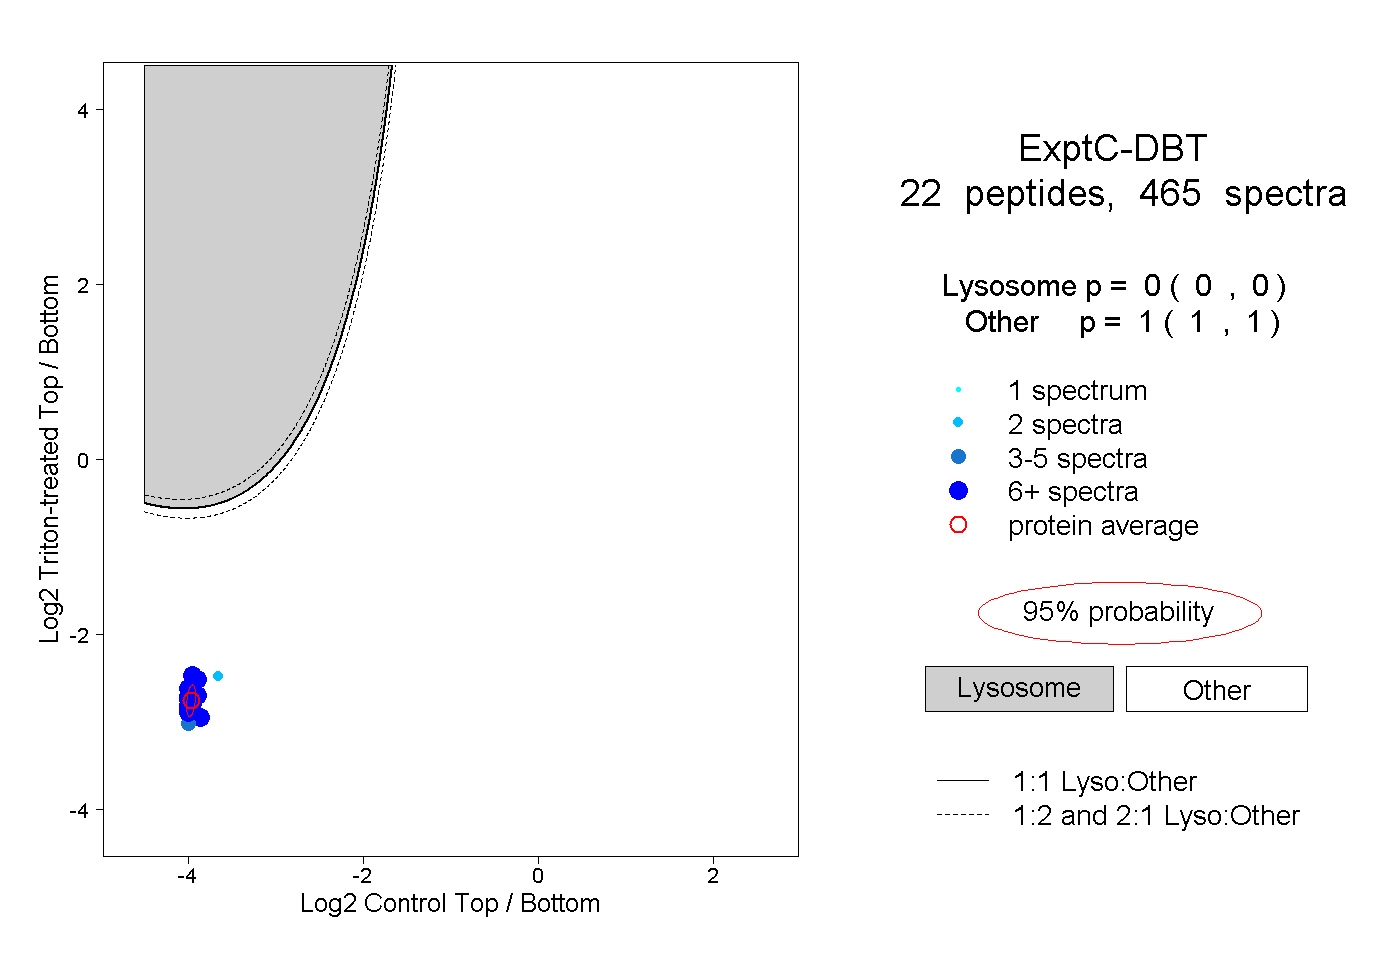
0.000 | 0.000
1.000 | 1.000
11peptides
spectra
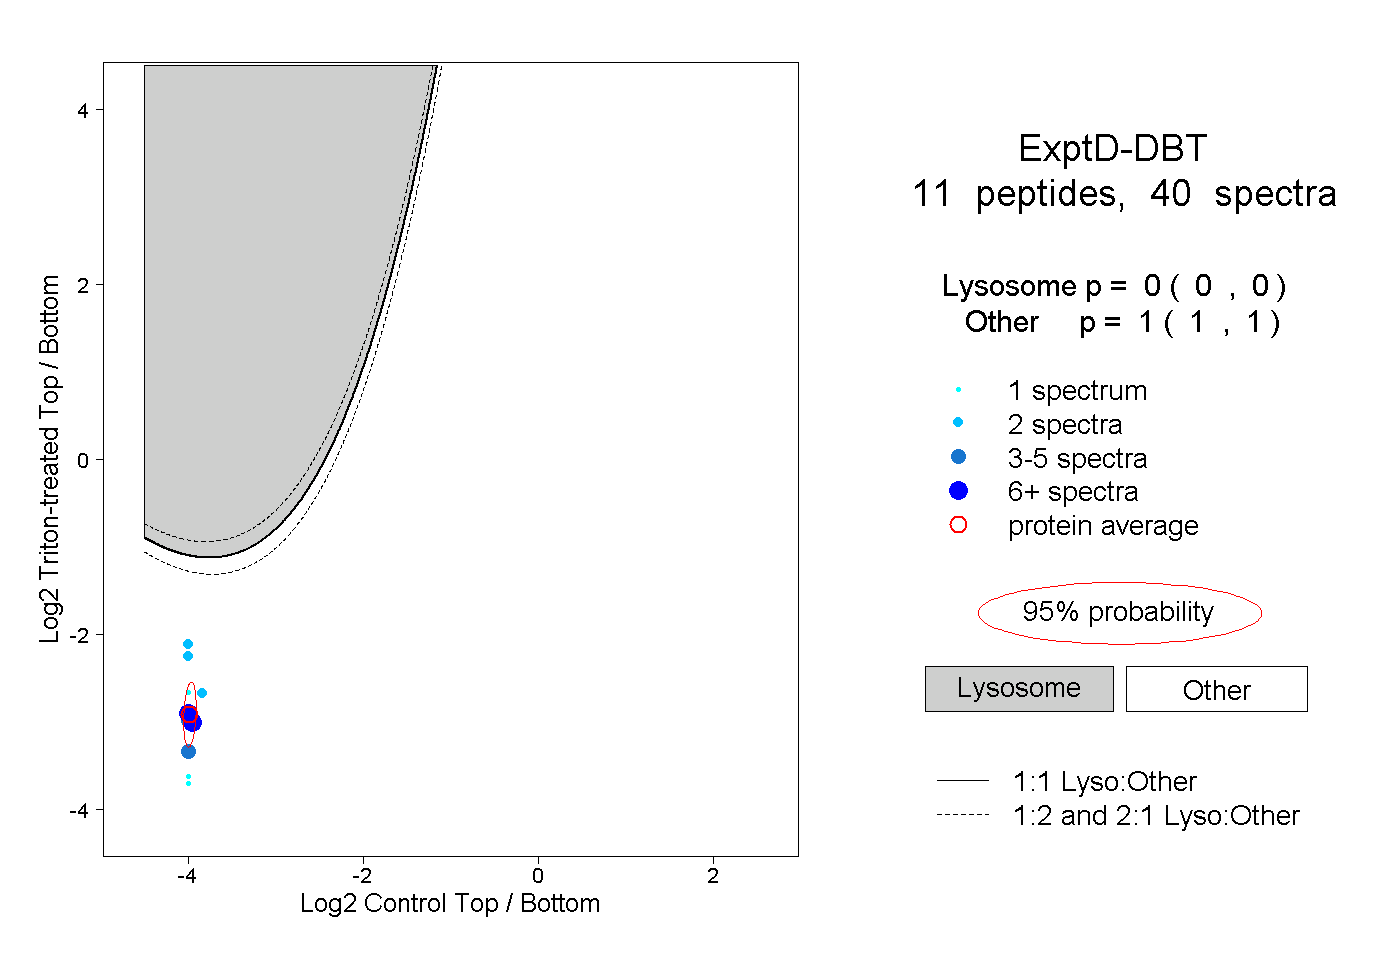
0.000 | 0.000
1.000 | 1.000