 20
20peptides
spectra
0.988 | 0.992
0.000 | 0.000
0.000 | 0.000
0.000 | 0.000
0.000 | 0.000
0.000 | 0.000
0.000 | 0.000
0.008 | 0.011
| Plot | Mito | Lyso | Perox | ER | Golgi | PM | Cytosol | Nucleus | |||||
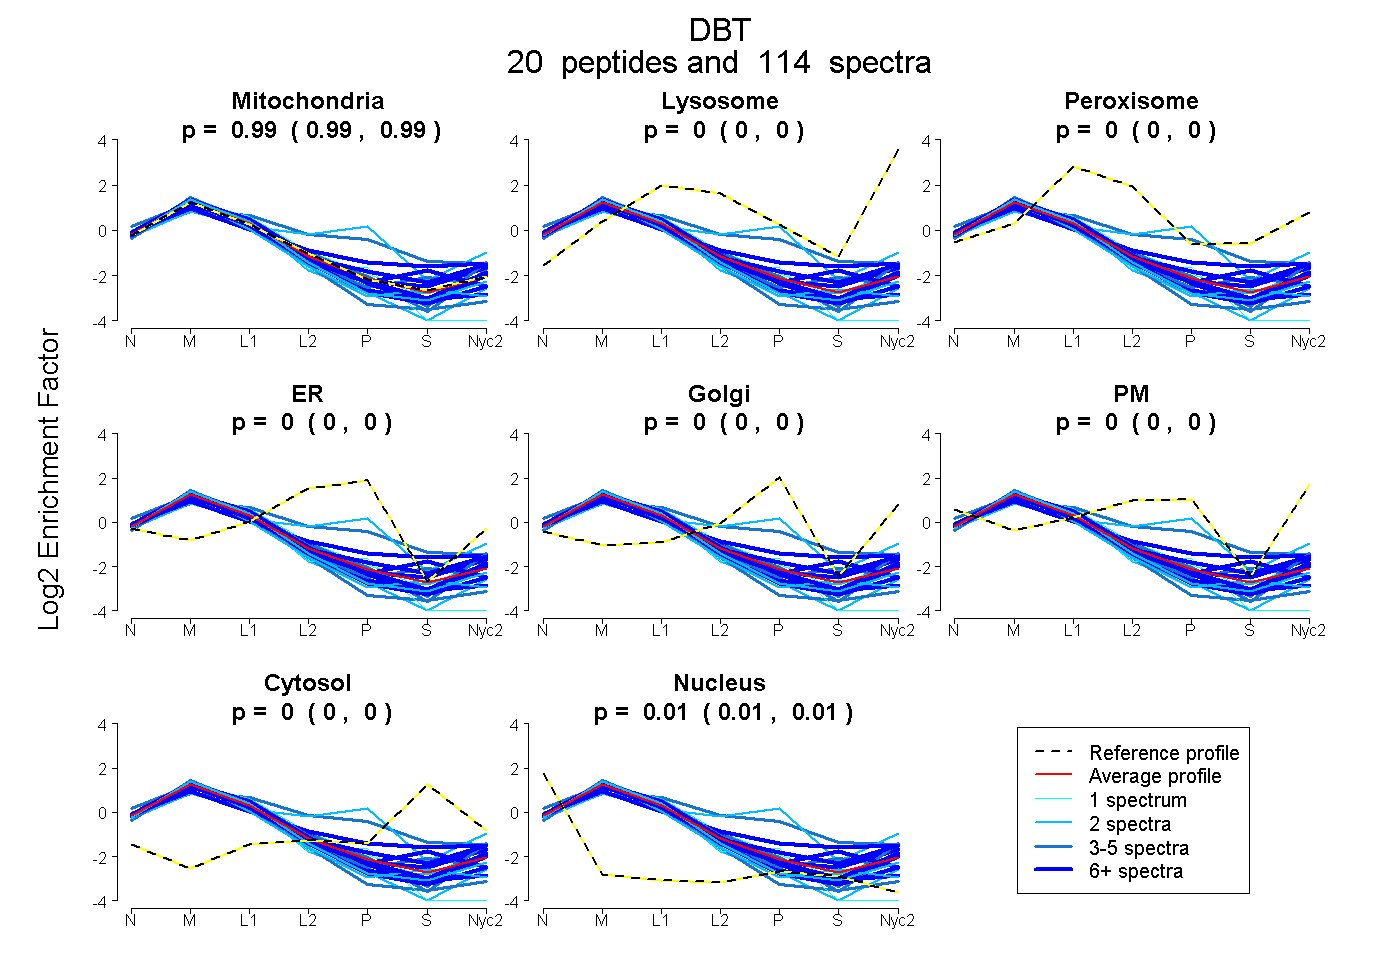
| Expt A |
20 peptides |
114 spectra |
|
0.990 0.988 | 0.992 |
0.000 0.000 | 0.000 |
0.000 0.000 | 0.000 |
0.000 0.000 | 0.000 |
0.000 0.000 | 0.000 |
0.000 0.000 | 0.000 |
0.000 0.000 | 0.000 |
0.010 0.008 | 0.011 |
| 7 spectra, IPHFGYCDEVDLTELVK | 0.953 | 0.000 | 0.000 | 0.000 | 0.000 | 0.000 | 0.000 | 0.047 | ||
| 11 spectra, SEITPPPPQPR | 1.000 | 0.000 | 0.000 | 0.000 | 0.000 | 0.000 | 0.000 | 0.000 | ||
| 3 spectra, LSFMPFFLK | 0.902 | 0.000 | 0.000 | 0.000 | 0.000 | 0.098 | 0.000 | 0.000 | ||
| 2 spectra, ASVTITSR | 1.000 | 0.000 | 0.000 | 0.000 | 0.000 | 0.000 | 0.000 | 0.000 | ||
| 4 spectra, LAMENNIK | 0.939 | 0.000 | 0.000 | 0.000 | 0.000 | 0.000 | 0.041 | 0.020 | ||
| 2 spectra, ASHNIGIAMDTER | 0.500 | 0.000 | 0.067 | 0.205 | 0.228 | 0.000 | 0.000 | 0.000 | ||
| 10 spectra, LSDIGEGIR | 0.930 | 0.035 | 0.000 | 0.000 | 0.000 | 0.000 | 0.008 | 0.027 | ||
| 1 spectrum, EELKPVALAR | 0.888 | 0.020 | 0.000 | 0.000 | 0.000 | 0.093 | 0.000 | 0.000 | ||
| 10 spectra, SYLENPAFMLLDLK | 0.914 | 0.000 | 0.000 | 0.000 | 0.000 | 0.000 | 0.086 | 0.000 | ||
| 4 spectra, AQIMNVSWSADHR | 0.528 | 0.000 | 0.192 | 0.205 | 0.000 | 0.000 | 0.075 | 0.000 | ||
| 2 spectra, DRPFPTPVSKPPVFLGK | 0.956 | 0.000 | 0.000 | 0.000 | 0.000 | 0.000 | 0.000 | 0.044 | ||
| 12 spectra, TLATPAVR | 0.891 | 0.037 | 0.000 | 0.000 | 0.042 | 0.000 | 0.029 | 0.000 | ||
| 2 spectra, TEPVTGFQK | 0.917 | 0.000 | 0.000 | 0.000 | 0.000 | 0.000 | 0.000 | 0.083 | ||
| 12 spectra, SVFEIAMELNR | 0.970 | 0.000 | 0.000 | 0.000 | 0.000 | 0.000 | 0.000 | 0.030 | ||
| 8 spectra, LSEVVGSGK | 0.727 | 0.000 | 0.051 | 0.000 | 0.026 | 0.064 | 0.132 | 0.000 | ||
| 2 spectra, YDGVIK | 0.981 | 0.000 | 0.000 | 0.000 | 0.000 | 0.000 | 0.000 | 0.019 | ||
| 4 spectra, FSNLWK | 0.965 | 0.000 | 0.000 | 0.000 | 0.000 | 0.035 | 0.000 | 0.000 | ||
| 1 spectrum, GLIVPNVK | 0.867 | 0.000 | 0.000 | 0.000 | 0.000 | 0.000 | 0.000 | 0.133 | ||
| 3 spectra, EDILNFLEK | 0.938 | 0.000 | 0.000 | 0.000 | 0.000 | 0.000 | 0.000 | 0.062 | ||
| 14 spectra, VIDGATMSR | 0.989 | 0.000 | 0.000 | 0.000 | 0.000 | 0.000 | 0.000 | 0.011 |
| Plot | Mito | Lyso or Perox | ER | Golgi | PM | Cytosol | Nucleus | ||||||
| Expt B |
17 peptides |
68 spectra |
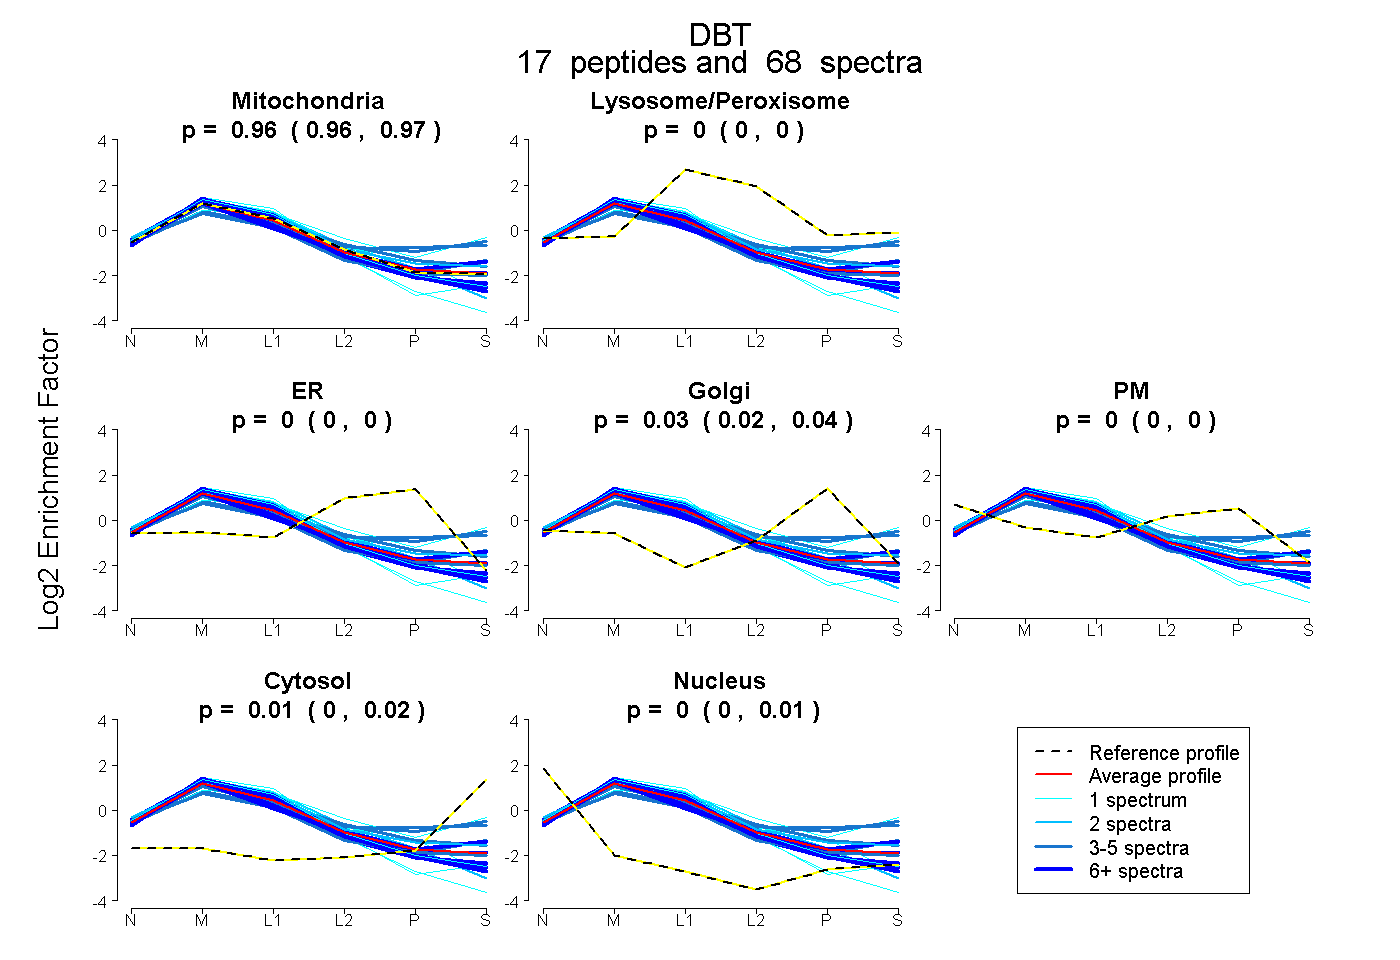 |
0.961 0.956 | 0.965 |
0.000 0.000 | 0.000 |
0.000 0.000 | 0.000 |
0.029 0.022 | 0.035 |
0.000 0.000 | 0.000 |
0.008 0.000 | 0.015 |
0.001 0.000 | 0.005 |
|||
| Plot | Lyso | Other | |||||||||||
| Expt C |
22 peptides |
465 spectra |
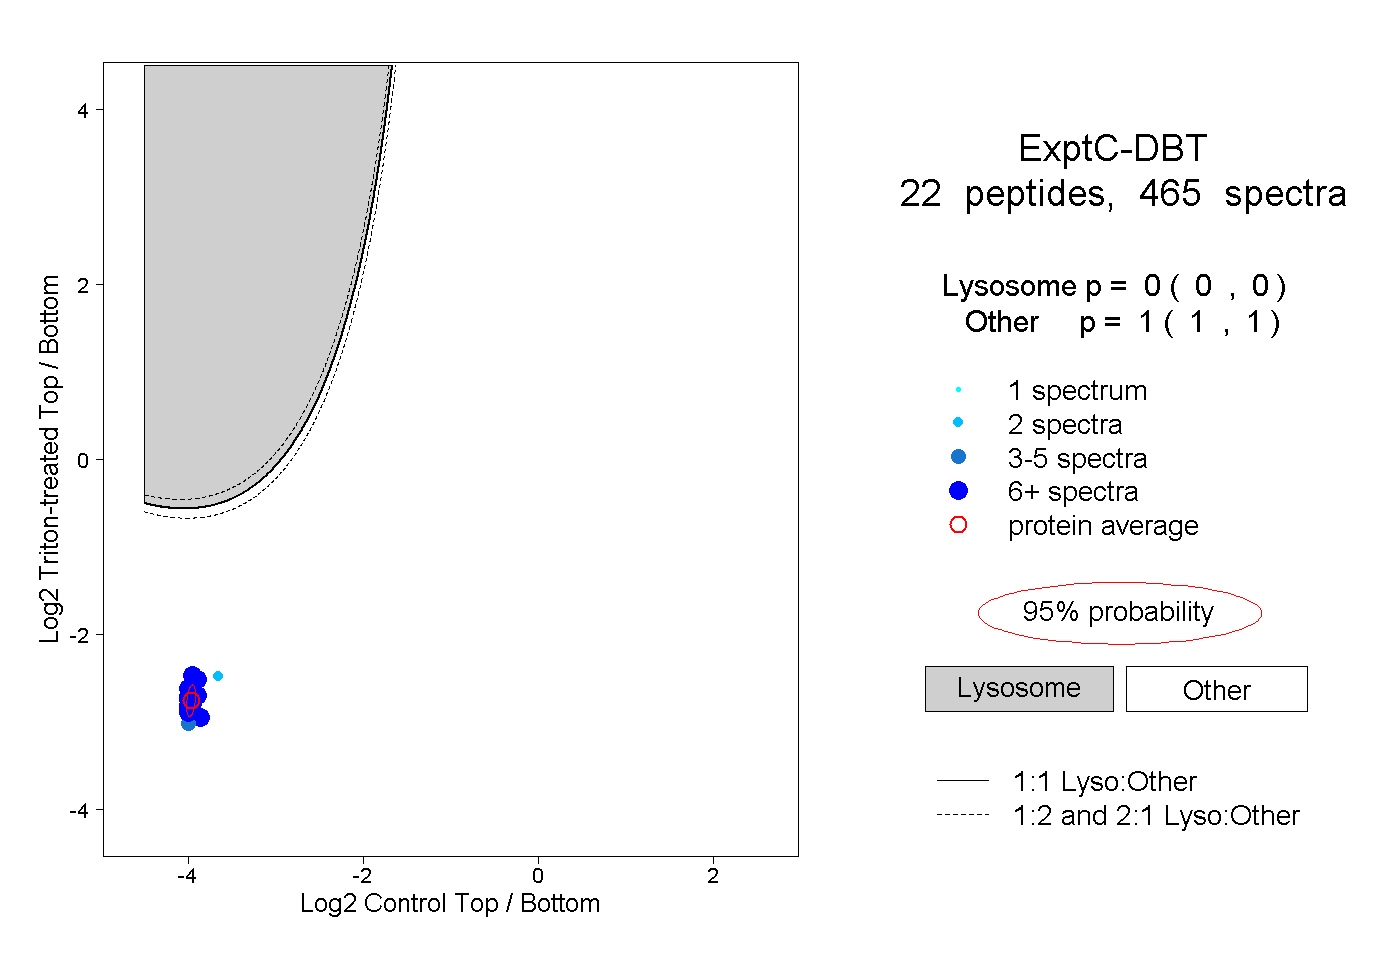 |
0.000 0.000 | 0.000 |
1.000 1.000 | 1.000 |
||||||||
| Plot | Lyso | Other | |||||||||||
| Expt D |
11 peptides |
40 spectra |
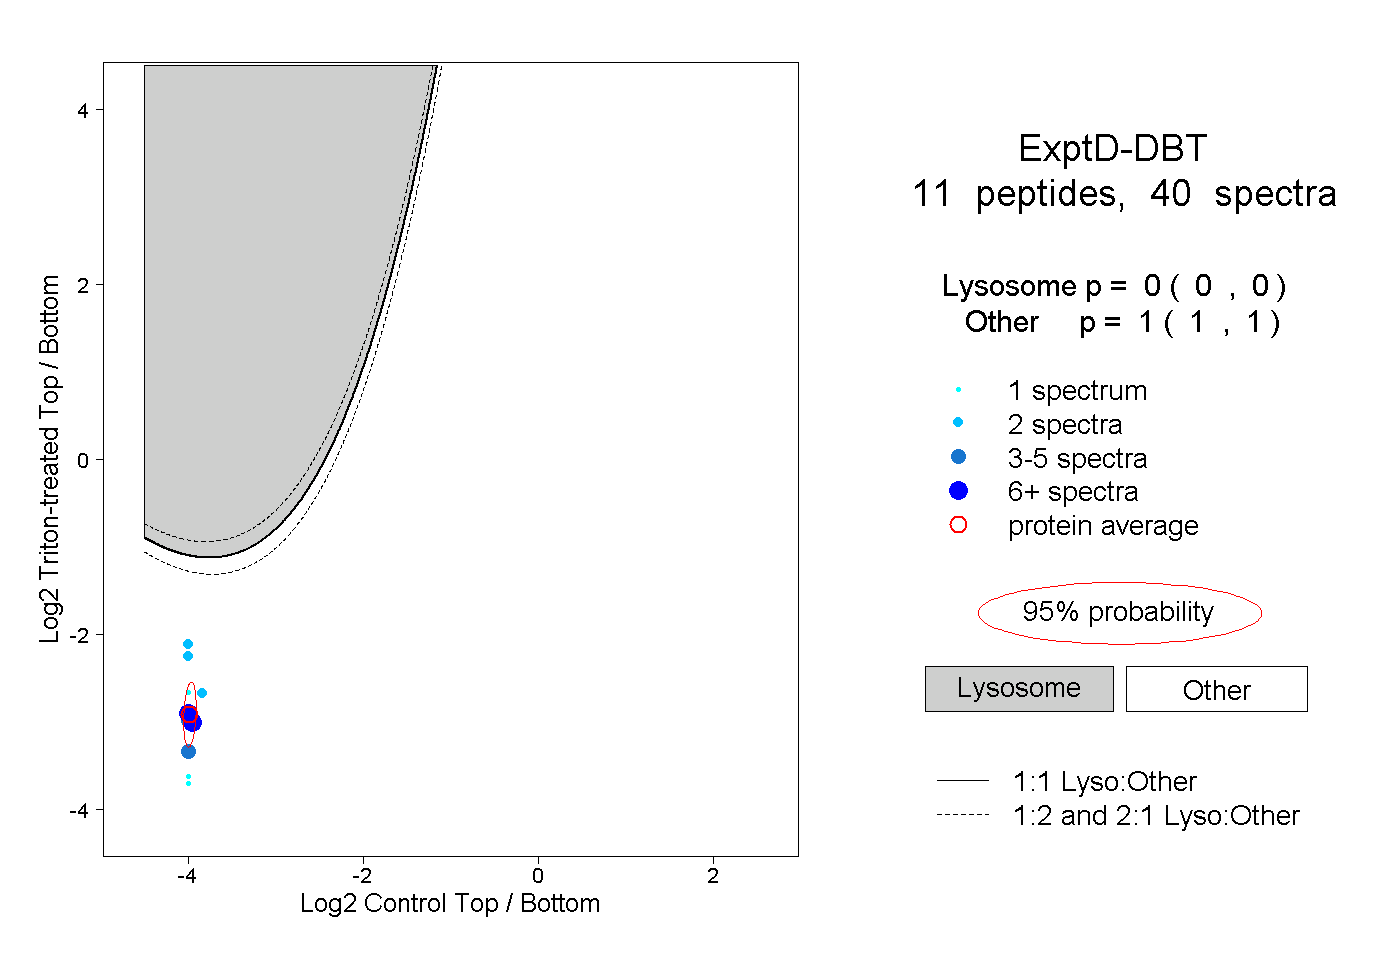 |
0.000 0.000 | 0.000 |
1.000 1.000 | 1.000 |