 11
11peptides
spectra
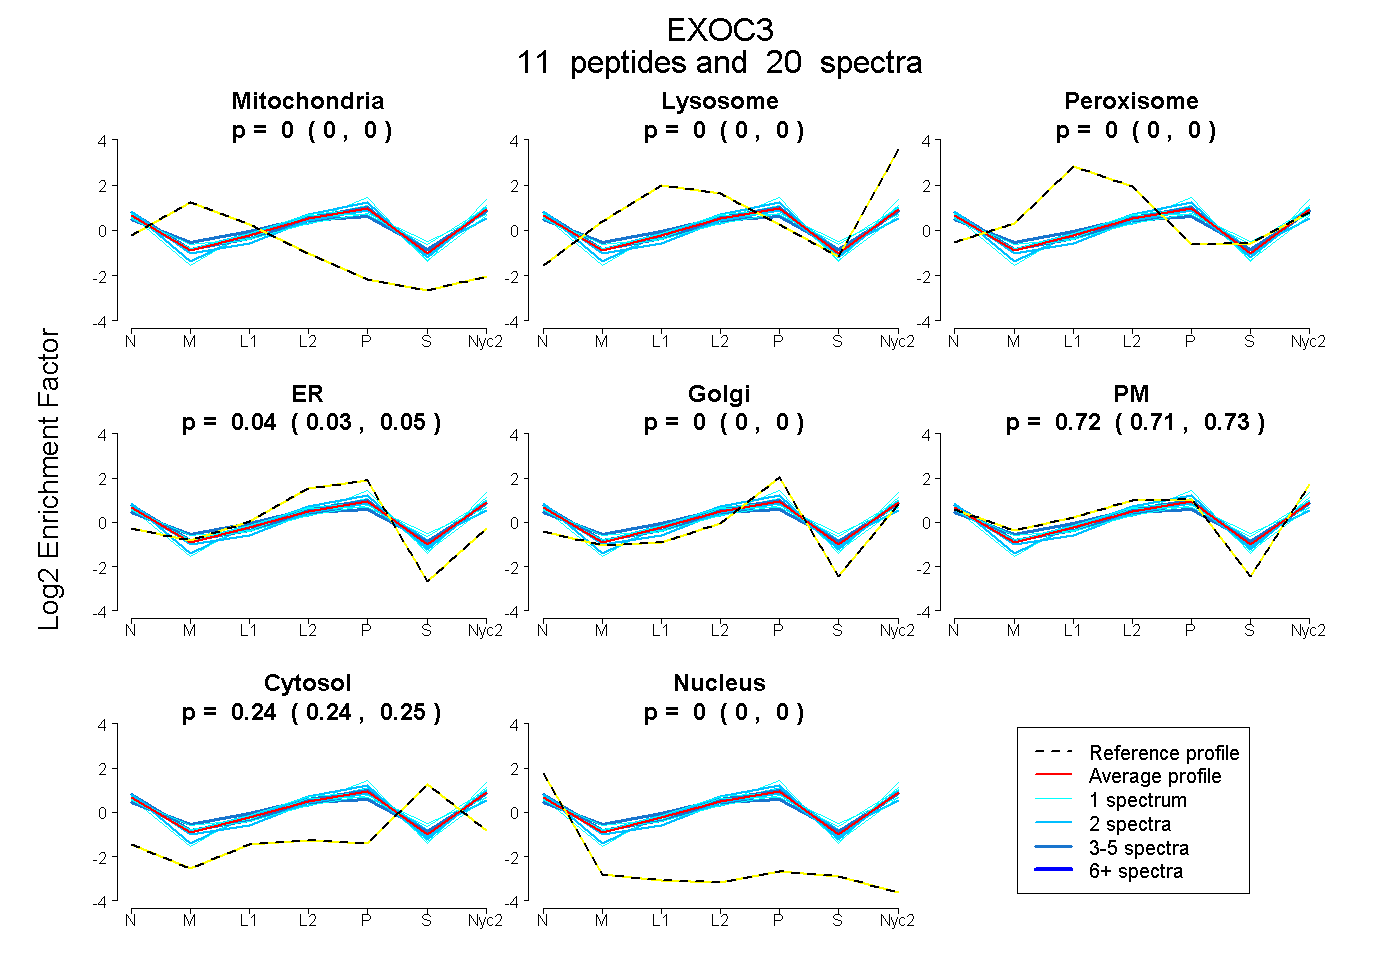
0.000 | 0.000
0.000 | 0.000
0.000 | 0.000
0.027 | 0.050
0.000 | 0.000
0.707 | 0.729
0.237 | 0.246
0.000 | 0.000
4peptides
spectra
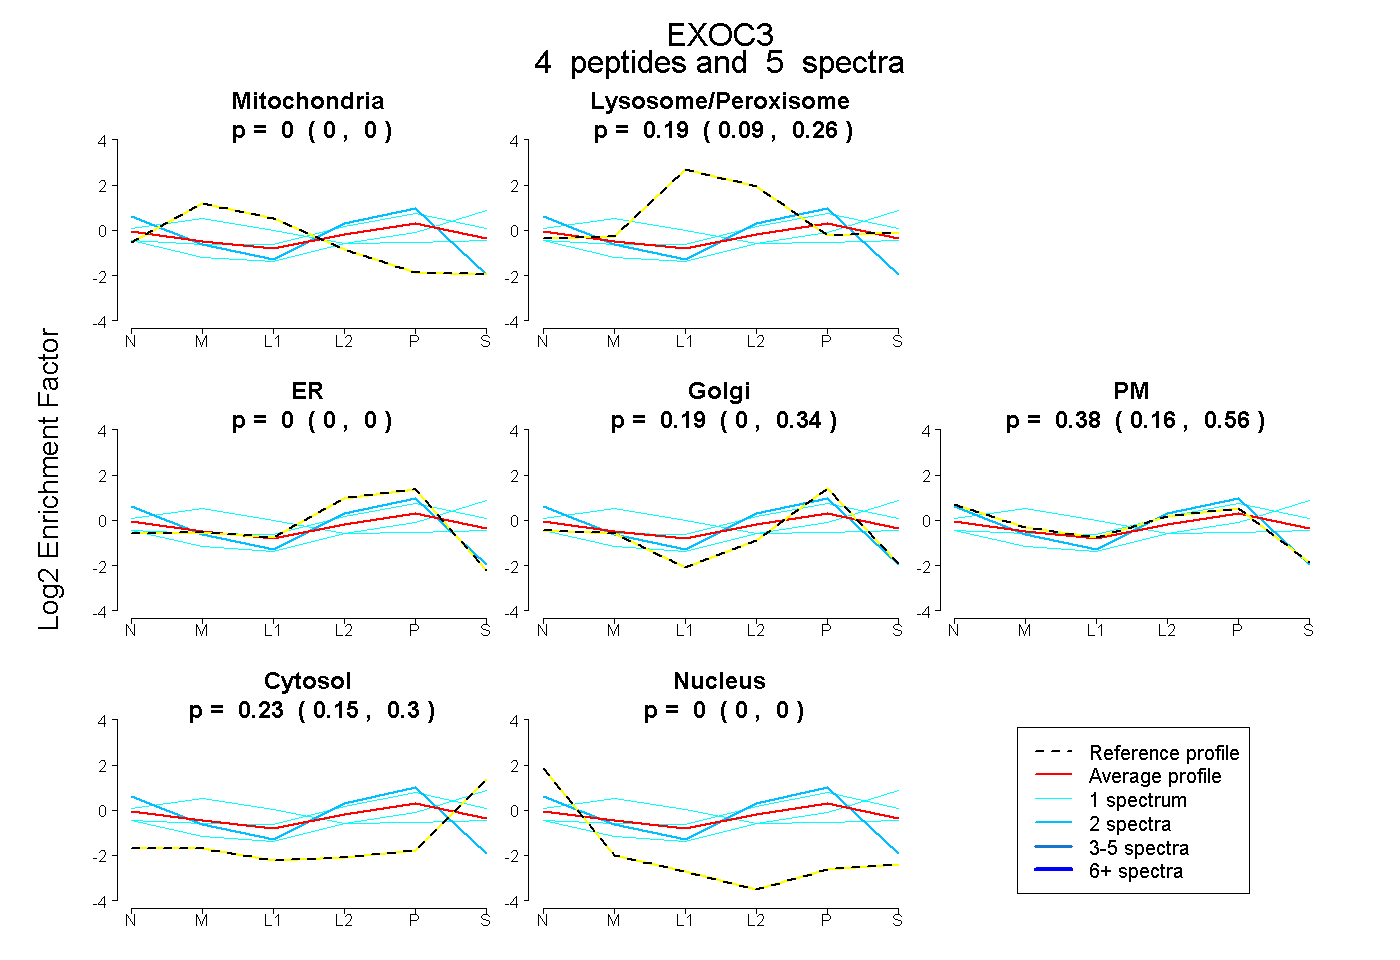
0.000 | 0.000
0.094 | 0.263
0.000 | 0.000
0.004 | 0.344
0.165 | 0.556
0.152 | 0.302
0.000 | 0.000
10peptides
spectra
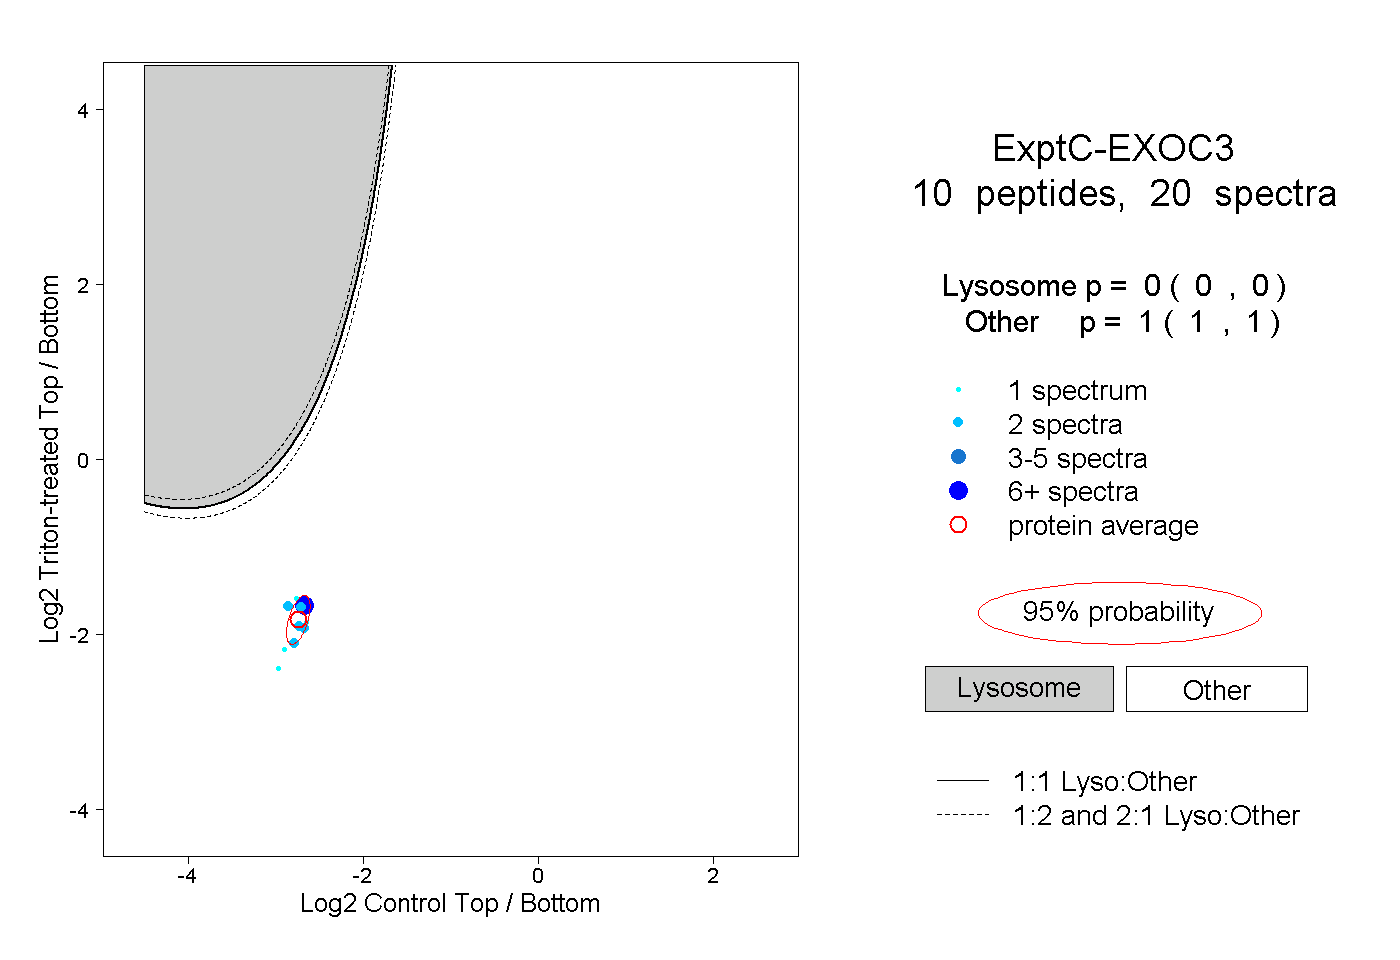
0.000 | 0.000
1.000 | 1.000
2peptides
spectra
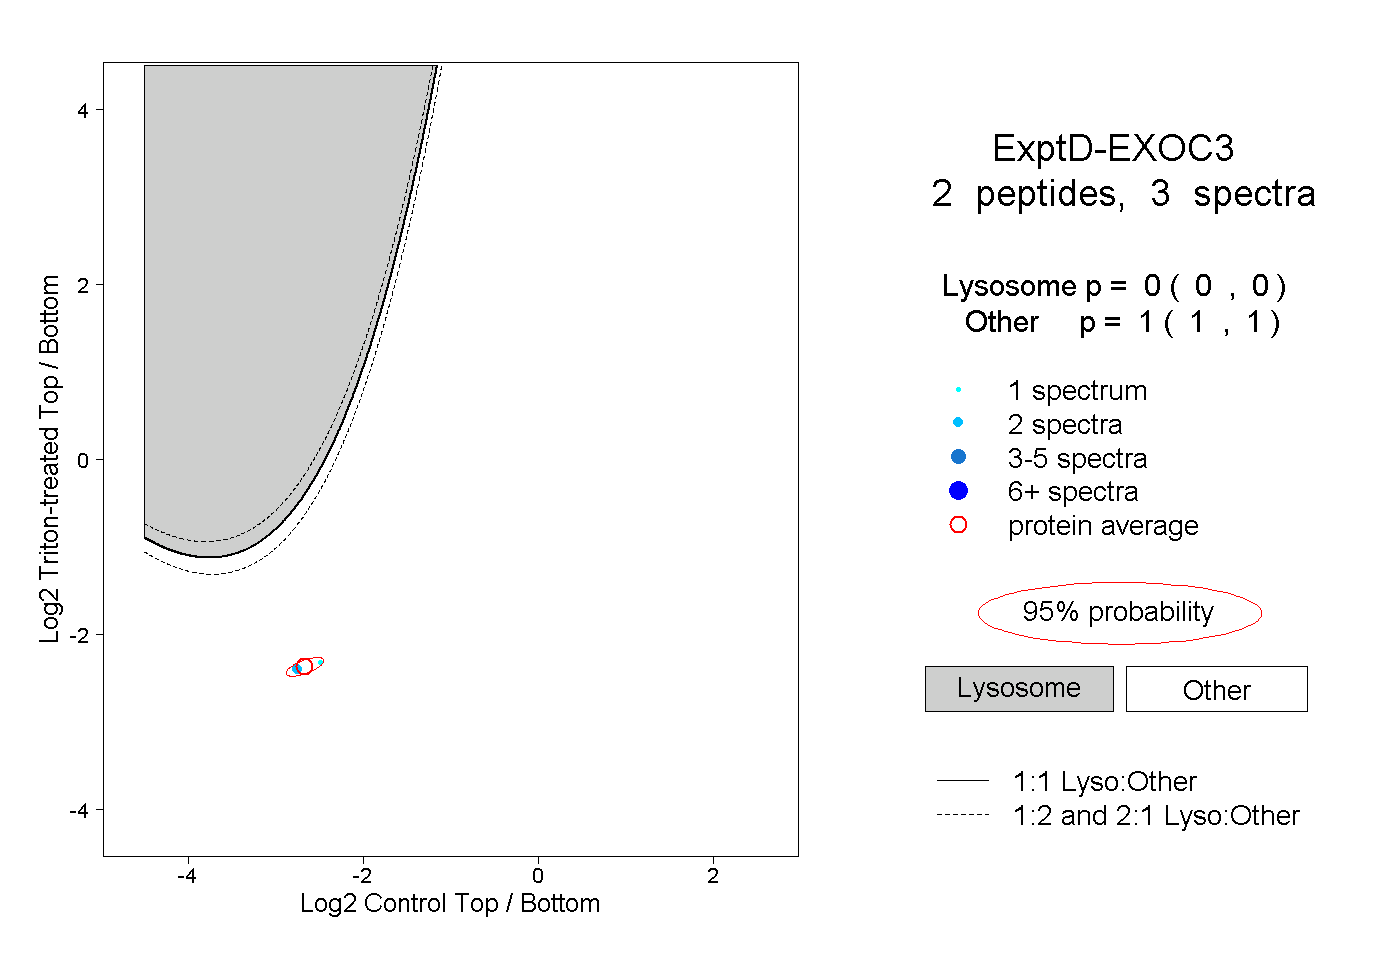
0.000 | 0.000
1.000 | 1.000