EXOC3
[ENSRNOP00000020251]
Main page
| | | Plot |
Mito |
Lyso |
|
Perox |
ER |
Golgi |
PM |
Cytosol |
Nucleus |
|
| Expt A |
 11
11
peptides |
20
spectra |
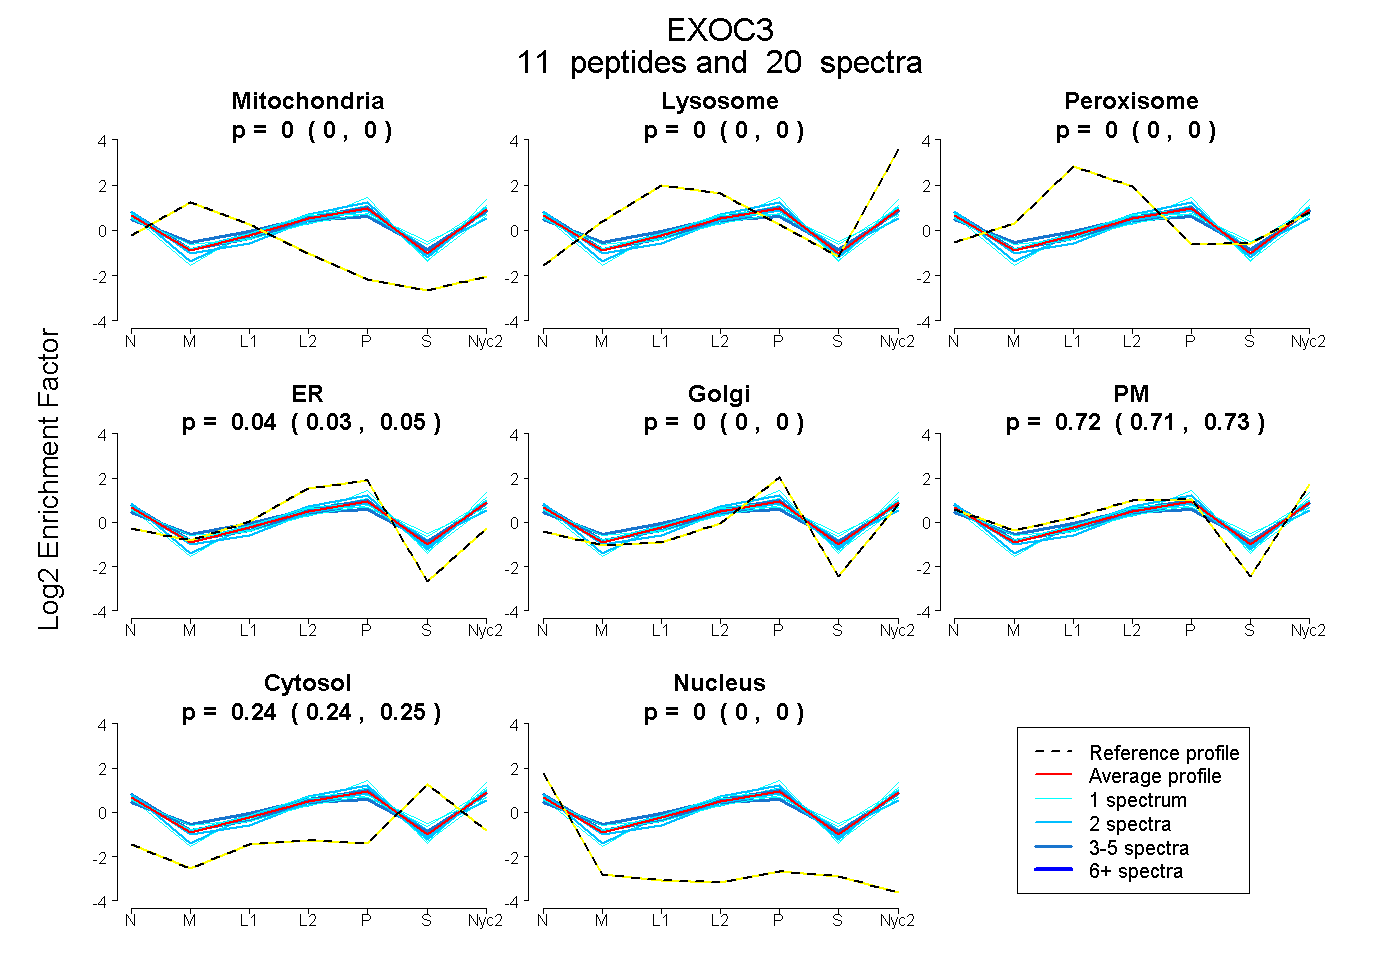 |
0.000
0.000 | 0.000 |
0.000
0.000 | 0.000 |
|
0.000
0.000 | 0.000 |
0.039
0.027 | 0.050 |
0.000
0.000 | 0.000 |
0.719
0.707 | 0.729 |
0.242
0.237 | 0.246 |
0.000
0.000 | 0.000 |
|
| | | Plot |
Mito |
|
Lyso or Perox |
|
ER |
Golgi |
PM |
Cytosol |
Nucleus |
|
| Expt B |
4
peptides |
5
spectra |
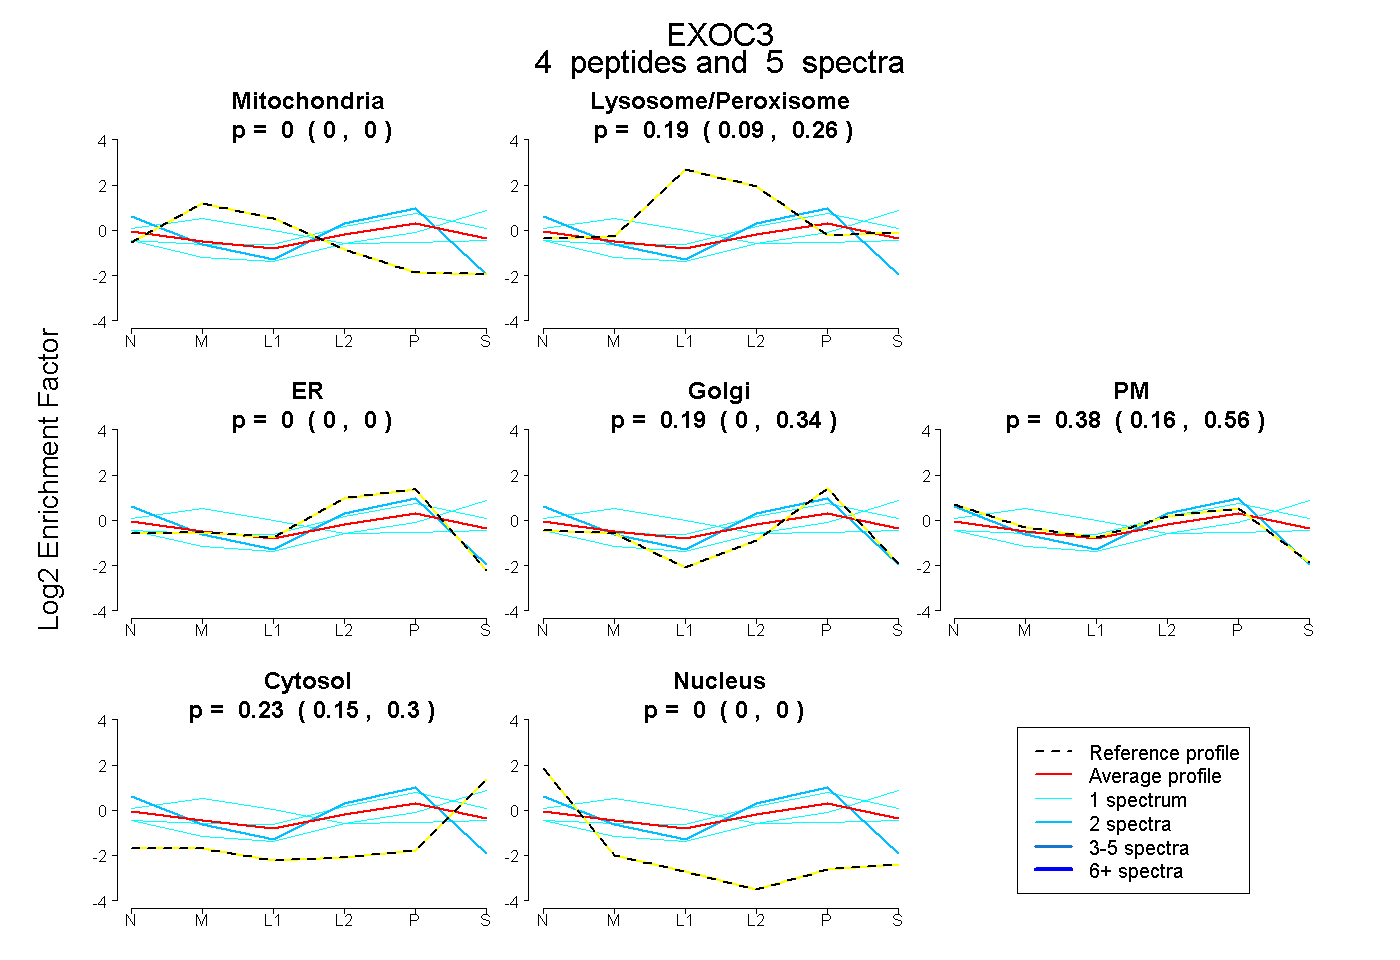 |
0.000
0.000 | 0.000 |
|
0.193
0.094 | 0.263 |
|
0.000
0.000 | 0.000 |
0.192
0.004 | 0.344 |
0.382
0.165 | 0.556 |
0.234
0.152 | 0.302 |
0.000
0.000 | 0.000 |
|
| 1 spectrum, EAEQLR |
0.000 |
|
0.363 |
|
0.000 |
0.449 |
0.000 |
0.188 |
0.000 |
|
| 2 spectra, HLEIIR |
0.000 |
|
0.000 |
|
0.139 |
0.185 |
0.676 |
0.000 |
0.000 |
|
| 1 spectrum, AAIQSQLDGVR |
0.331 |
|
0.166 |
|
0.000 |
0.000 |
0.319 |
0.184 |
0.000 |
|
| 1 spectrum, IEGTQADTR |
0.000 |
|
0.183 |
|
0.000 |
0.174 |
0.127 |
0.516 |
0.000 |
|
| | | Plot |
|
Lyso |
|
|
|
|
|
|
|
Other |
| Expt C |
10
peptides |
20
spectra |
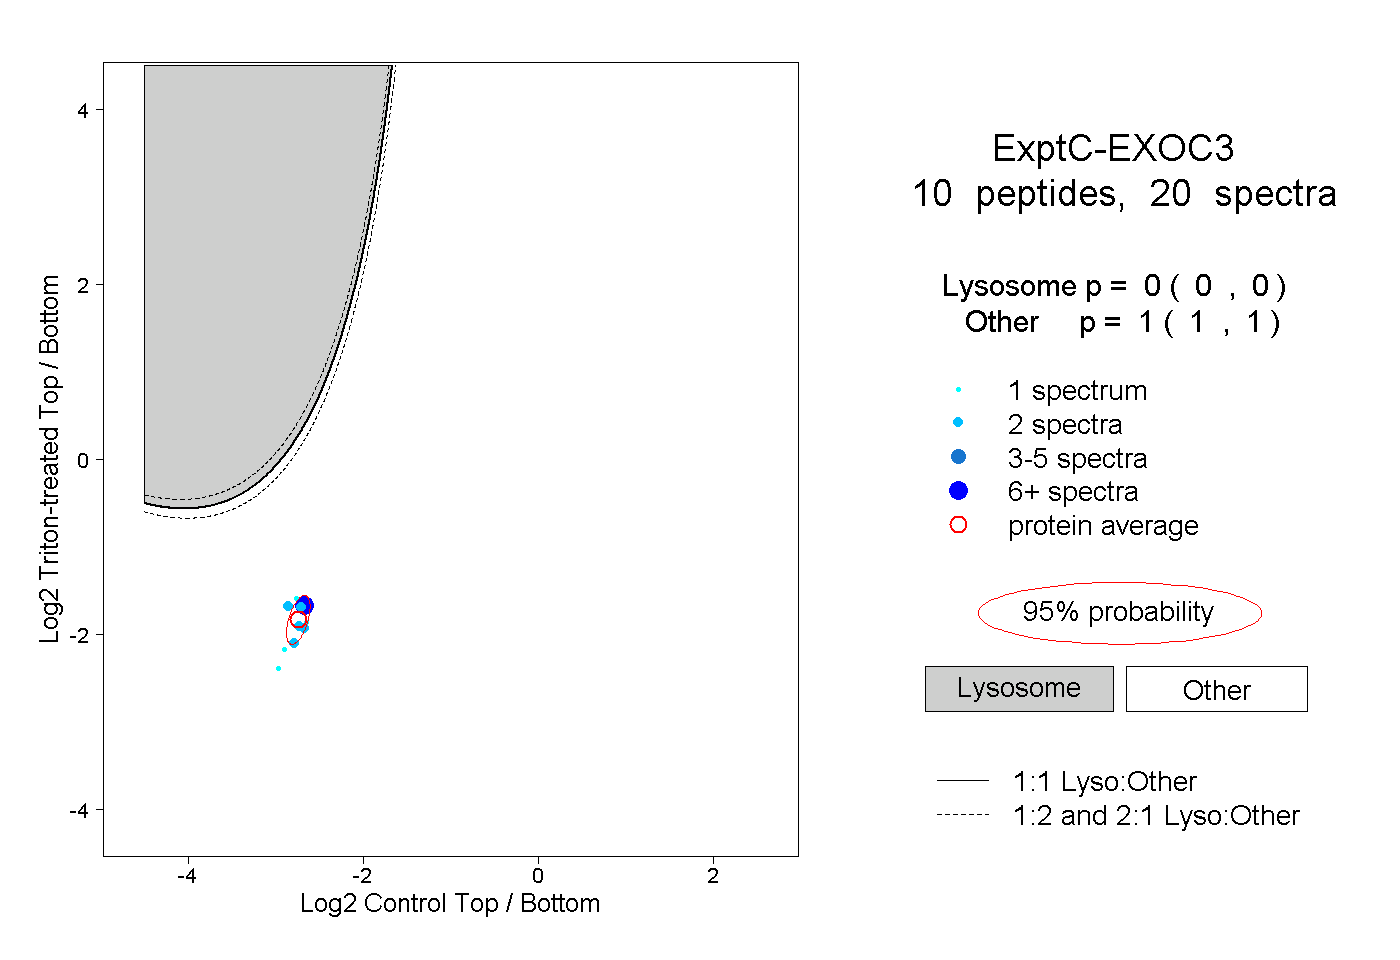 |
|
0.000
0.000 | 0.000 |
|
|
|
|
|
|
|
1.000
1.000 | 1.000 |
| | | Plot |
|
Lyso |
|
|
|
|
|
|
|
Other |
| Expt D |
2
peptides |
3
spectra |
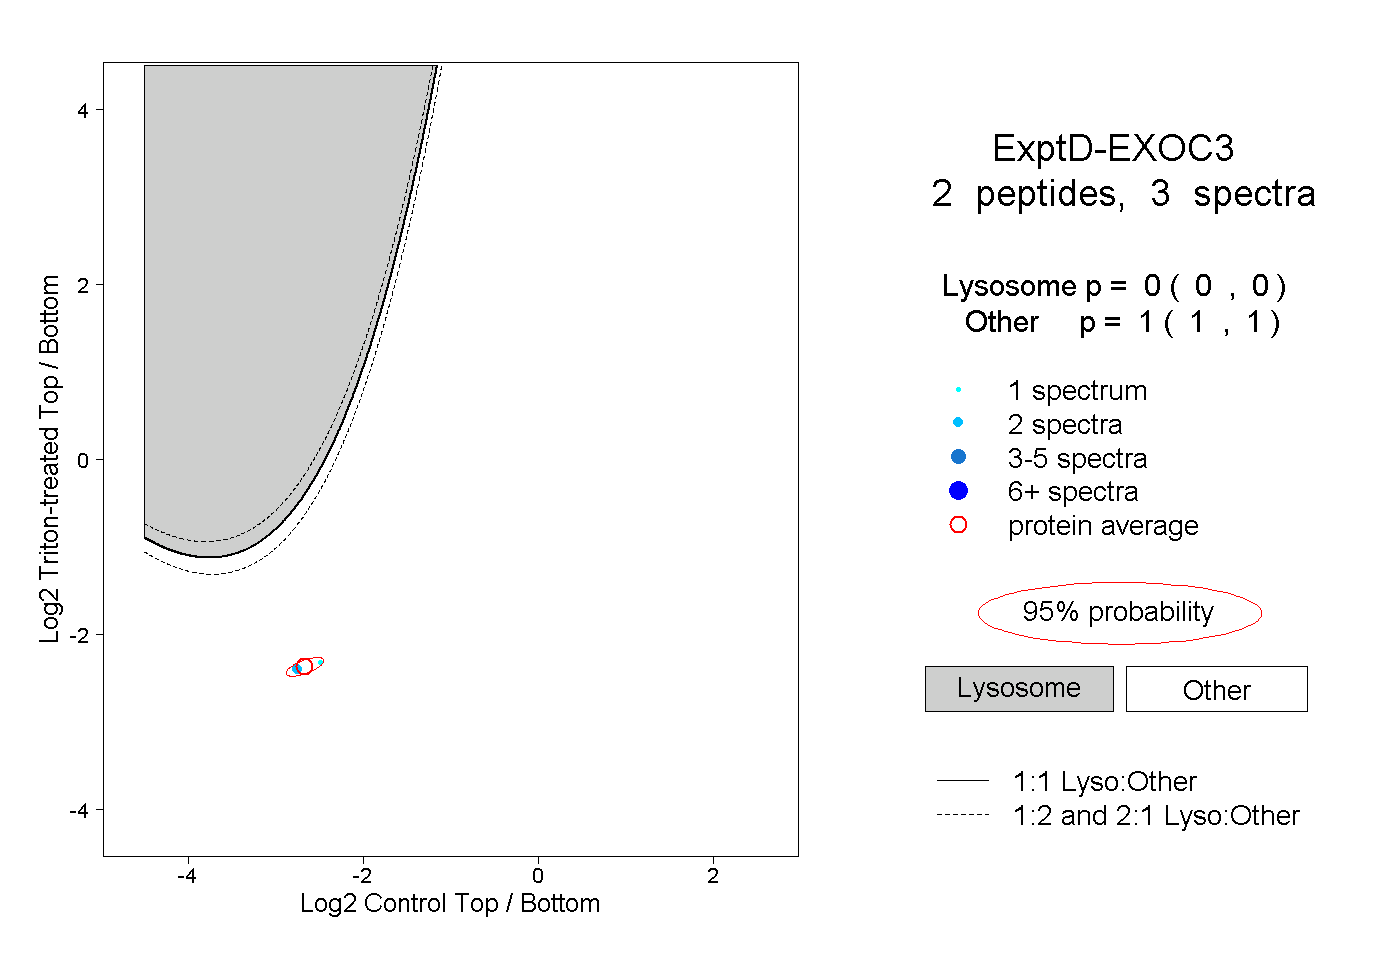 |
|
0.000
0.000 | 0.000 |
|
|
|
|
|
|
|
1.000
1.000 | 1.000 |