 11
11peptides
spectra
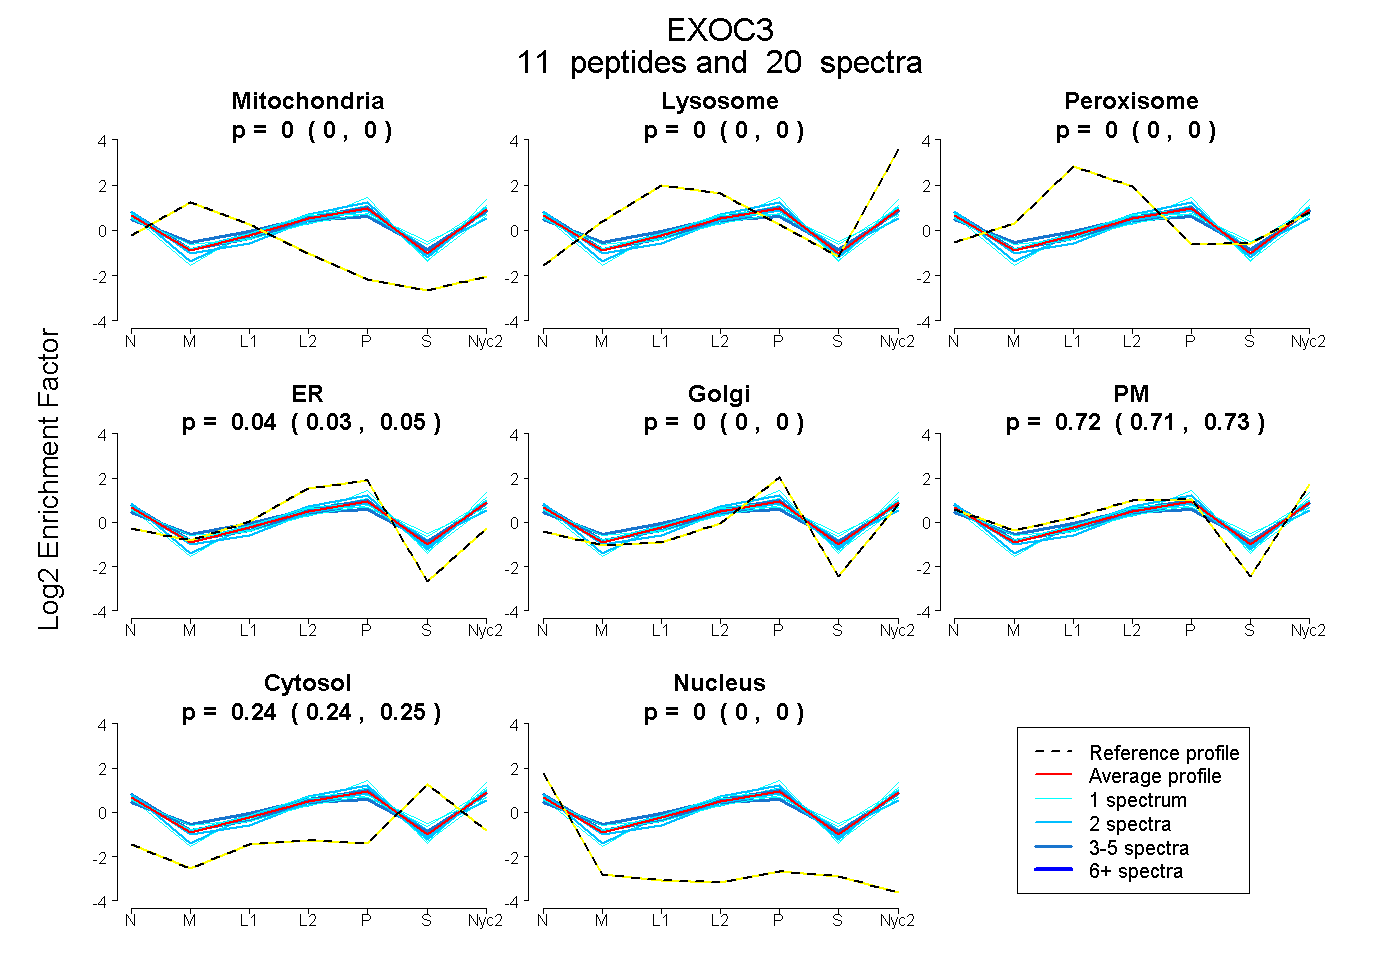
0.000 | 0.000
0.000 | 0.000
0.000 | 0.000
0.027 | 0.050
0.000 | 0.000
0.707 | 0.729
0.237 | 0.246
0.000 | 0.000
| Plot | Mito | Lyso | Perox | ER | Golgi | PM | Cytosol | Nucleus | |||||
| Expt A |
11 peptides |
20 spectra |
|
0.000 0.000 | 0.000 |
0.000 0.000 | 0.000 |
0.000 0.000 | 0.000 |
0.039 0.027 | 0.050 |
0.000 0.000 | 0.000 |
0.719 0.707 | 0.729 |
0.242 0.237 | 0.246 |
0.000 0.000 | 0.000 |
| 2 spectra, QTGFVPPGRPK | 0.000 | 0.000 | 0.000 | 0.000 | 0.035 | 0.719 | 0.230 | 0.017 | ||
| 3 spectra, HLEIIR | 0.000 | 0.000 | 0.077 | 0.046 | 0.061 | 0.623 | 0.193 | 0.000 | ||
| 1 spectrum, VAGMLQRPDQLDK | 0.000 | 0.000 | 0.044 | 0.000 | 0.000 | 0.692 | 0.264 | 0.000 | ||
| 2 spectra, QLWMVLQR | 0.000 | 0.000 | 0.000 | 0.104 | 0.041 | 0.675 | 0.180 | 0.000 | ||
| 1 spectrum, SLVTVR | 0.000 | 0.000 | 0.009 | 0.002 | 0.000 | 0.660 | 0.328 | 0.000 | ||
| 2 spectra, DGLMCEQYR | 0.000 | 0.000 | 0.012 | 0.122 | 0.000 | 0.592 | 0.274 | 0.000 | ||
| 1 spectrum, QSINTIESLK | 0.000 | 0.000 | 0.006 | 0.000 | 0.000 | 0.786 | 0.208 | 0.000 | ||
| 2 spectra, AAIQSQLDGVR | 0.000 | 0.000 | 0.000 | 0.061 | 0.021 | 0.692 | 0.219 | 0.007 | ||
| 1 spectrum, DDHIGALLALR | 0.000 | 0.000 | 0.000 | 0.000 | 0.216 | 0.635 | 0.149 | 0.000 | ||
| 4 spectra, IEGTQADTR | 0.000 | 0.000 | 0.000 | 0.000 | 0.000 | 0.721 | 0.273 | 0.005 | ||
| 1 spectrum, ETDLEAVATAVQR | 0.000 | 0.000 | 0.000 | 0.158 | 0.000 | 0.640 | 0.186 | 0.016 |
| Plot | Mito | Lyso or Perox | ER | Golgi | PM | Cytosol | Nucleus | ||||||
| Expt B |
4 peptides |
5 spectra |
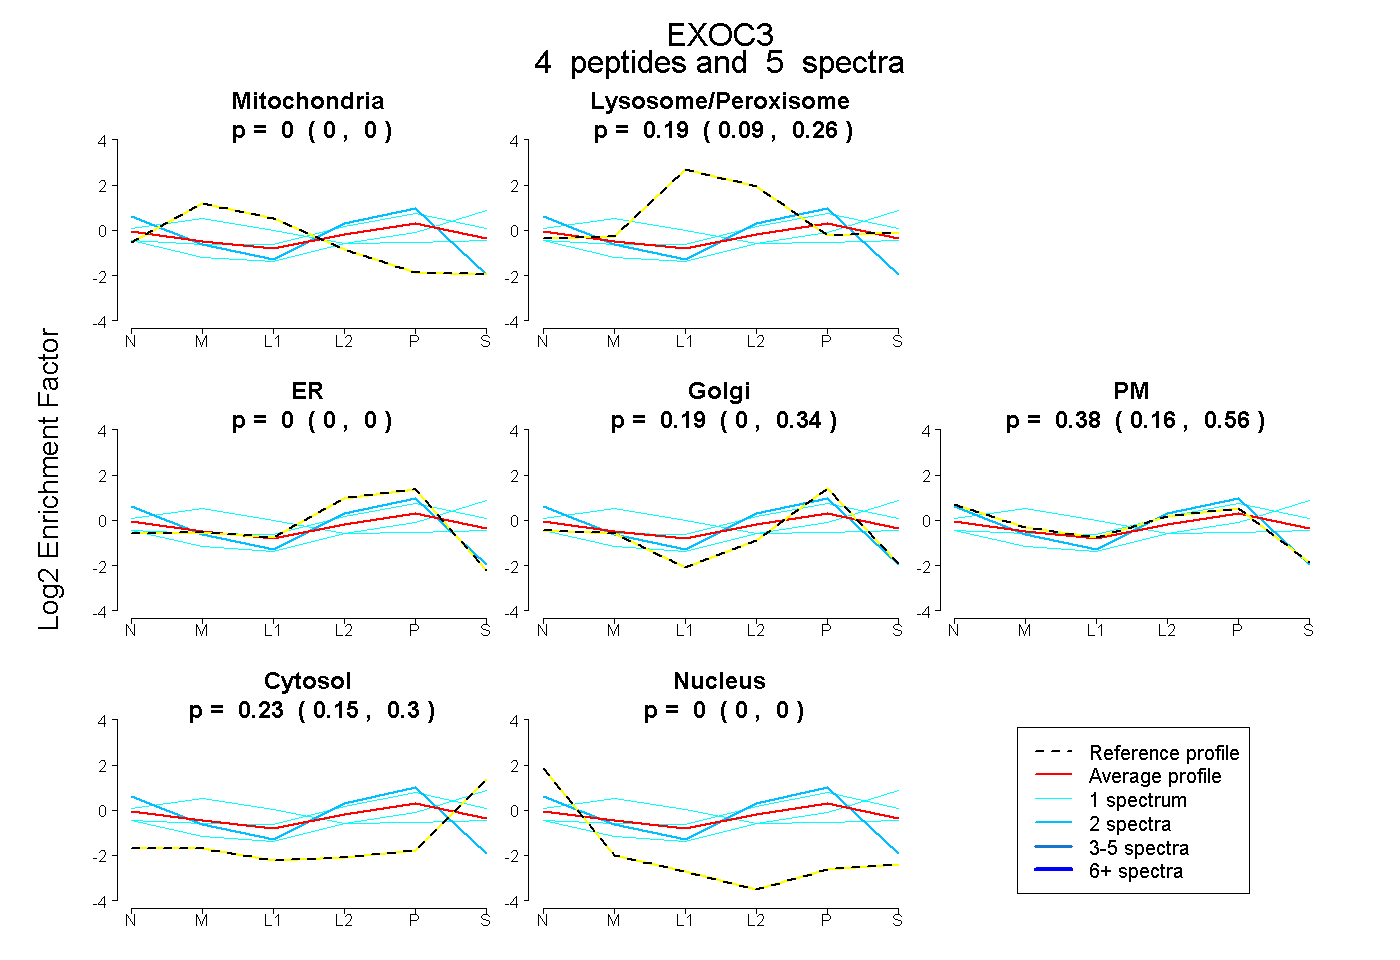 |
0.000 0.000 | 0.000 |
0.193 0.094 | 0.263 |
0.000 0.000 | 0.000 |
0.192 0.004 | 0.344 |
0.382 0.165 | 0.556 |
0.234 0.152 | 0.302 |
0.000 0.000 | 0.000 |
|||
| Plot | Lyso | Other | |||||||||||
| Expt C |
10 peptides |
20 spectra |
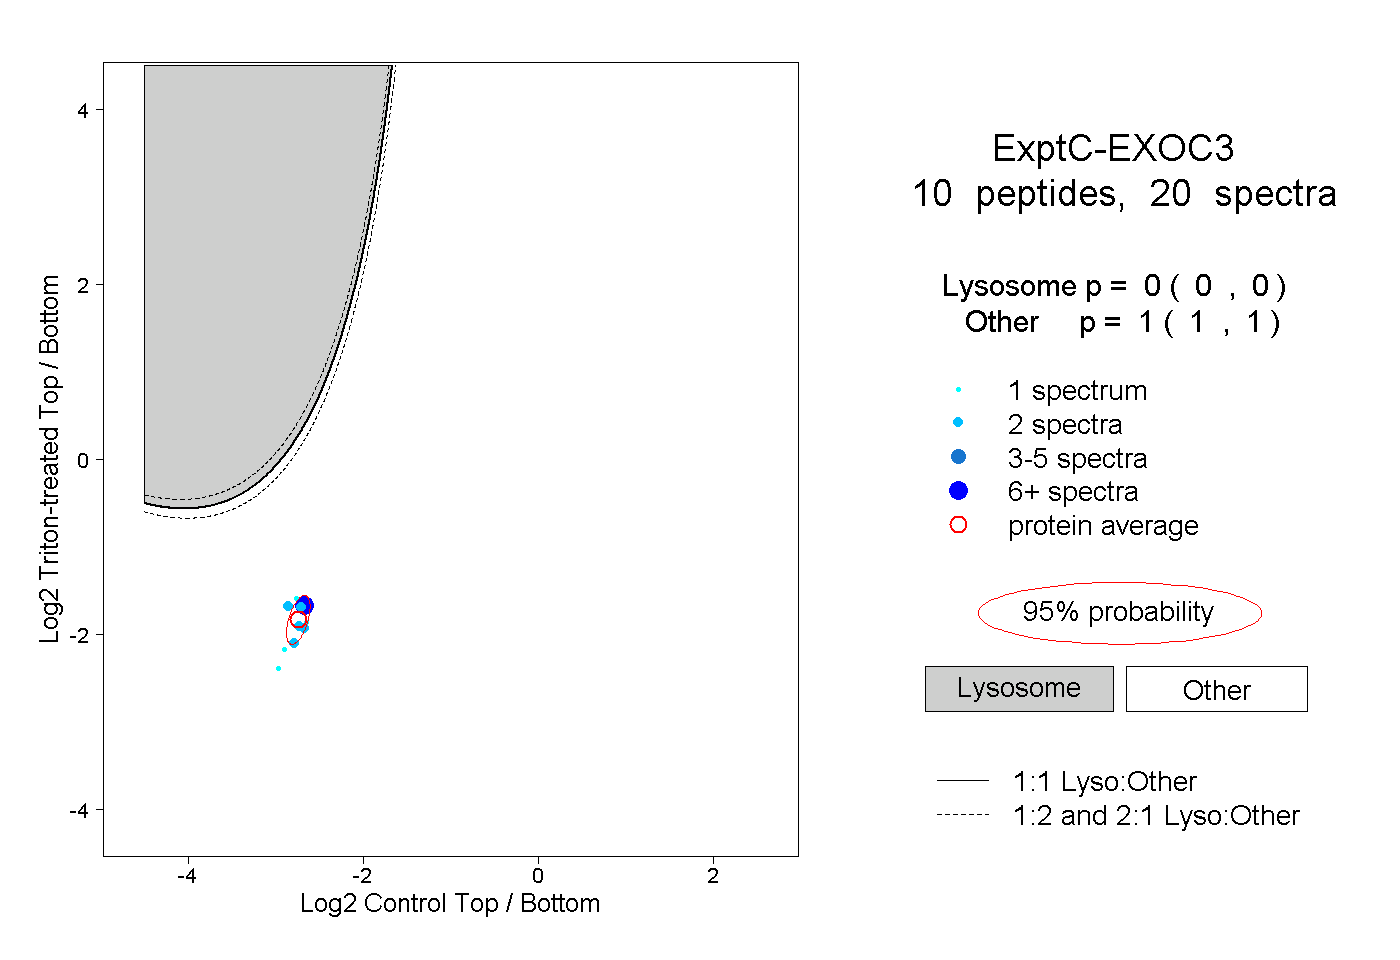 |
0.000 0.000 | 0.000 |
1.000 1.000 | 1.000 |
||||||||
| Plot | Lyso | Other | |||||||||||
| Expt D |
2 peptides |
3 spectra |
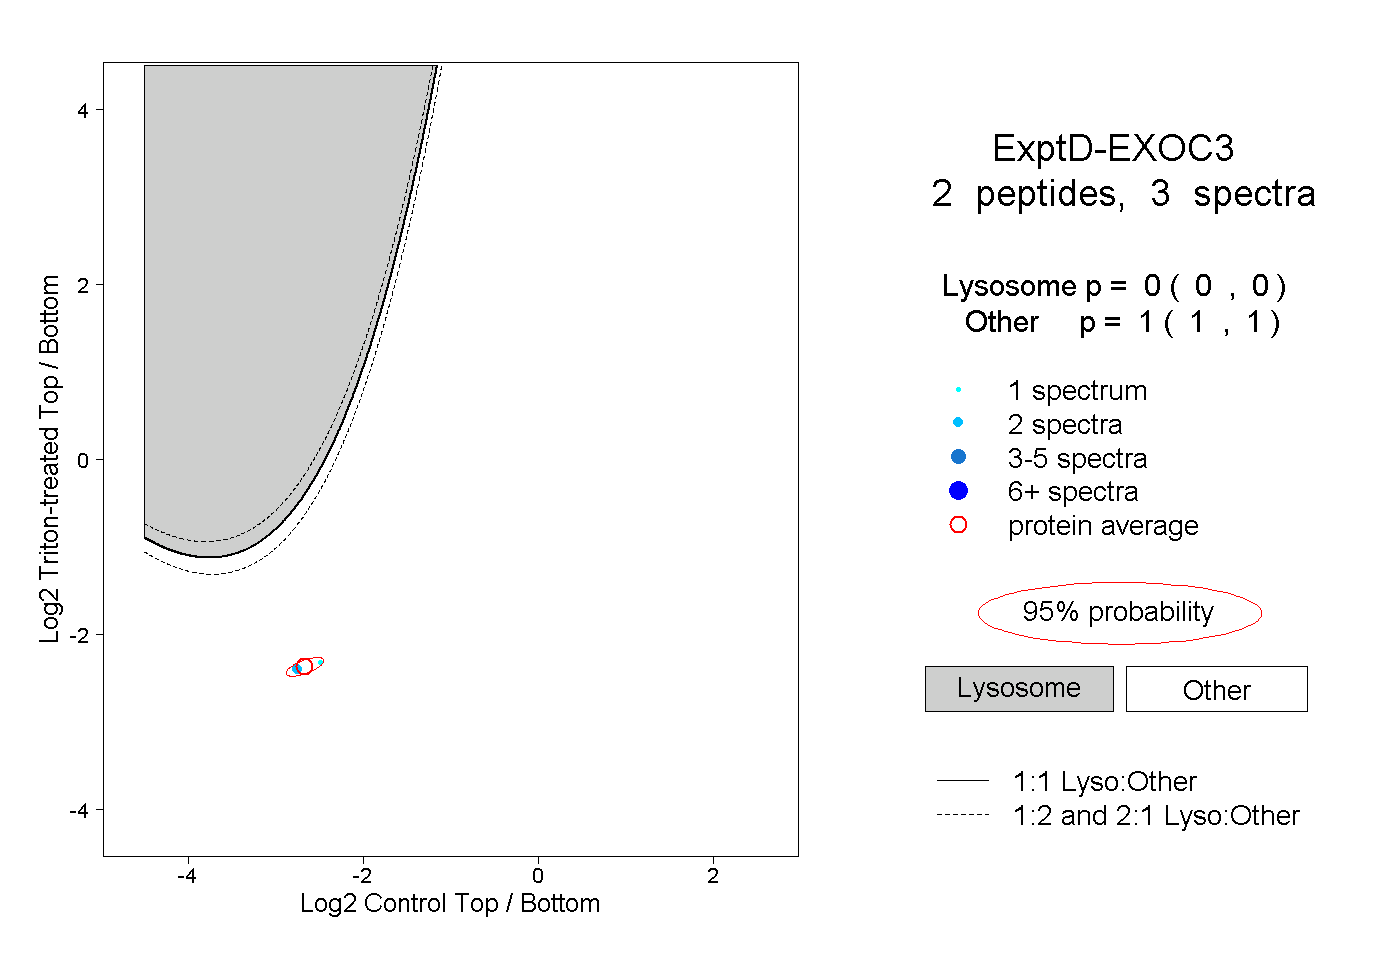 |
0.000 0.000 | 0.000 |
1.000 1.000 | 1.000 |