 12
12peptides
spectra
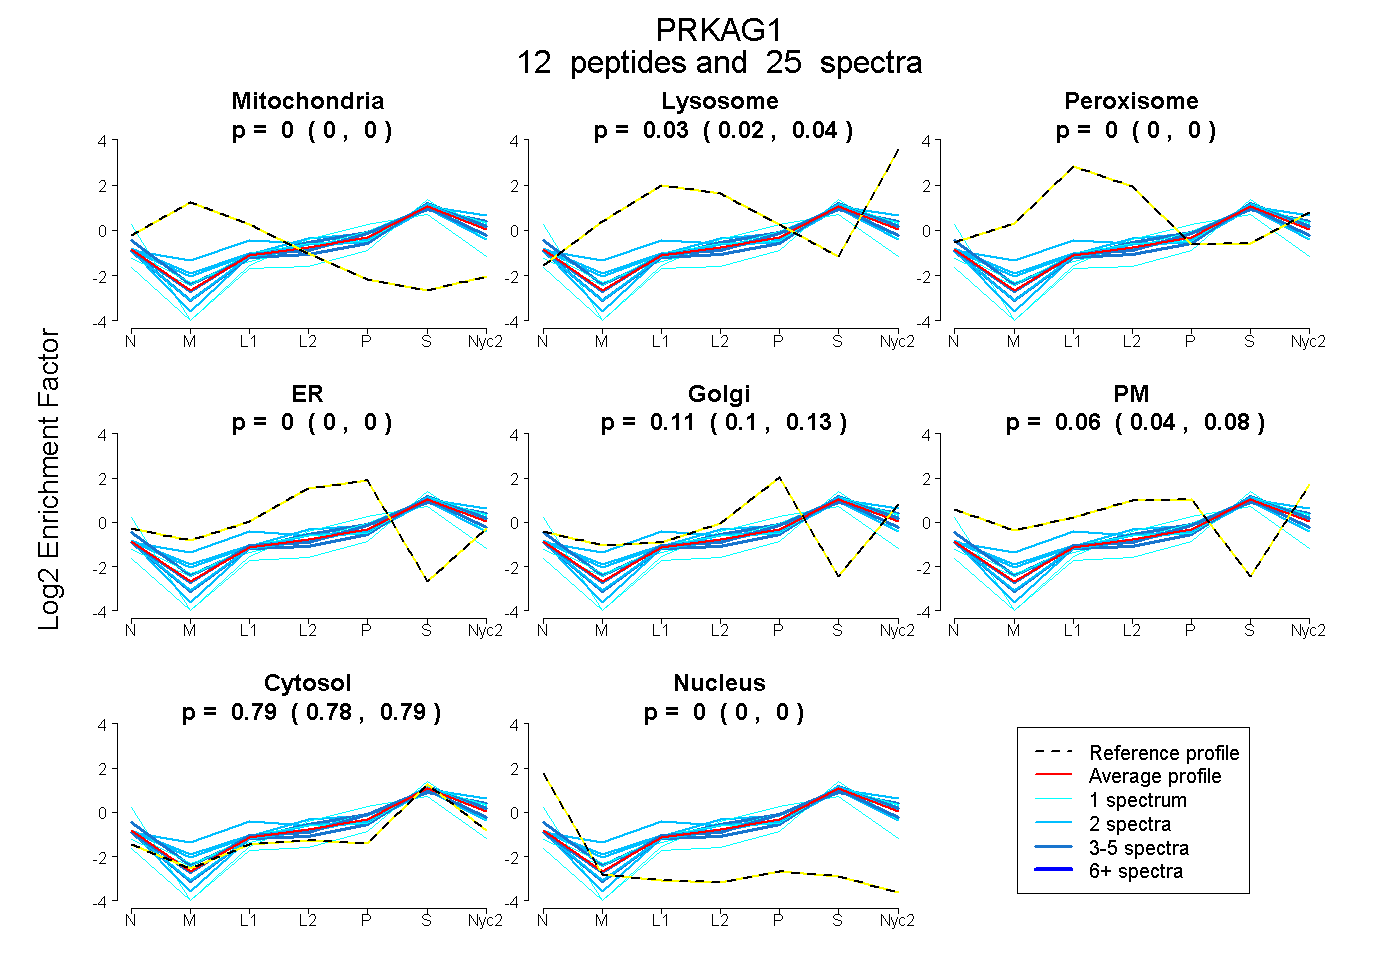
0.000 | 0.000
0.022 | 0.044
0.000 | 0.000
0.000 | 0.000
0.095 | 0.128
0.042 | 0.084
0.783 | 0.795
0.000 | 0.000
4peptides
spectra
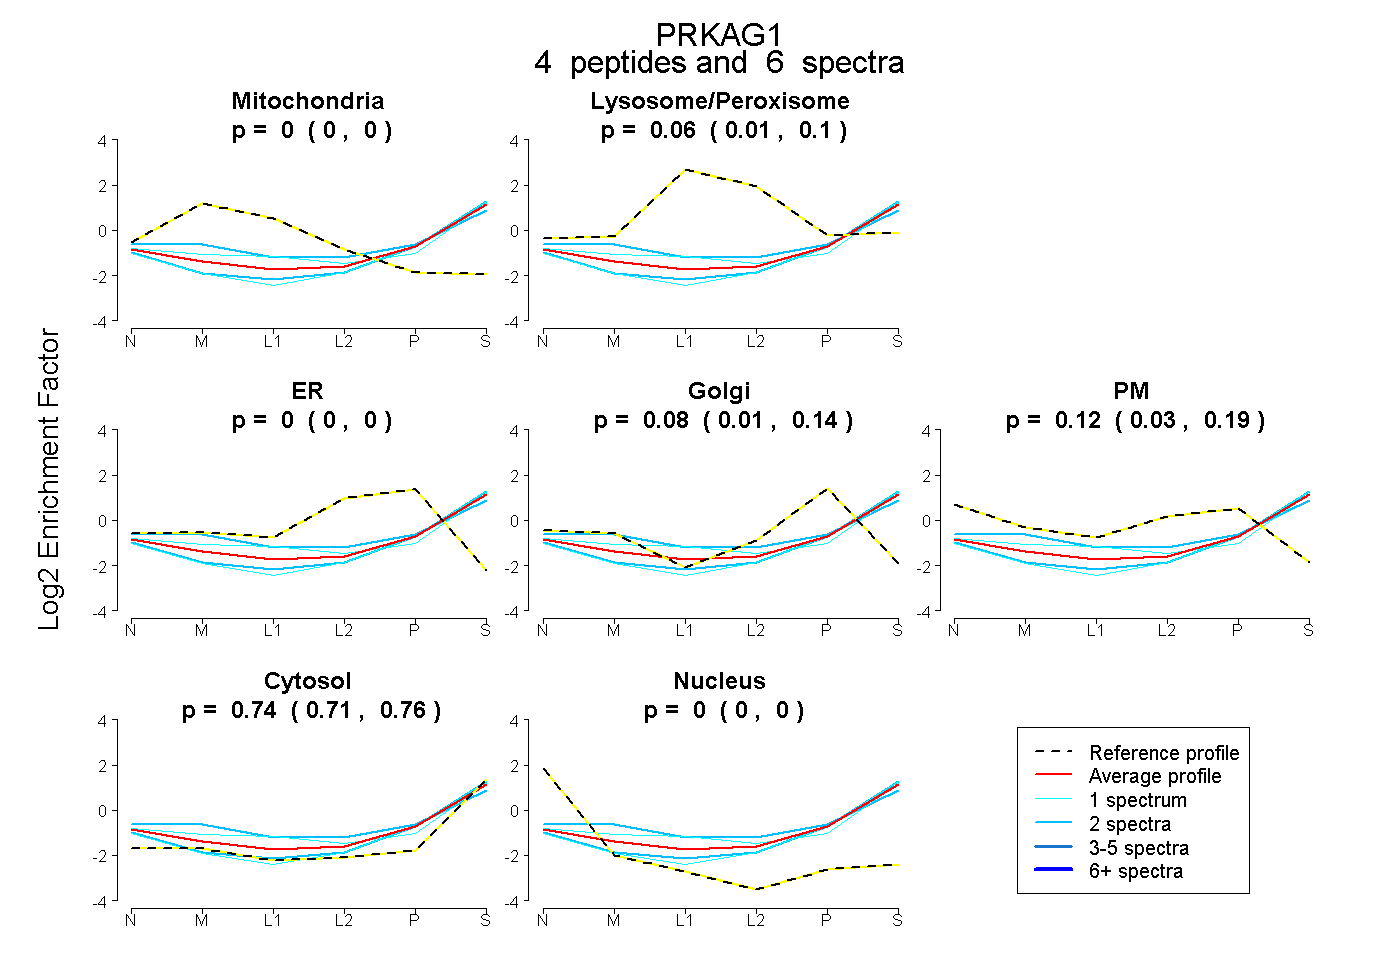
0.000 | 0.000
0.007 | 0.104
0.000 | 0.000
0.009 | 0.140
0.026 | 0.193
0.712 | 0.762
0.000 | 0.000
9peptides
spectra
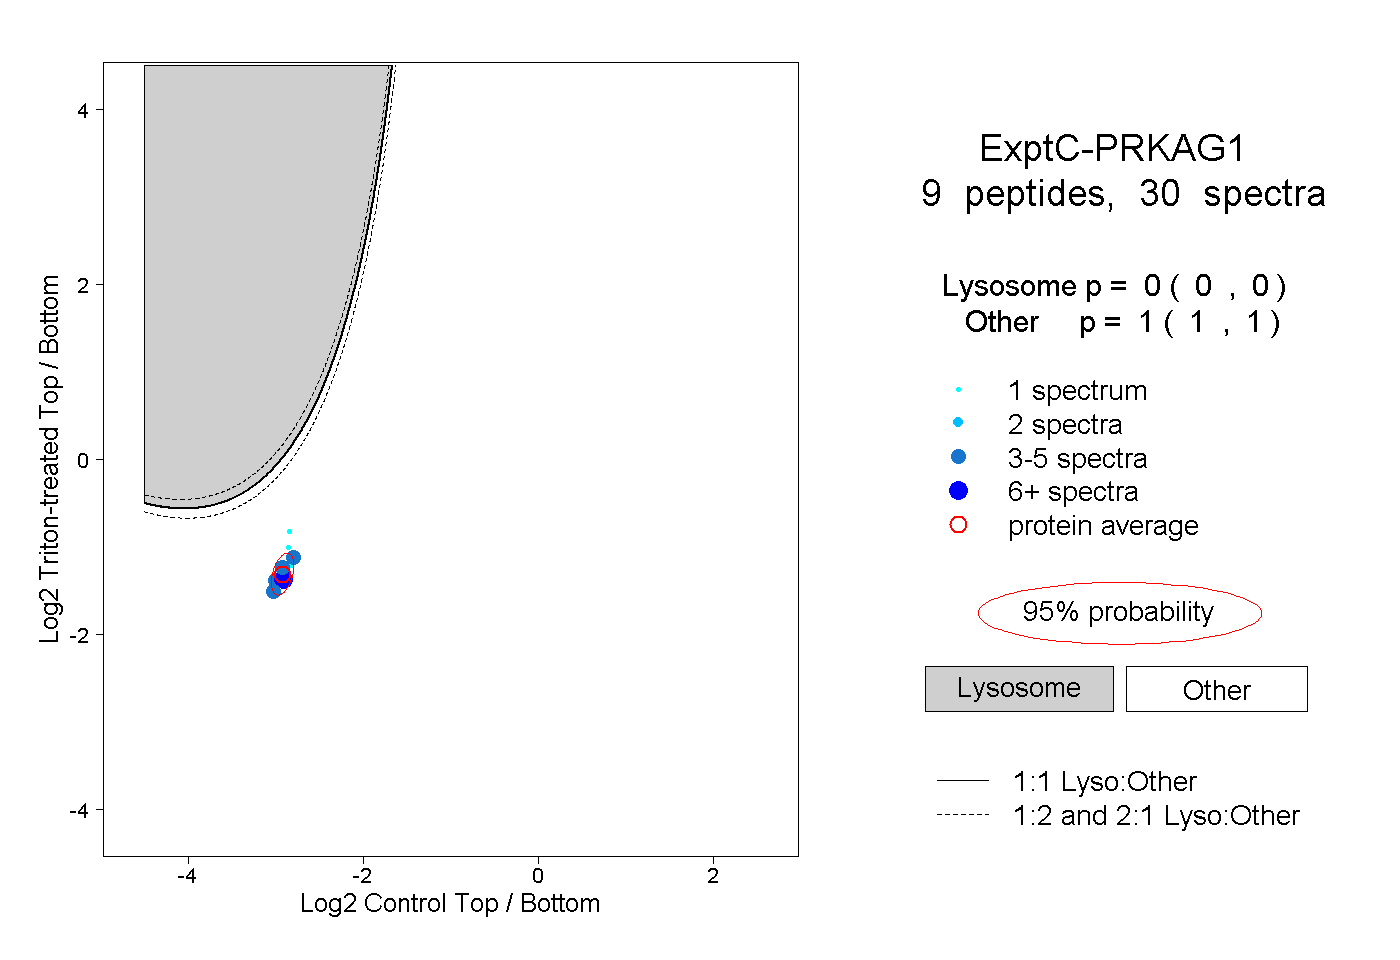
0.000 | 0.000
1.000 | 1.000