 12
12peptides
spectra
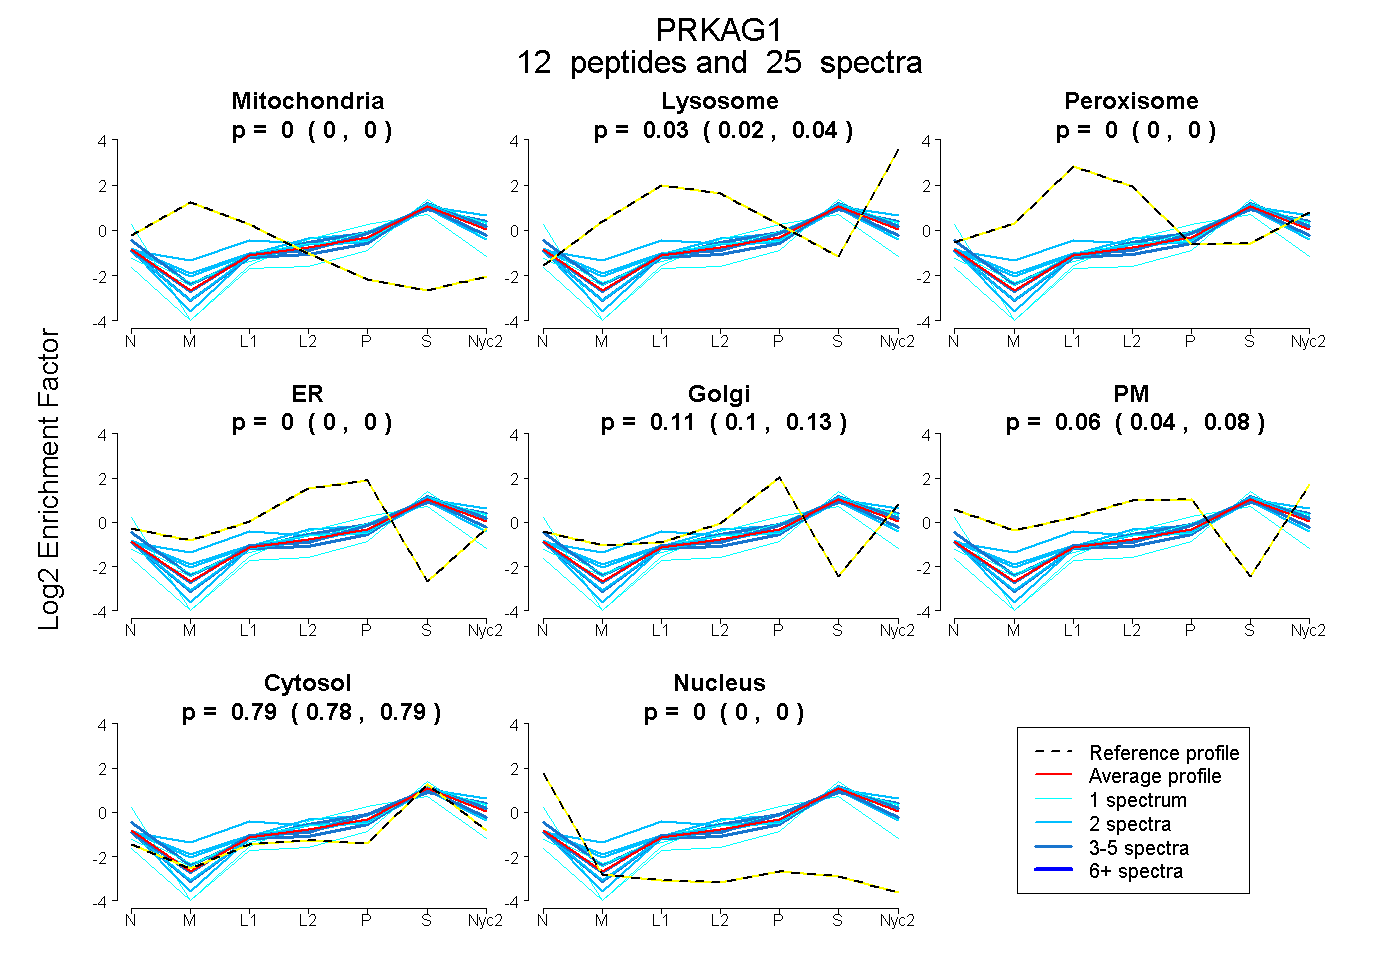
0.000 | 0.000
0.022 | 0.044
0.000 | 0.000
0.000 | 0.000
0.095 | 0.128
0.042 | 0.084
0.783 | 0.795
0.000 | 0.000
| Plot | Mito | Lyso | Perox | ER | Golgi | PM | Cytosol | Nucleus | |||||
| Expt A |
12 peptides |
25 spectra |
|
0.000 0.000 | 0.000 |
0.034 0.022 | 0.044 |
0.000 0.000 | 0.000 |
0.000 0.000 | 0.000 |
0.112 0.095 | 0.128 |
0.065 0.042 | 0.084 |
0.789 0.783 | 0.795 |
0.000 0.000 | 0.000 |
| 2 spectra, CYDLIPTSSK | 0.000 | 0.000 | 0.232 | 0.000 | 0.093 | 0.000 | 0.675 | 0.000 | ||
| 2 spectra, LVVVDEHDVVK | 0.000 | 0.025 | 0.000 | 0.000 | 0.107 | 0.034 | 0.834 | 0.000 | ||
| 2 spectra, VSALPVVDEK | 0.000 | 0.029 | 0.000 | 0.000 | 0.149 | 0.000 | 0.822 | 0.000 | ||
| 3 spectra, FDVINLAAEK | 0.000 | 0.005 | 0.000 | 0.000 | 0.046 | 0.236 | 0.714 | 0.000 | ||
| 1 spectrum, TYNNLDVSVTK | 0.000 | 0.150 | 0.000 | 0.000 | 0.057 | 0.000 | 0.793 | 0.000 | ||
| 1 spectrum, LVVFDTSLQVK | 0.000 | 0.073 | 0.000 | 0.000 | 0.193 | 0.000 | 0.734 | 0.000 | ||
| 1 spectrum, CYLHETLEAIINR | 0.000 | 0.000 | 0.000 | 0.206 | 0.000 | 0.000 | 0.698 | 0.096 | ||
| 2 spectra, AFFALVTNGVR | 0.000 | 0.164 | 0.000 | 0.000 | 0.110 | 0.039 | 0.687 | 0.000 | ||
| 2 spectra, AAPLWDSK | 0.000 | 0.080 | 0.000 | 0.000 | 0.026 | 0.132 | 0.762 | 0.000 | ||
| 1 spectrum, LPVIDPESGNTLYILTHK | 0.000 | 0.000 | 0.000 | 0.000 | 0.000 | 0.000 | 1.000 | 0.000 | ||
| 5 spectra, VVDIYSK | 0.000 | 0.012 | 0.000 | 0.000 | 0.206 | 0.000 | 0.783 | 0.000 | ||
| 3 spectra, SLEELQIGTYANIAMVR | 0.000 | 0.038 | 0.000 | 0.000 | 0.103 | 0.006 | 0.853 | 0.000 |
| Plot | Mito | Lyso or Perox | ER | Golgi | PM | Cytosol | Nucleus | ||||||
| Expt B |
4 peptides |
6 spectra |
 |
0.000 0.000 | 0.000 |
0.062 0.007 | 0.104 |
0.000 0.000 | 0.000 |
0.081 0.009 | 0.140 |
0.118 0.026 | 0.193 |
0.739 0.712 | 0.762 |
0.000 0.000 | 0.000 |
|||
| Plot | Lyso | Other | |||||||||||
| Expt C |
9 peptides |
30 spectra |
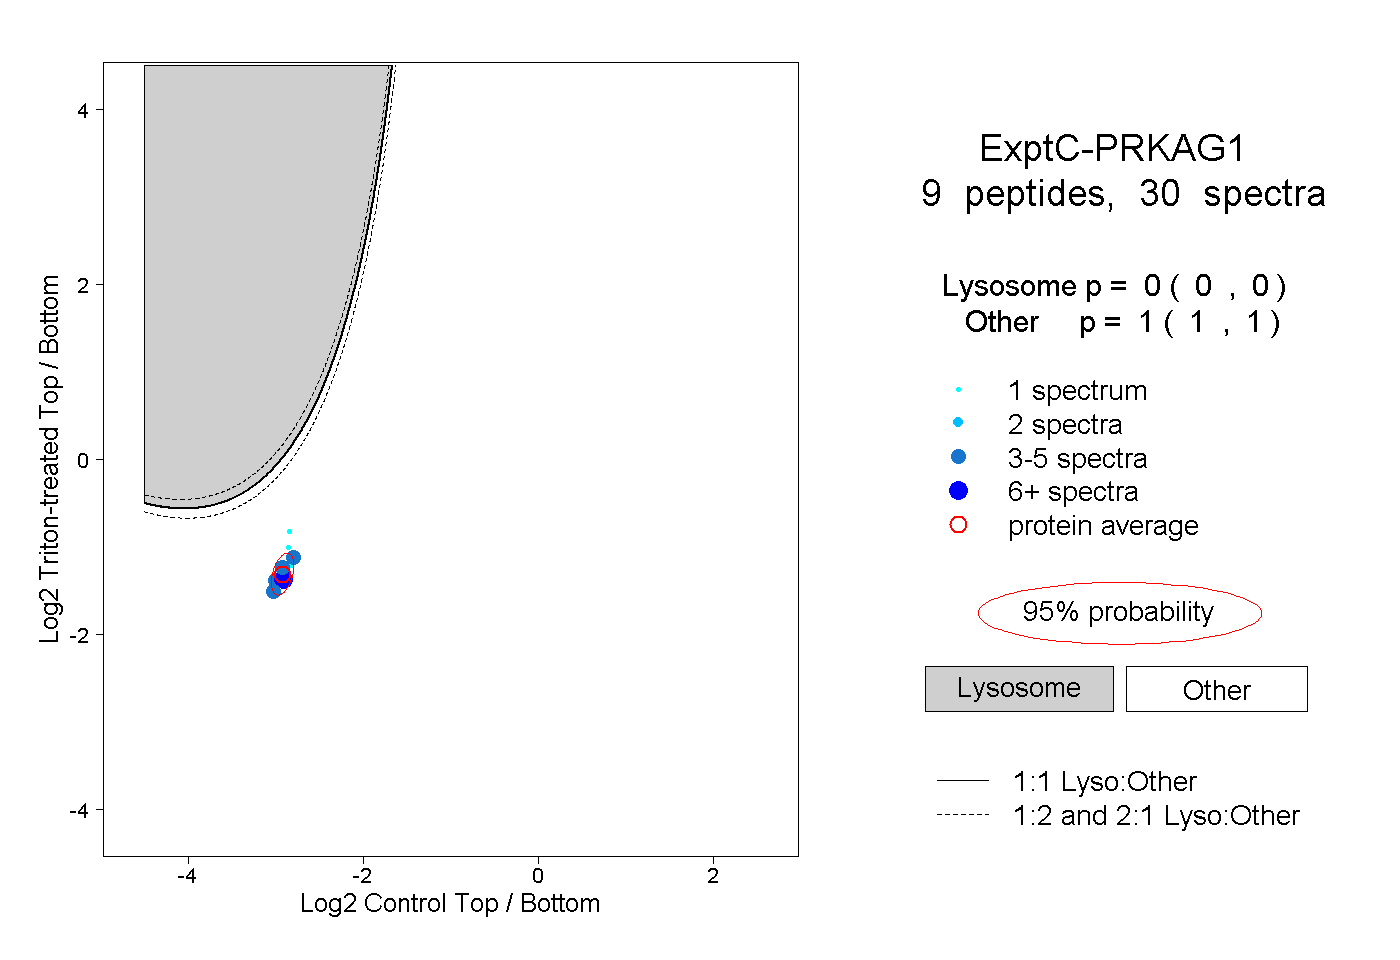 |
0.000 0.000 | 0.000 |
1.000 1.000 | 1.000 |