PRKAG1
[ENSRNOP00000020093]
Main page
| | | Plot |
Mito |
Lyso |
|
Perox |
ER |
Golgi |
PM |
Cytosol |
Nucleus |
|
| Expt A |
 12
12
peptides |
25
spectra |
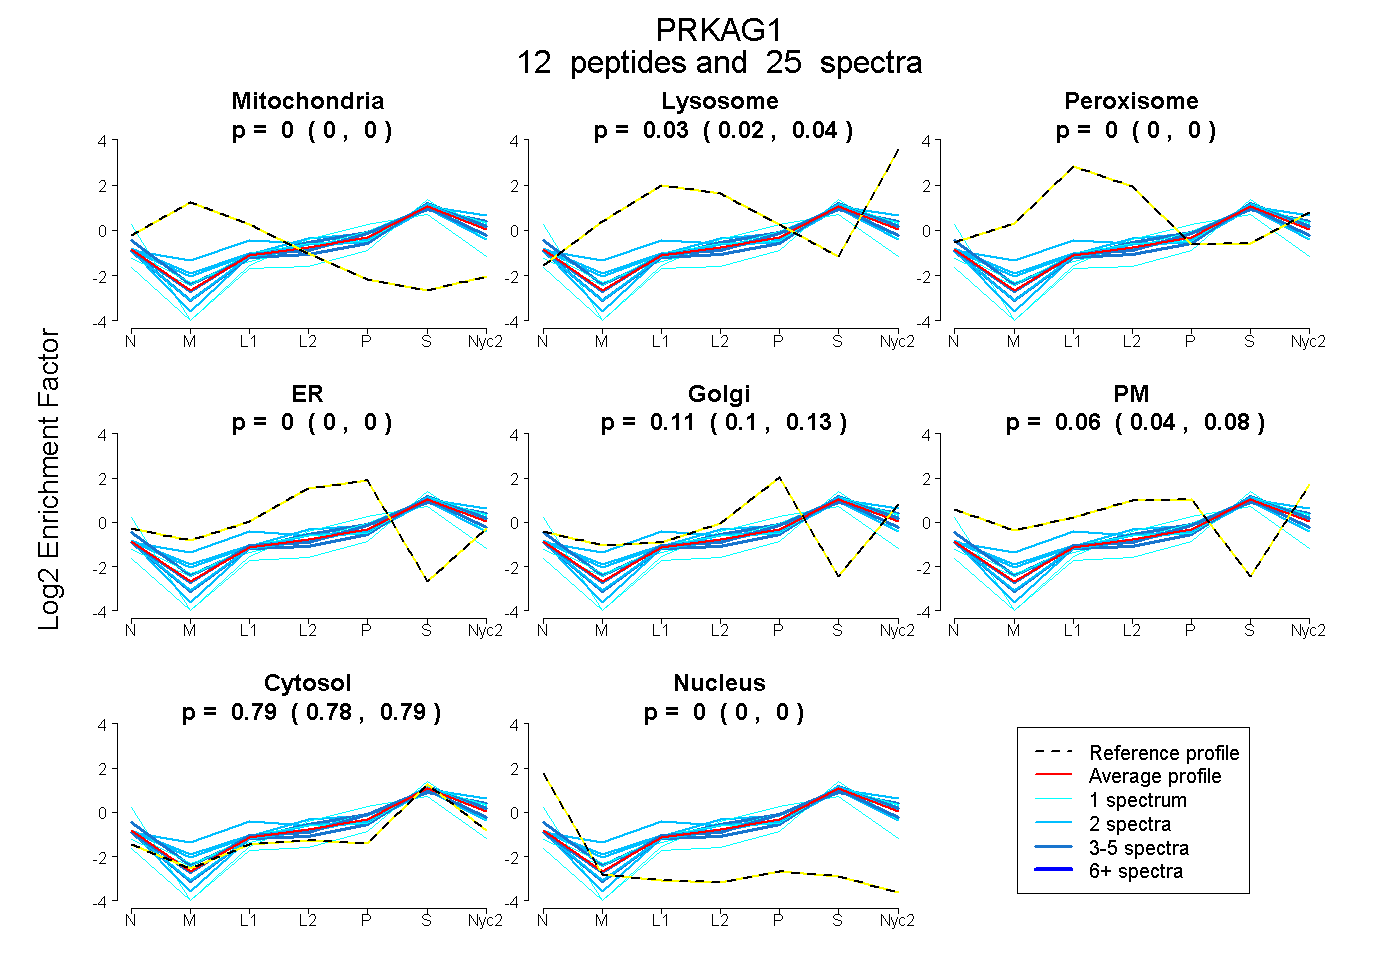 |
0.000
0.000 | 0.000 |
0.034
0.022 | 0.044 |
|
0.000
0.000 | 0.000 |
0.000
0.000 | 0.000 |
0.112
0.095 | 0.128 |
0.065
0.042 | 0.084 |
0.789
0.783 | 0.795 |
0.000
0.000 | 0.000 |
|
| | | Plot |
Mito |
|
Lyso or Perox |
|
ER |
Golgi |
PM |
Cytosol |
Nucleus |
|
| Expt B |
4
peptides |
6
spectra |
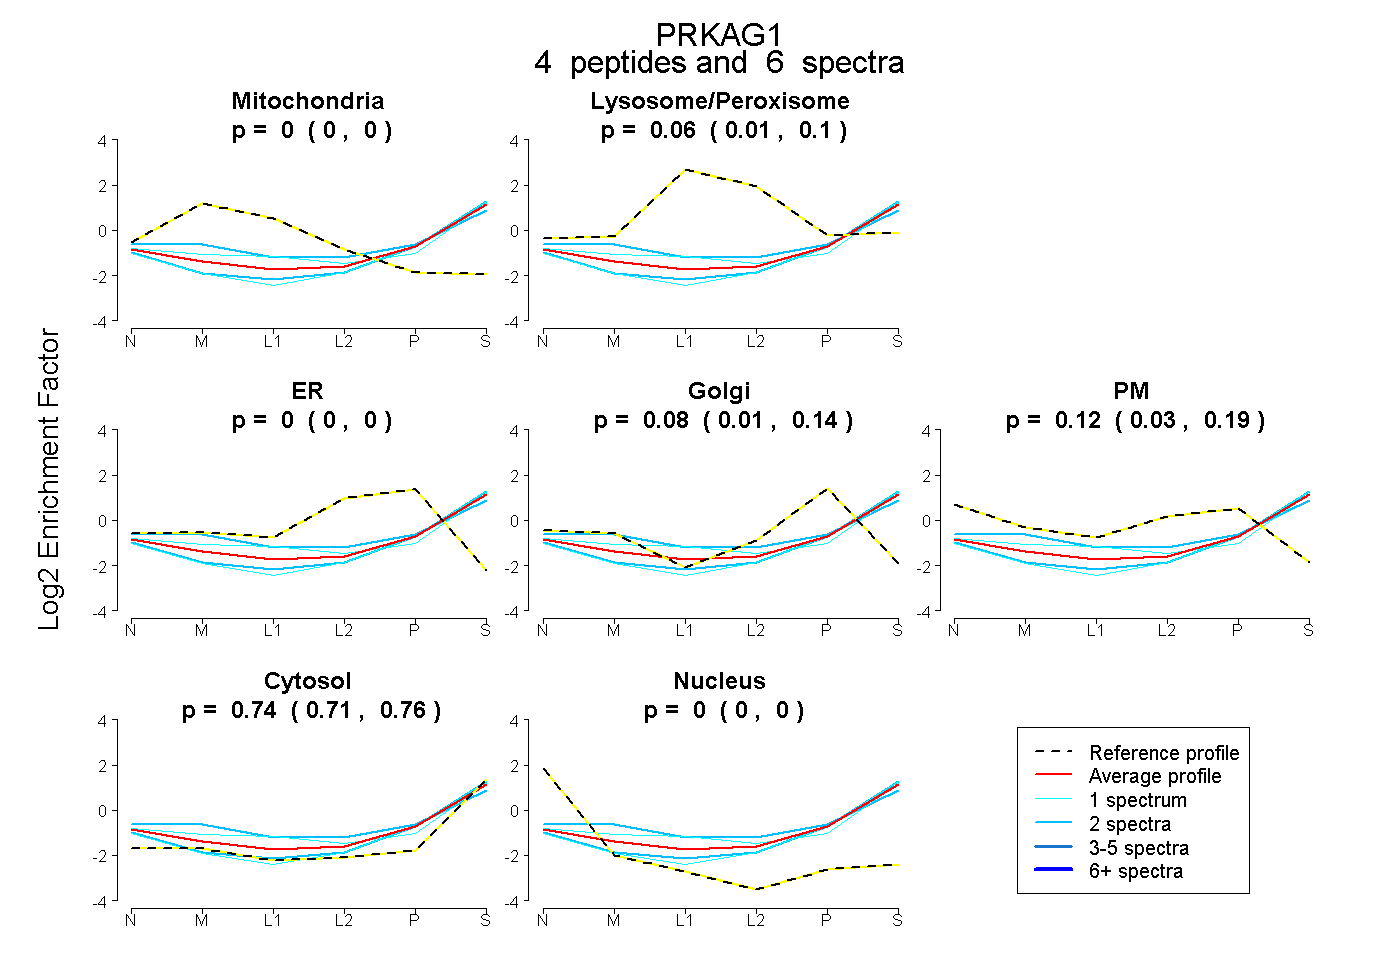 |
0.000
0.000 | 0.000 |
|
0.062
0.007 | 0.104 |
|
0.000
0.000 | 0.000 |
0.081
0.009 | 0.140 |
0.118
0.026 | 0.193 |
0.739
0.712 | 0.762 |
0.000
0.000 | 0.000 |
|
| 1 spectrum, LVVVDEHDVVK |
0.000 |
|
0.000 |
|
0.000 |
0.177 |
0.000 |
0.823 |
0.000 |
|
| 1 spectrum, VSALPVVDEK |
0.000 |
|
0.164 |
|
0.000 |
0.000 |
0.110 |
0.724 |
0.002 |
|
| 2 spectra, LVEAEVHR |
0.000 |
|
0.137 |
|
0.000 |
0.020 |
0.236 |
0.607 |
0.000 |
|
| 2 spectra, AFFALVTNGVR |
0.000 |
|
0.003 |
|
0.000 |
0.168 |
0.014 |
0.815 |
0.000 |
|
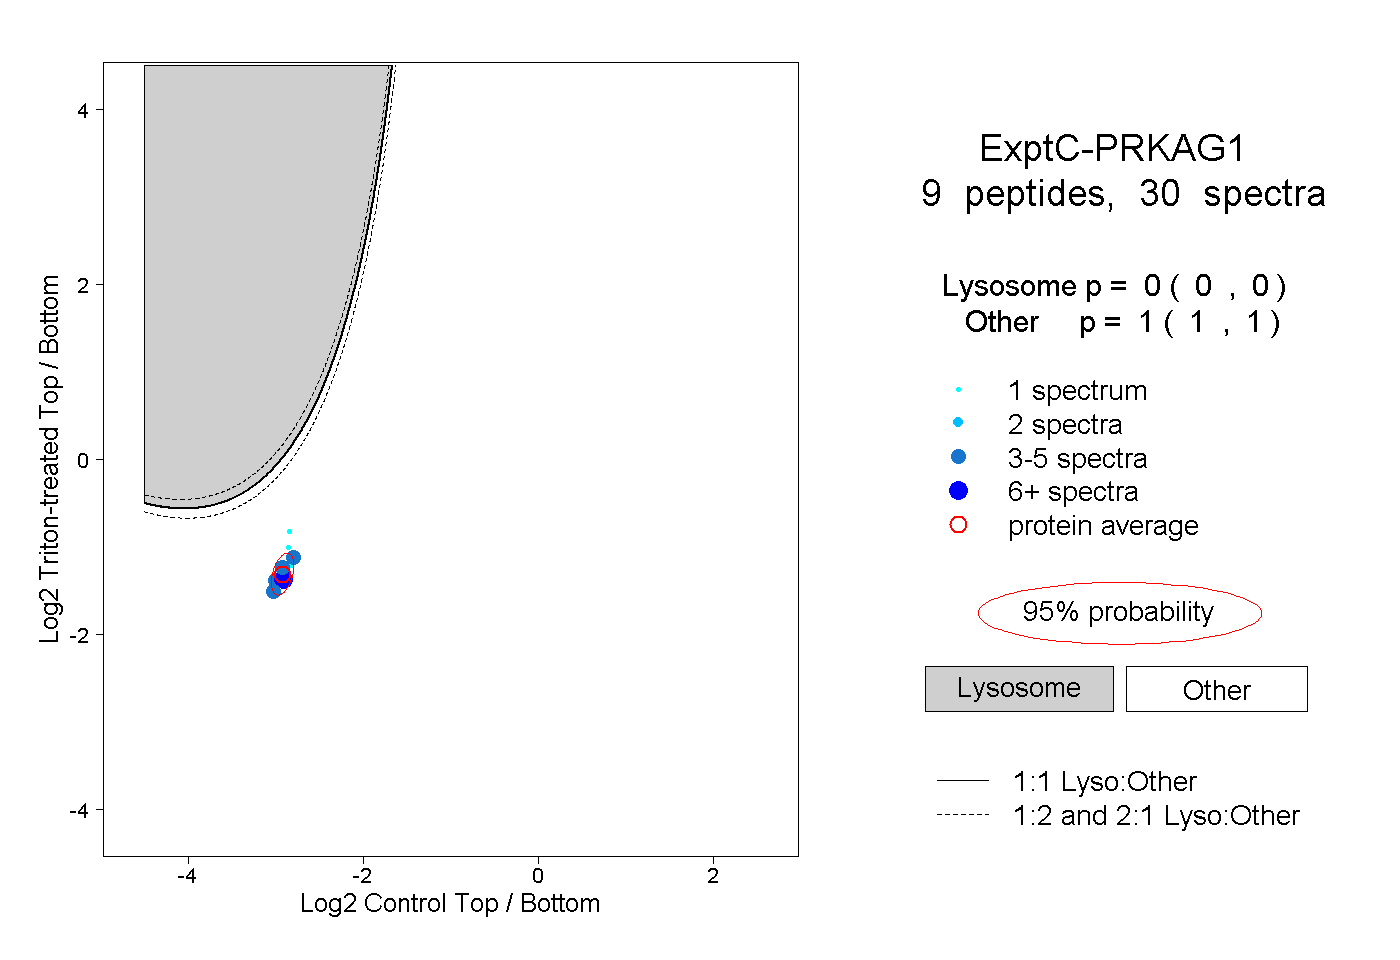
| | | Plot |
|
Lyso |
|
|
|
|
|
|
|
Other |
| Expt C |
9
peptides |
30
spectra |
 |
|
0.000
0.000 | 0.000 |
|
|
|
|
|
|
|
1.000
1.000 | 1.000 |