 5
5peptides
spectra
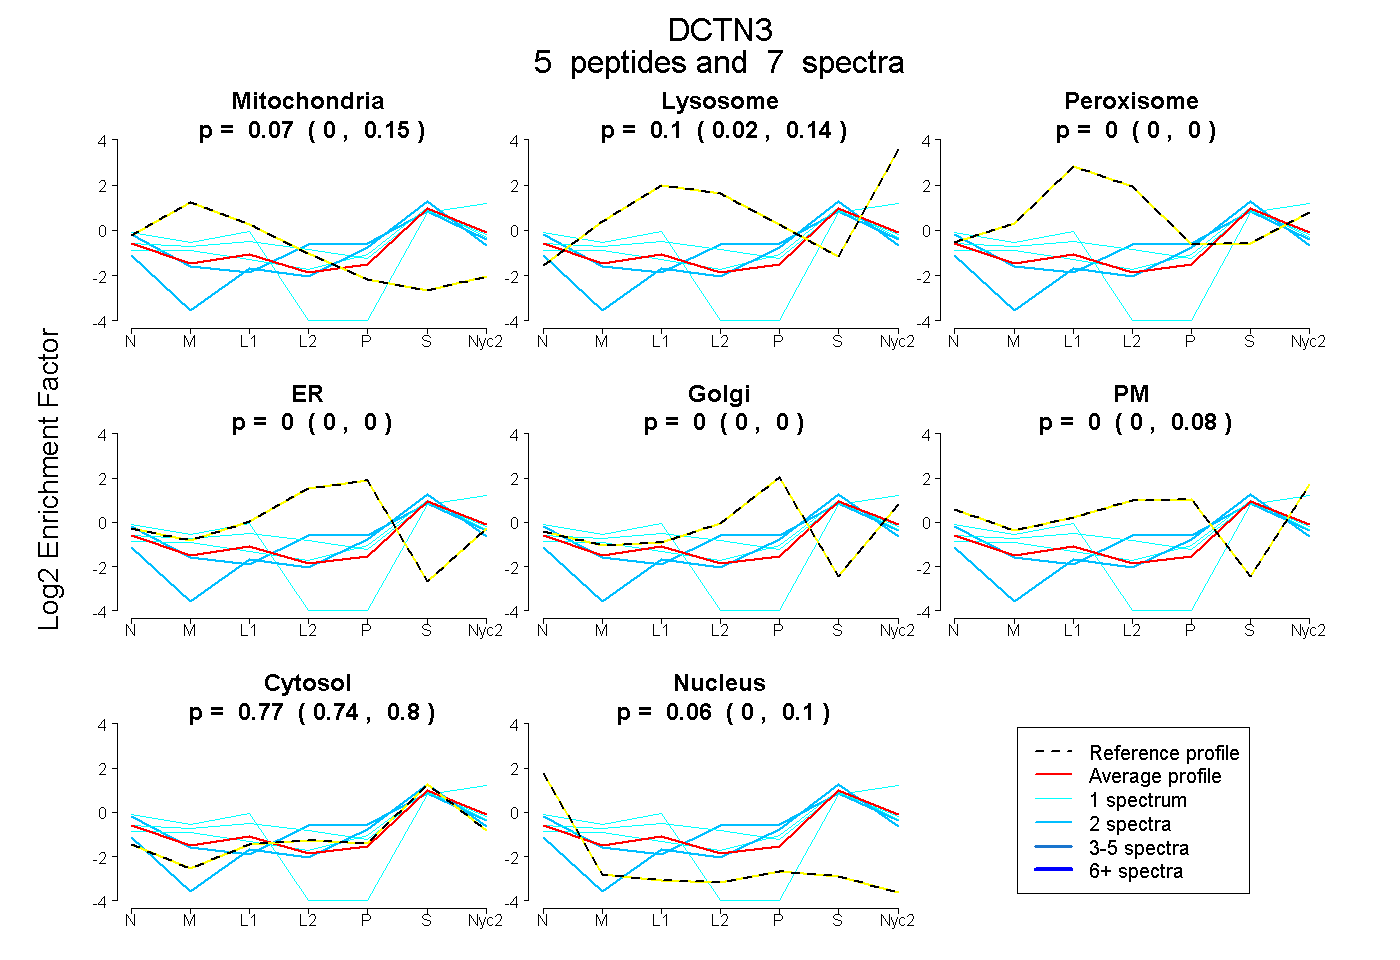
0.000 | 0.153
0.020 | 0.139
0.000 | 0.000
0.000 | 0.000
0.000 | 0.000
0.000 | 0.080
0.738 | 0.799
0.000 | 0.099
2peptides
spectra
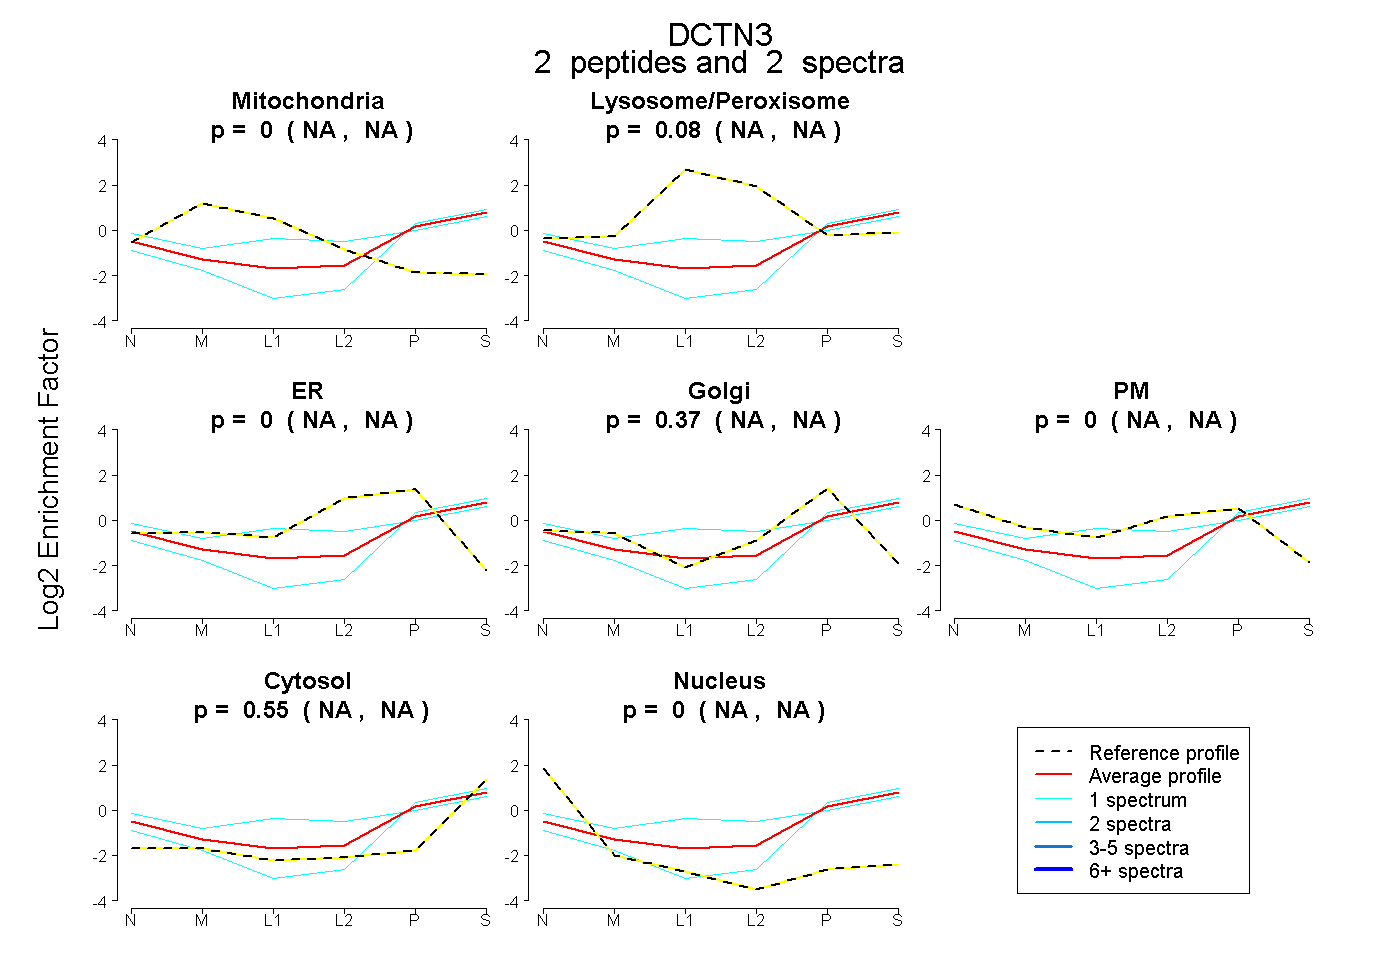
NA | NA
NA | NA
NA | NA
NA | NA
NA | NA
NA | NA
NA | NA
7peptides
spectra
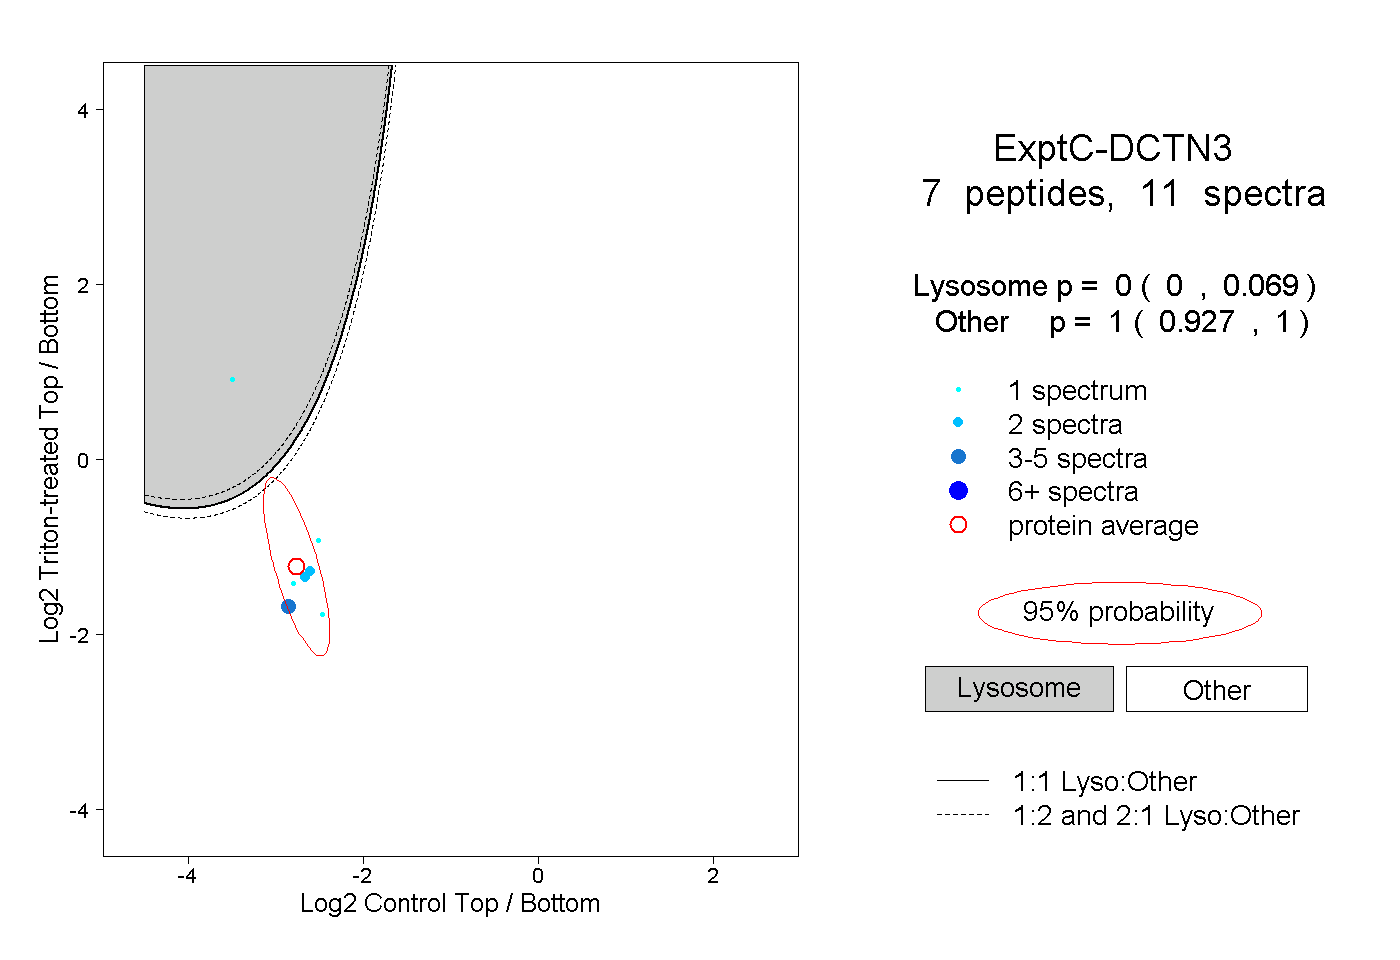
0.000 | 0.069
0.927 | 1.000