DCTN3
[ENSRNOP00000019561]
Main page
| | | Plot |
Mito |
Lyso |
|
Perox |
ER |
Golgi |
PM |
Cytosol |
Nucleus |
|
| Expt A |
 5
5
peptides |
7
spectra |
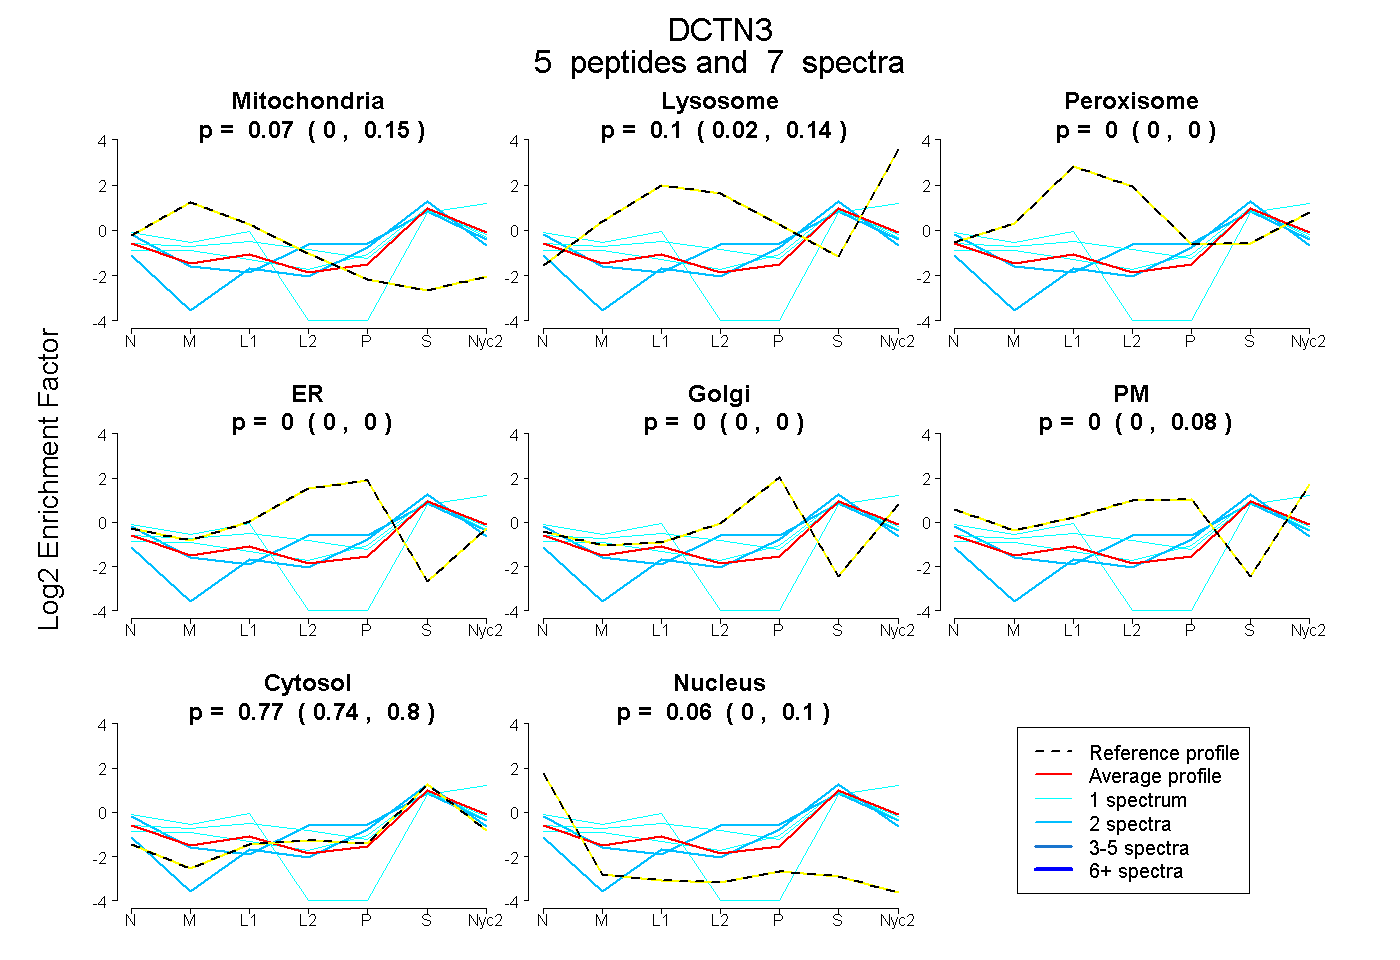 |
0.074
0.000 | 0.153 |
0.101
0.020 | 0.139 |
|
0.000
0.000 | 0.000 |
0.000
0.000 | 0.000 |
0.000
0.000 | 0.000 |
0.000
0.000 | 0.080 |
0.770
0.738 | 0.799 |
0.055
0.000 | 0.099 |
|
| | | Plot |
Mito |
|
Lyso or Perox |
|
ER |
Golgi |
PM |
Cytosol |
Nucleus |
|
| Expt B |
2
peptides |
2
spectra |
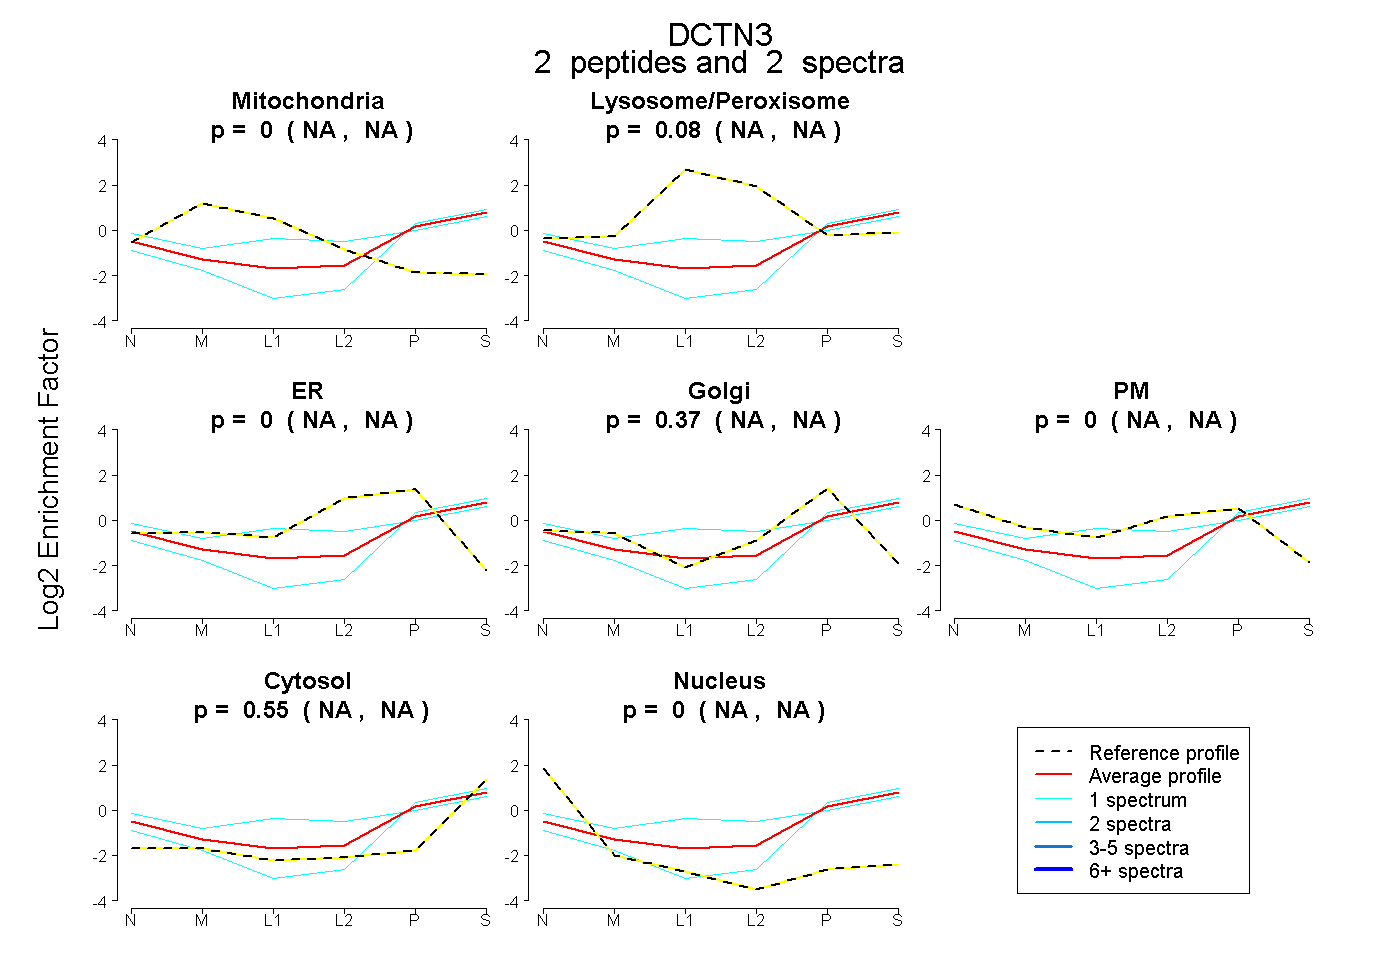 |
0.000
NA | NA |
|
0.082
NA | NA |
|
0.000
NA | NA |
0.366
NA | NA |
0.001
NA | NA |
0.551
NA | NA |
0.000
NA | NA |
|
| | | Plot |
|
Lyso |
|
|
|
|
|
|
|
Other |
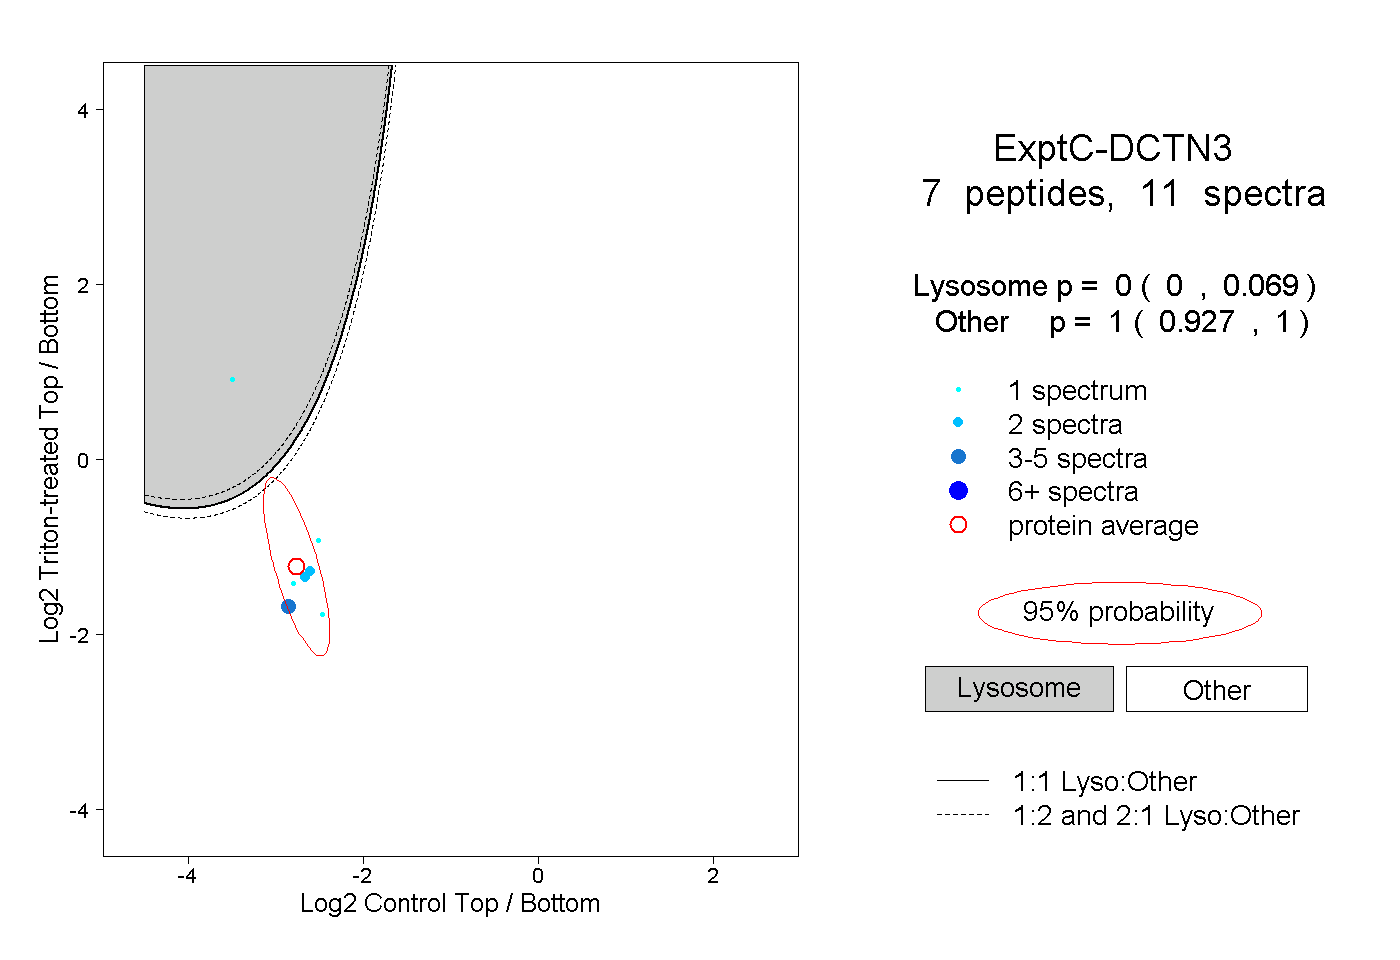
| Expt C |
7
peptides |
11
spectra |
 |
|
0.000
0.000 | 0.069 |
|
|
|
|
|
|
|
1.000
0.927 | 1.000 |
| 2 spectra, YLDPEYIDR |
|
0.000 |
|
|
|
|
|
|
|
1.000 |
| 1 spectrum, AVPEHAAR |
|
1.000 |
|
|
|
|
|
|
|
0.000 |
| 1 spectrum, VADGLVK |
|
0.000 |
|
|
|
|
|
|
|
1.000 |
| 1 spectrum, TTMLLSK |
|
0.000 |
|
|
|
|
|
|
|
1.000 |
| 2 spectra, ALLEEYNK |
|
0.000 |
|
|
|
|
|
|
|
1.000 |
| 3 spectra, IAIPEASK |
|
0.000 |
|
|
|
|
|
|
|
1.000 |
| 1 spectrum, WVYGPGGTR |
|
0.000 |
|
|
|
|
|
|
|
1.000 |