 5
5peptides
spectra
0.000 | 0.153
0.020 | 0.139
0.000 | 0.000
0.000 | 0.000
0.000 | 0.000
0.000 | 0.080
0.738 | 0.799
0.000 | 0.099
| Plot | Mito | Lyso | Perox | ER | Golgi | PM | Cytosol | Nucleus | |||||
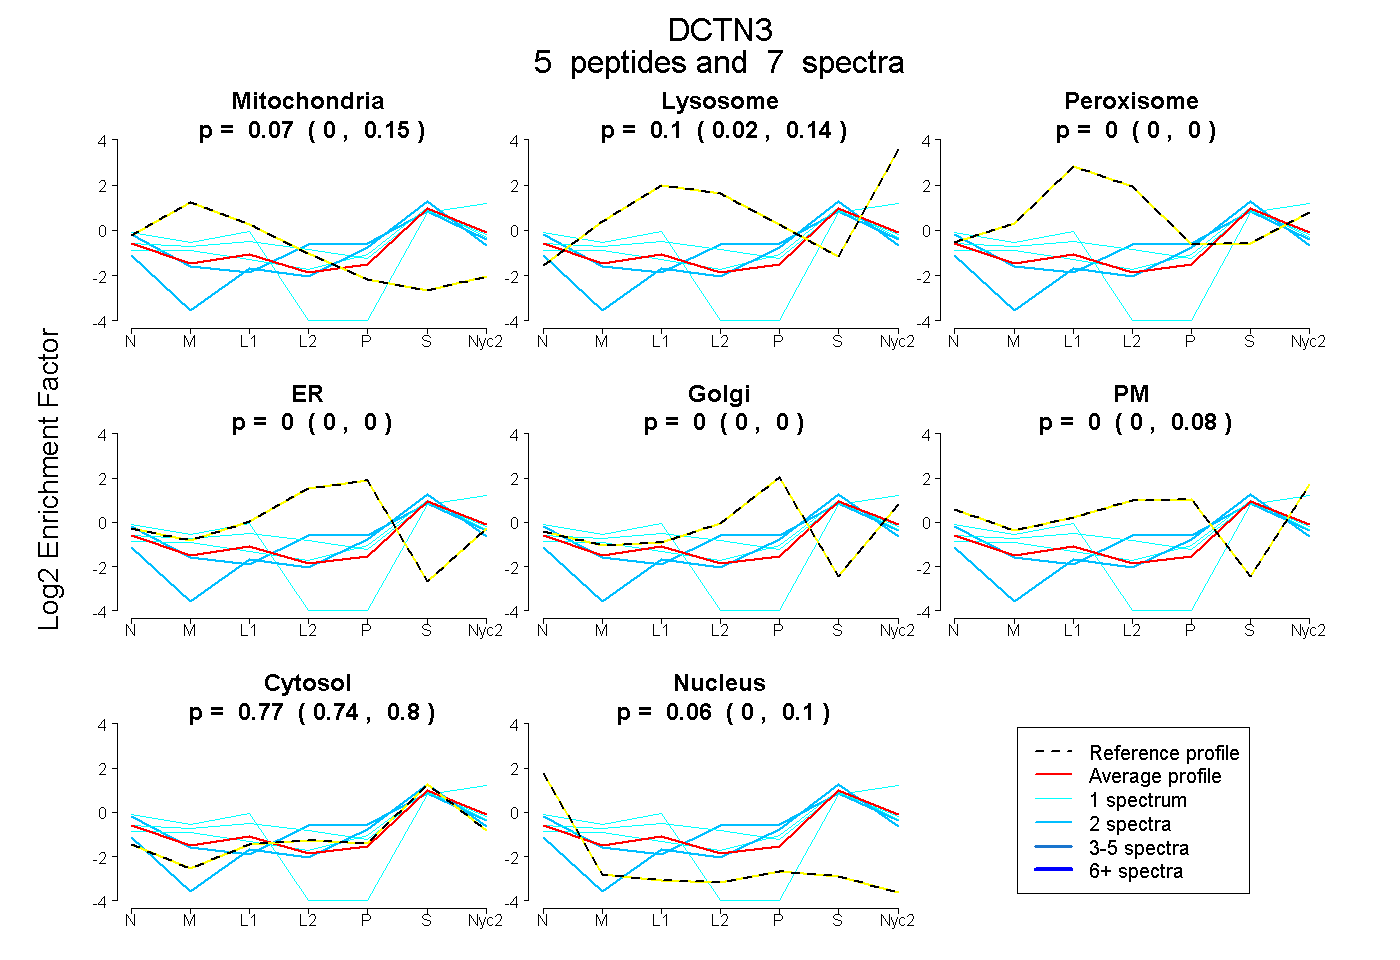
| Expt A |
5 peptides |
7 spectra |
|
0.074 0.000 | 0.153 |
0.101 0.020 | 0.139 |
0.000 0.000 | 0.000 |
0.000 0.000 | 0.000 |
0.000 0.000 | 0.000 |
0.000 0.000 | 0.080 |
0.770 0.738 | 0.799 |
0.055 0.000 | 0.099 |
| 2 spectra, YLDPEYIDR | 0.000 | 0.000 | 0.000 | 0.000 | 0.000 | 0.000 | 0.961 | 0.039 | ||
| 2 spectra, AVPEHAAR | 0.000 | 0.000 | 0.000 | 0.000 | 0.000 | 0.230 | 0.734 | 0.037 | ||
| 1 spectrum, LAQIHIQQQDQCVEITEESK | 0.325 | 0.029 | 0.000 | 0.000 | 0.000 | 0.000 | 0.647 | 0.000 | ||
| 1 spectrum, VQVALGNIASK | 0.144 | 0.081 | 0.136 | 0.000 | 0.000 | 0.000 | 0.638 | 0.000 | ||
| 1 spectrum, WVYGPGGTR | 0.151 | 0.061 | 0.000 | 0.000 | 0.028 | 0.000 | 0.761 | 0.000 |
| Plot | Mito | Lyso or Perox | ER | Golgi | PM | Cytosol | Nucleus | ||||||
| Expt B |
2 peptides |
2 spectra |
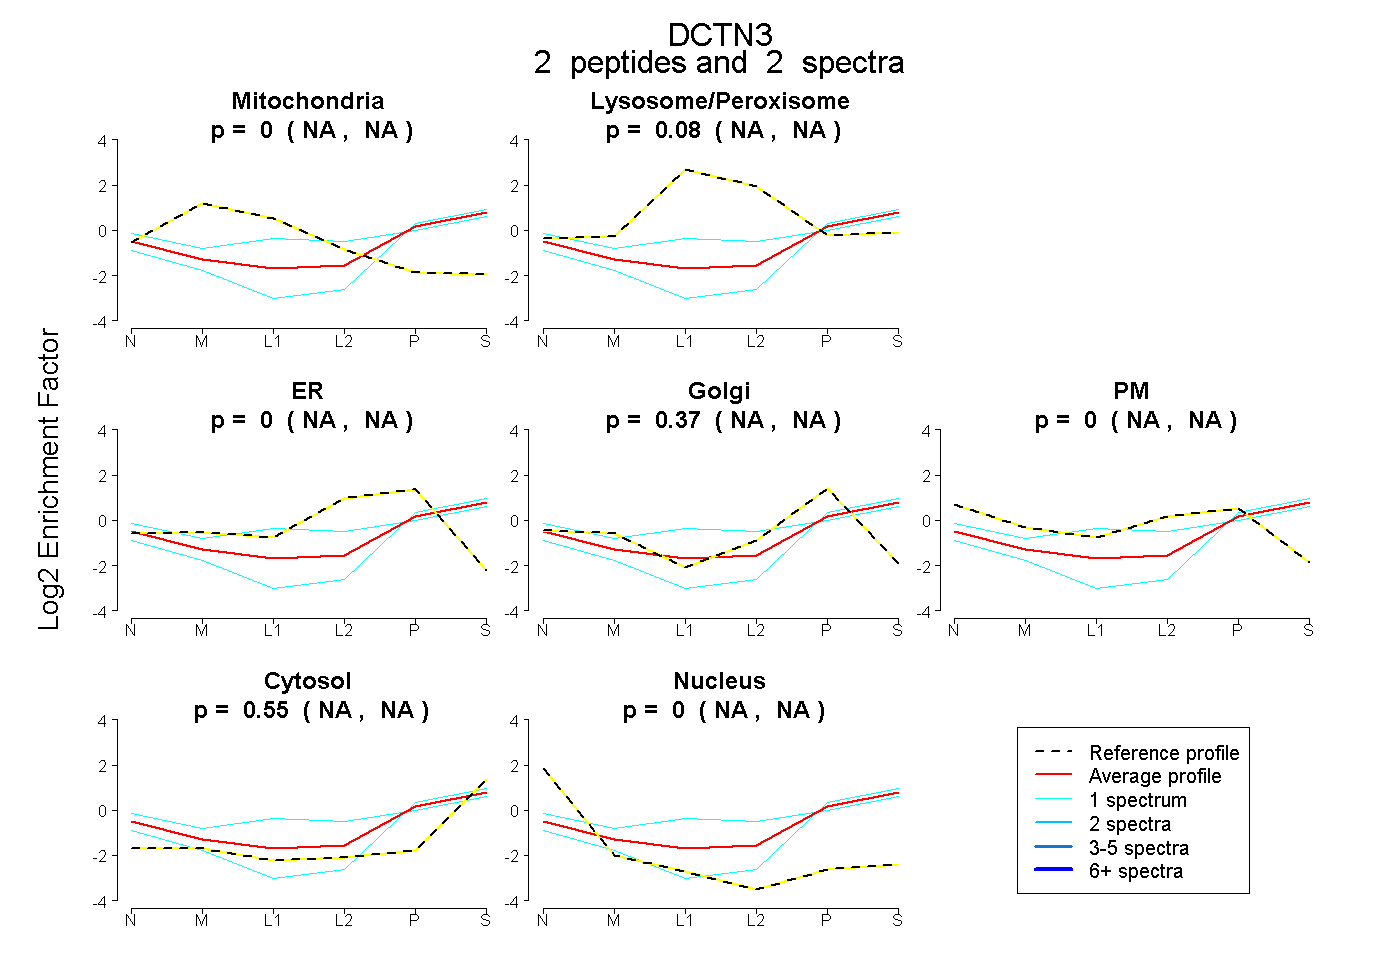 |
0.000 NA | NA |
0.082 NA | NA |
0.000 NA | NA |
0.366 NA | NA |
0.001 NA | NA |
0.551 NA | NA |
0.000 NA | NA |
|||
| Plot | Lyso | Other | |||||||||||
| Expt C |
7 peptides |
11 spectra |
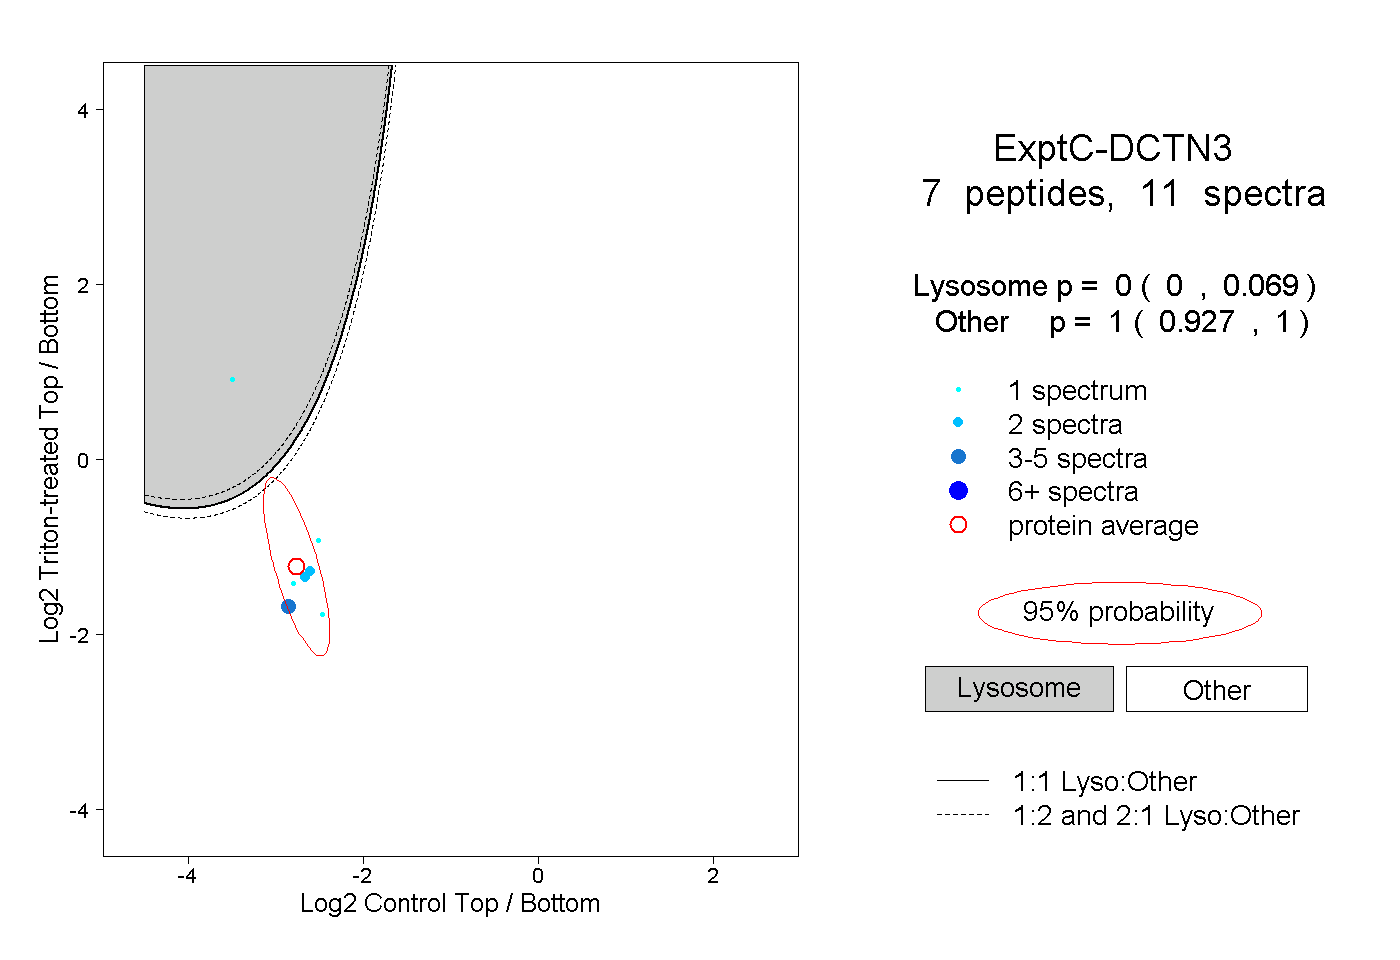 |
0.000 0.000 | 0.069 |
1.000 0.927 | 1.000 |