 12
12peptides
spectra
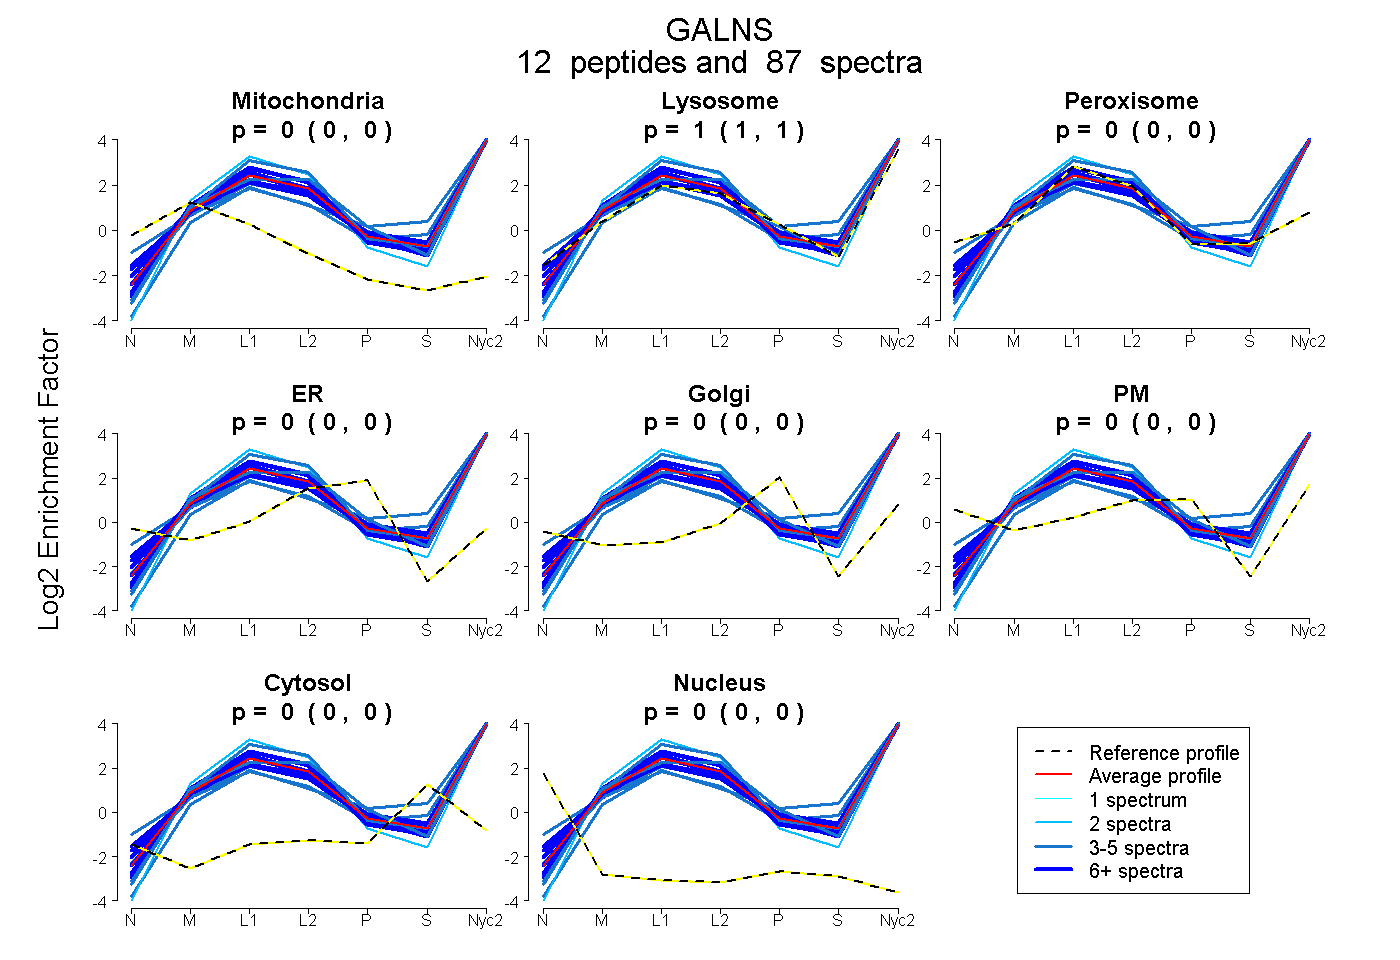
0.000 | 0.000
1.000 | 1.000
0.000 | 0.000
0.000 | 0.000
0.000 | 0.000
0.000 | 0.000
0.000 | 0.000
0.000 | 0.000
12peptides
spectra
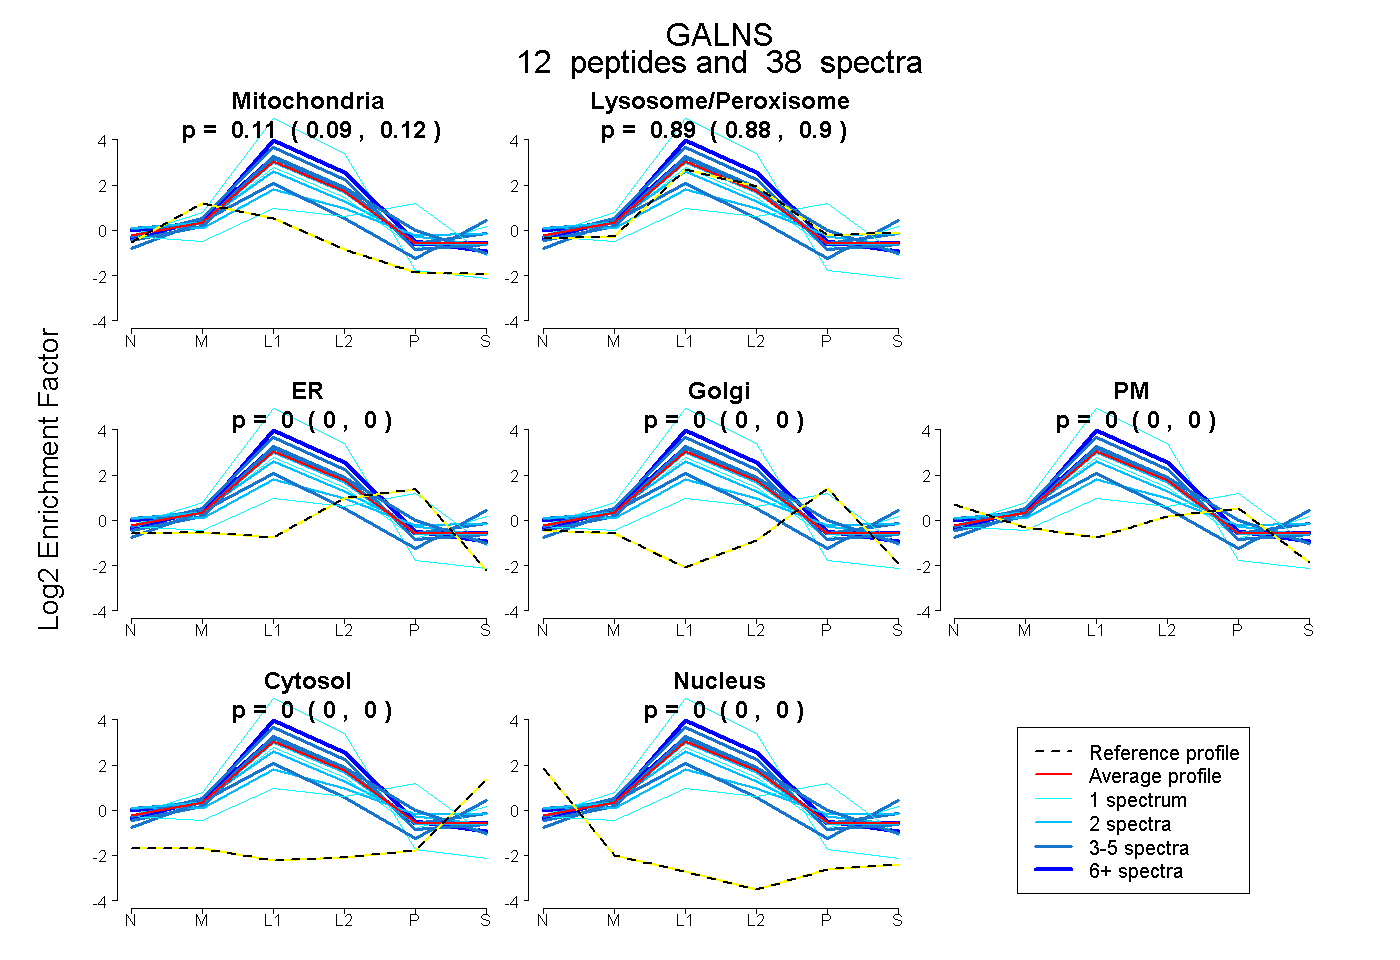
0.093 | 0.117
0.880 | 0.905
0.000 | 0.000
0.000 | 0.000
0.000 | 0.000
0.000 | 0.000
0.000 | 0.000
19peptides
spectra
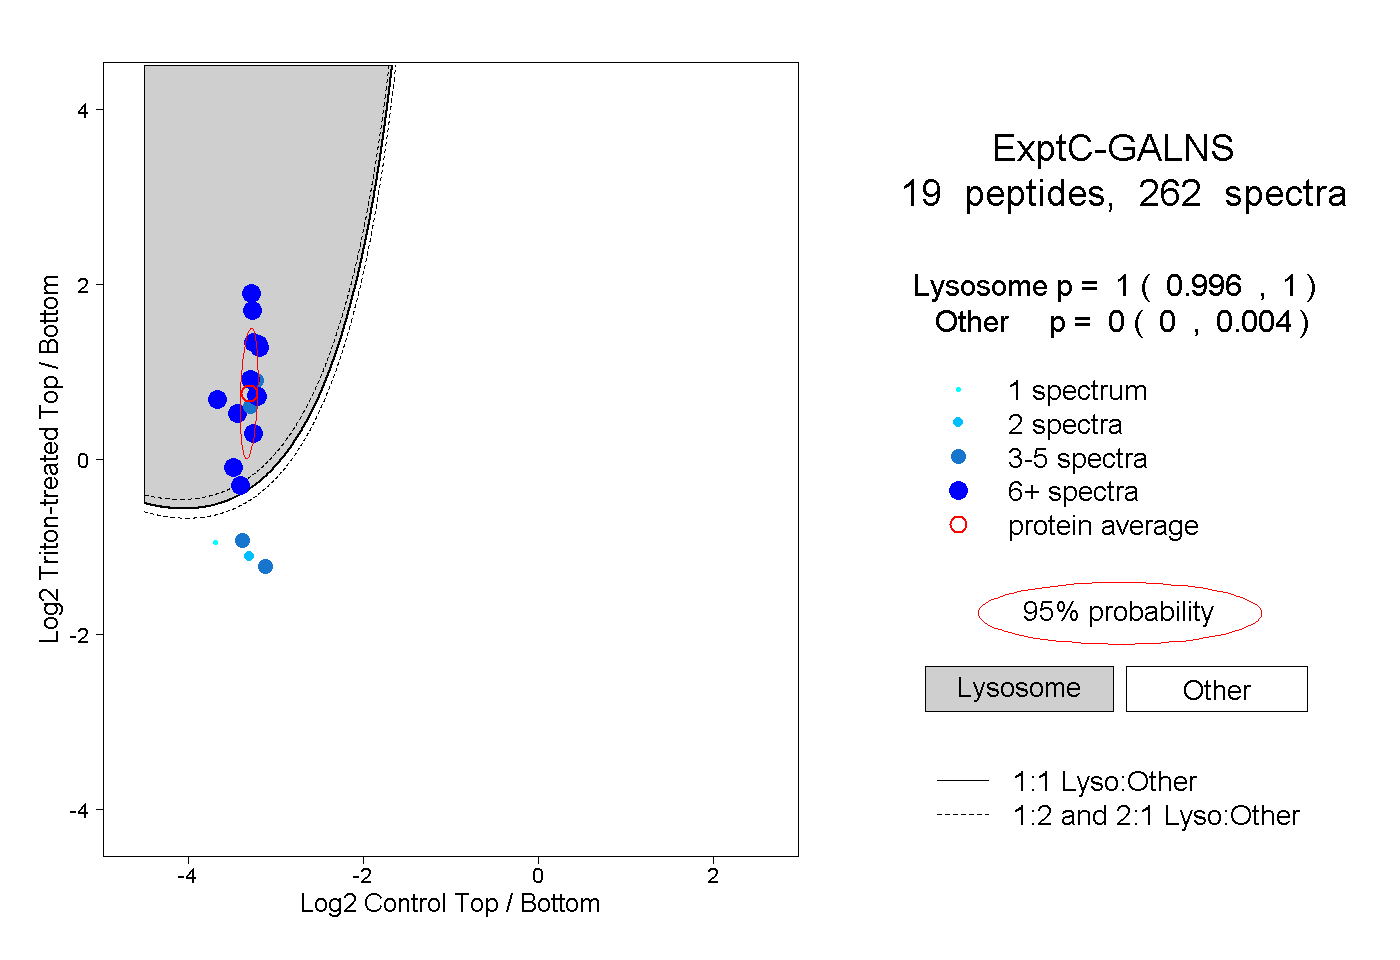
0.996 | 1.000
0.000 | 0.004
7peptides
spectra
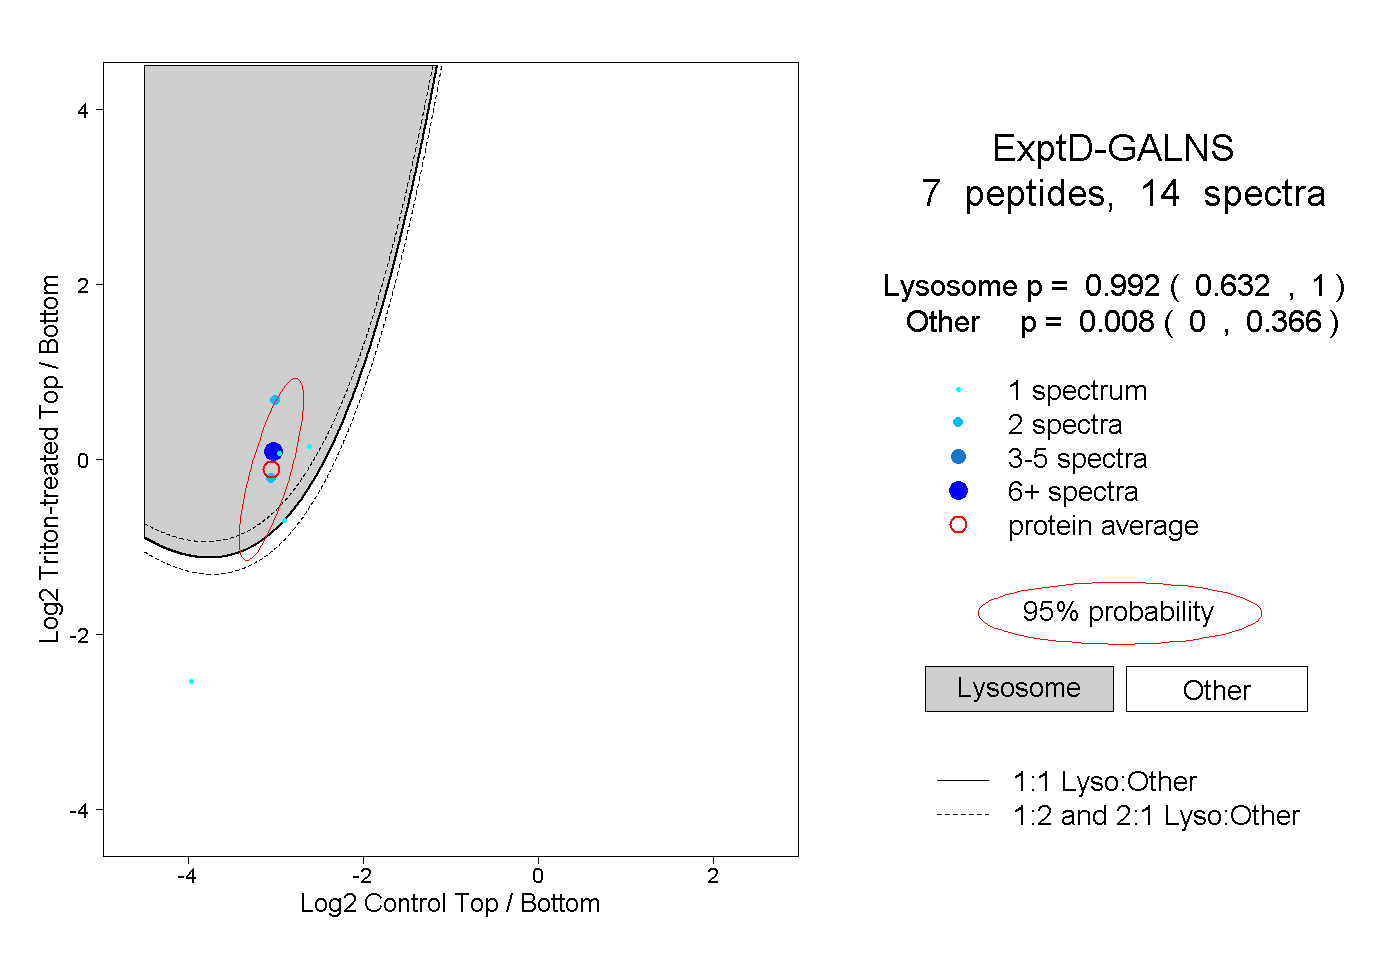
0.632 | 1.000
0.000 | 0.366