GALNS
[ENSRNOP00000019528]
Main page
| | | Plot |
Mito |
Lyso |
|
Perox |
ER |
Golgi |
PM |
Cytosol |
Nucleus |
|
| Expt A |
 12
12
peptides |
87
spectra |
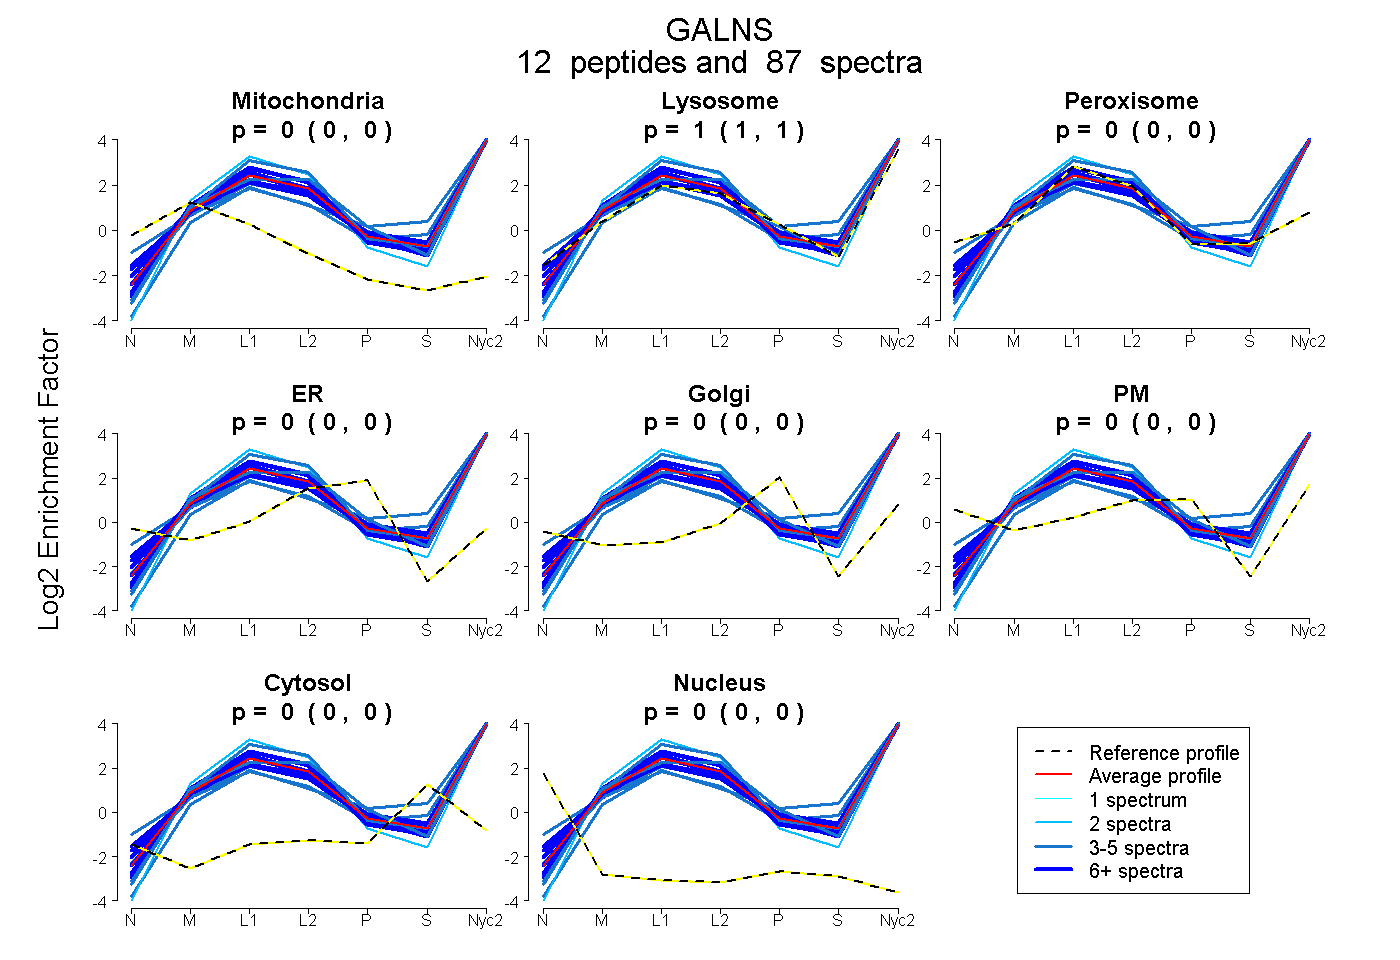 |
0.000
0.000 | 0.000 |
1.000
1.000 | 1.000 |
|
0.000
0.000 | 0.000 |
0.000
0.000 | 0.000 |
0.000
0.000 | 0.000 |
0.000
0.000 | 0.000 |
0.000
0.000 | 0.000 |
0.000
0.000 | 0.000 |
|
| | | Plot |
Mito |
|
Lyso or Perox |
|
ER |
Golgi |
PM |
Cytosol |
Nucleus |
|
| Expt B |
12
peptides |
38
spectra |
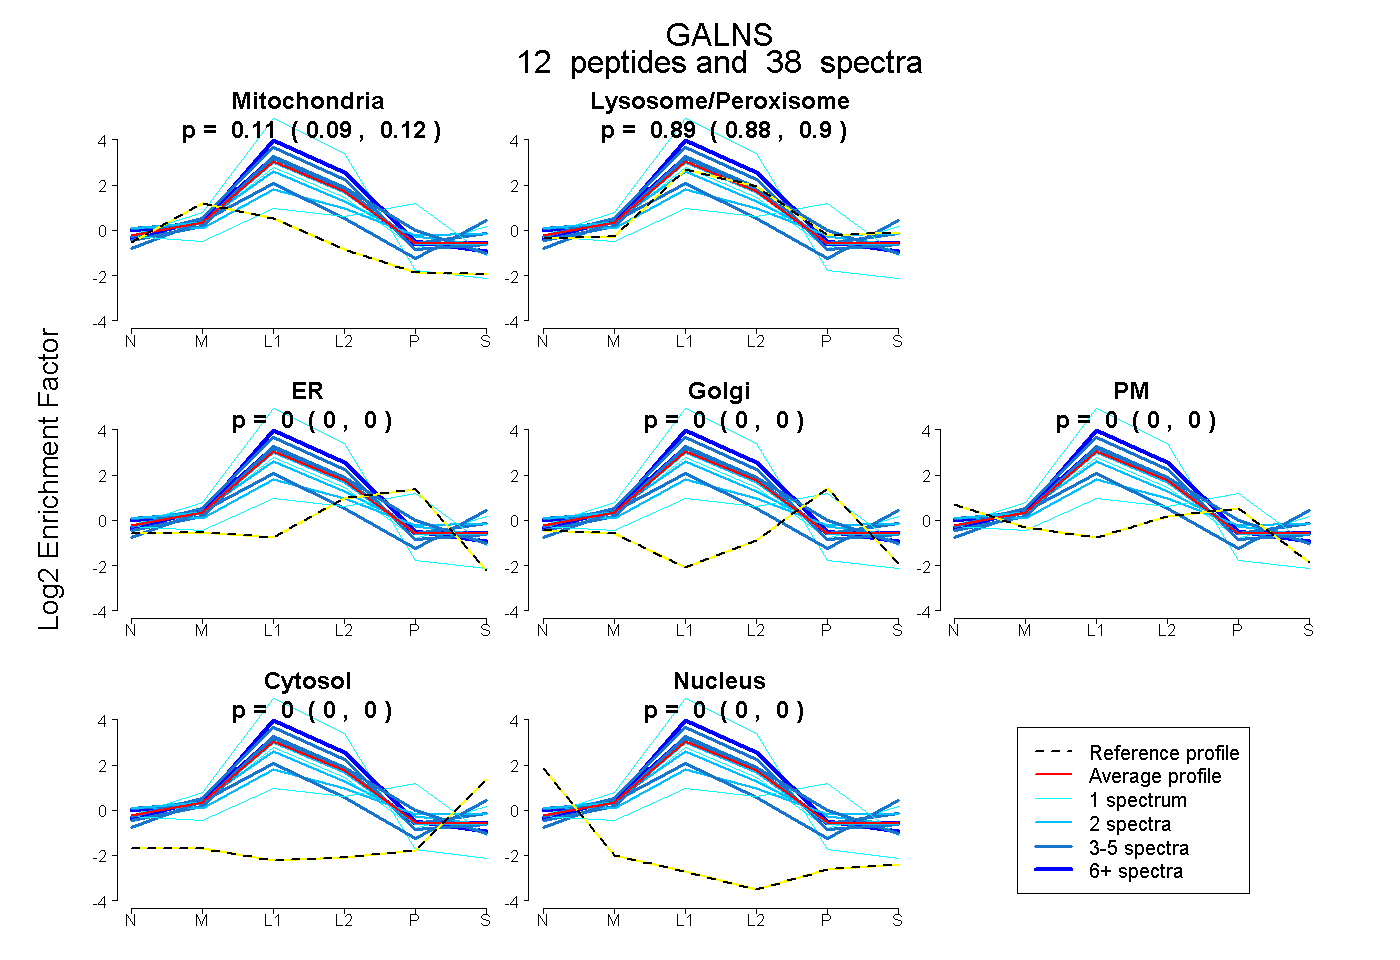 |
0.106
0.093 | 0.117 |
|
0.894
0.880 | 0.905 |
|
0.000
0.000 | 0.000 |
0.000
0.000 | 0.000 |
0.000
0.000 | 0.000 |
0.000
0.000 | 0.000 |
0.000
0.000 | 0.000 |
|
| 2 spectra, GNTLMAVTLGQYK |
0.096 |
|
0.704 |
|
0.000 |
0.000 |
0.148 |
0.048 |
0.004 |
|
| 2 spectra, EGGSNGPFLCGK |
0.198 |
|
0.800 |
|
0.000 |
0.000 |
0.002 |
0.000 |
0.000 |
|
| 1 spectrum, NGFYTTNAHAR |
0.000 |
|
0.507 |
|
0.175 |
0.318 |
0.000 |
0.000 |
0.000 |
|
| 4 spectra, QFLGTSLR |
0.010 |
|
0.990 |
|
0.000 |
0.000 |
0.000 |
0.000 |
0.000 |
|
| 9 spectra, AALLTGR |
0.088 |
|
0.912 |
|
0.000 |
0.000 |
0.000 |
0.000 |
0.000 |
|
| 1 spectrum, EIDDSVGK |
0.000 |
|
1.000 |
|
0.000 |
0.000 |
0.000 |
0.000 |
0.000 |
|
| 3 spectra, TTQVIQQHQK |
0.055 |
|
0.945 |
|
0.000 |
0.000 |
0.000 |
0.000 |
0.000 |
|
| 1 spectrum, AALLASR |
0.124 |
|
0.876 |
|
0.000 |
0.000 |
0.000 |
0.000 |
0.000 |
|
| 6 spectra, ETPNLDR |
0.000 |
|
1.000 |
|
0.000 |
0.000 |
0.000 |
0.000 |
0.000 |
|
| 4 spectra, FYEEFPINLK |
0.032 |
|
0.968 |
|
0.000 |
0.000 |
0.000 |
0.000 |
0.000 |
|
| 2 spectra, VKPNIPVYR |
0.122 |
|
0.878 |
|
0.000 |
0.000 |
0.000 |
0.000 |
0.000 |
|
| 3 spectra, ILSLLQNLGISK |
0.207 |
|
0.653 |
|
0.000 |
0.000 |
0.000 |
0.139 |
0.000 |
|
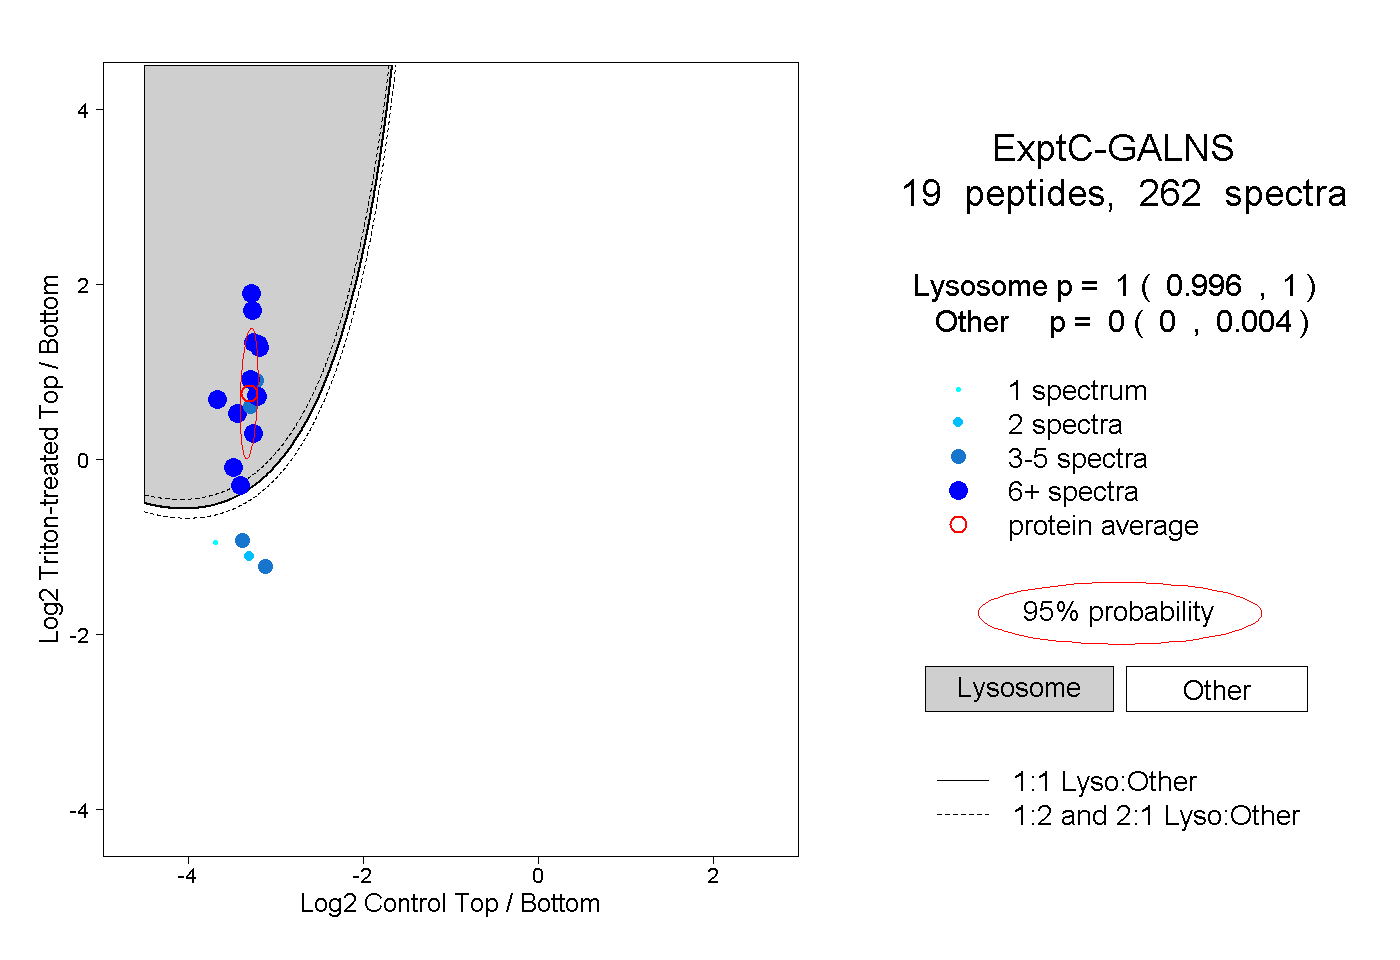
| | | Plot |
|
Lyso |
|
|
|
|
|
|
|
Other |
| Expt C |
19
peptides |
262
spectra |
 |
|
1.000
0.996 | 1.000 |
|
|
|
|
|
|
|
0.000
0.000 | 0.004 |
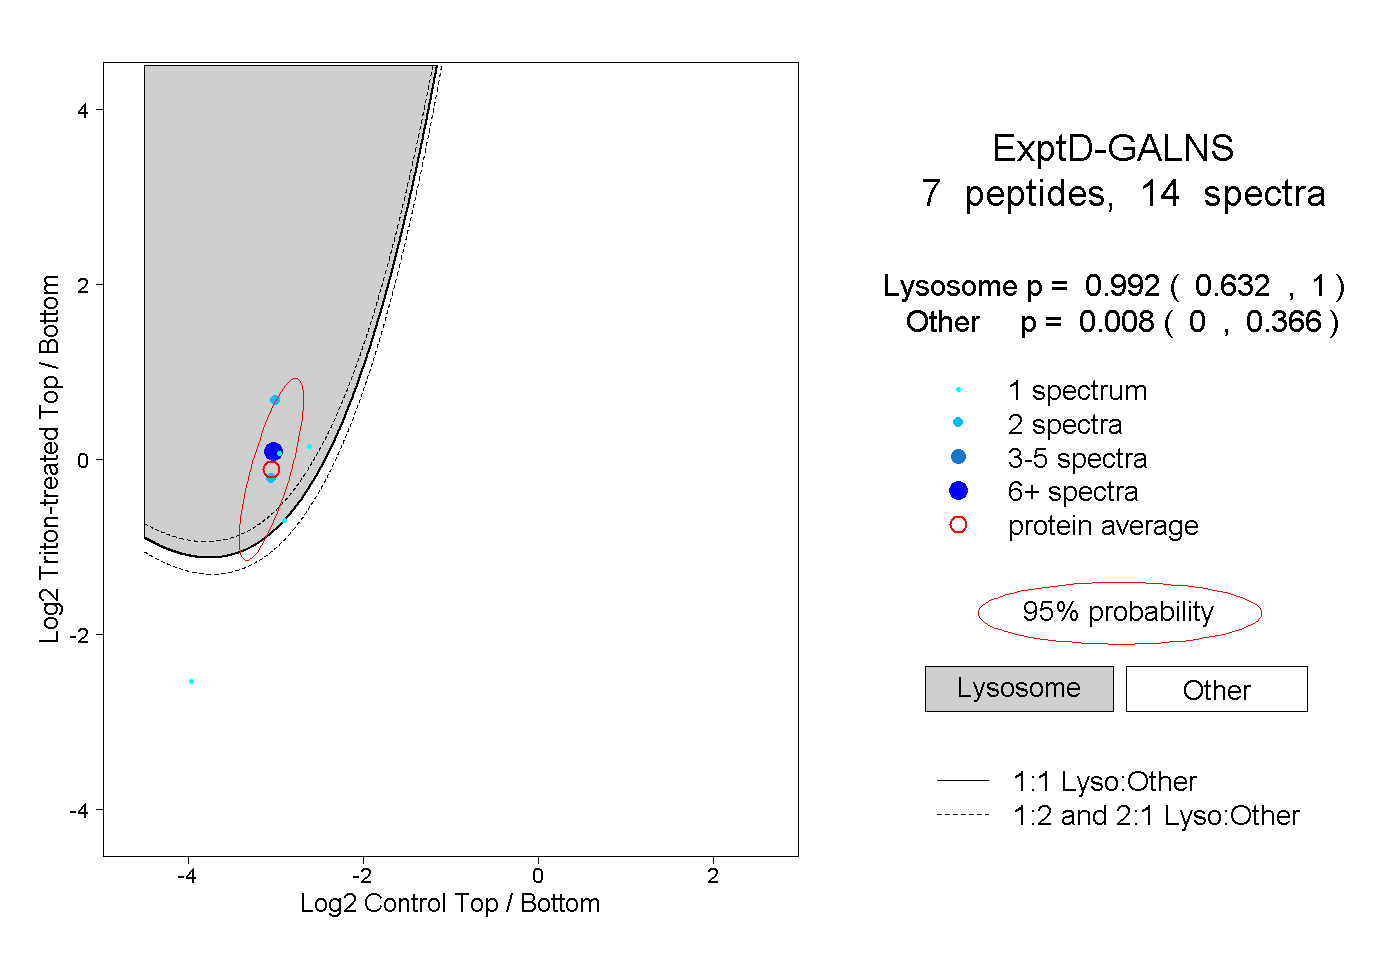
| | | Plot |
|
Lyso |
|
|
|
|
|
|
|
Other |
| Expt D |
7
peptides |
14
spectra |
 |
|
0.992
0.632 | 1.000 |
|
|
|
|
|
|
|
0.008
0.000 | 0.366 |