 12
12peptides
spectra
0.000 | 0.000
1.000 | 1.000
0.000 | 0.000
0.000 | 0.000
0.000 | 0.000
0.000 | 0.000
0.000 | 0.000
0.000 | 0.000
| Plot | Mito | Lyso | Perox | ER | Golgi | PM | Cytosol | Nucleus | |||||
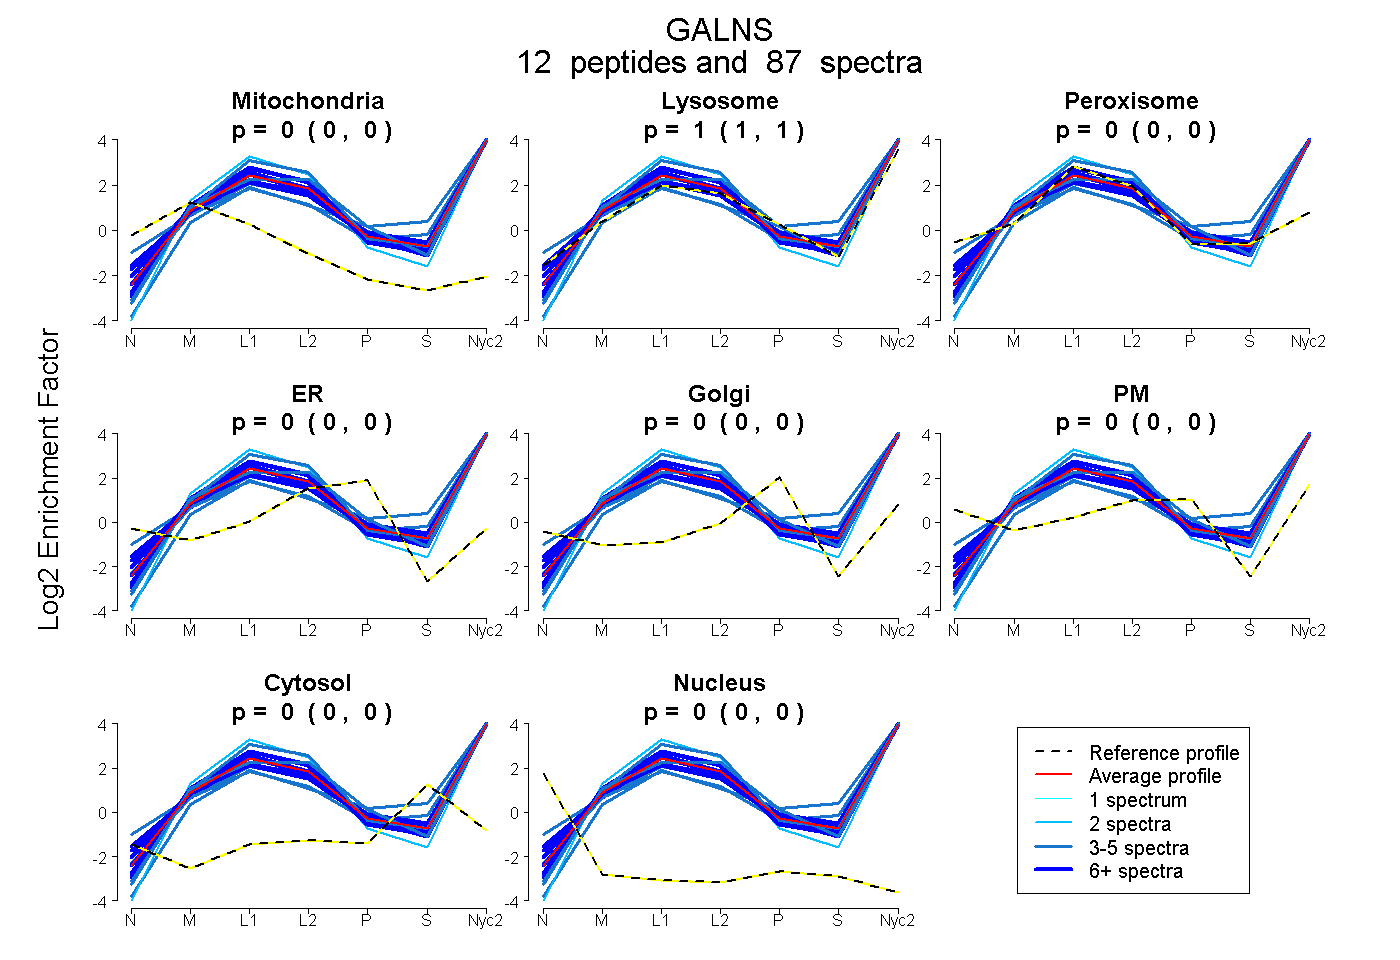
| Expt A |
12 peptides |
87 spectra |
|
0.000 0.000 | 0.000 |
1.000 1.000 | 1.000 |
0.000 0.000 | 0.000 |
0.000 0.000 | 0.000 |
0.000 0.000 | 0.000 |
0.000 0.000 | 0.000 |
0.000 0.000 | 0.000 |
0.000 0.000 | 0.000 |
| 3 spectra, YGDAVR | 0.000 | 1.000 | 0.000 | 0.000 | 0.000 | 0.000 | 0.000 | 0.000 | ||
| 7 spectra, FTSNEYQDALSR | 0.000 | 1.000 | 0.000 | 0.000 | 0.000 | 0.000 | 0.000 | 0.000 | ||
| 6 spectra, TTQVIQQHQK | 0.000 | 1.000 | 0.000 | 0.000 | 0.000 | 0.000 | 0.000 | 0.000 | ||
| 3 spectra, FYEEFPINLK | 0.000 | 0.958 | 0.000 | 0.000 | 0.000 | 0.000 | 0.042 | 0.000 | ||
| 5 spectra, DWEMVGR | 0.000 | 0.989 | 0.011 | 0.000 | 0.000 | 0.000 | 0.000 | 0.000 | ||
| 2 spectra, EGGSNGPFLCGK | 0.000 | 1.000 | 0.000 | 0.000 | 0.000 | 0.000 | 0.000 | 0.000 | ||
| 13 spectra, QFLGTSLR | 0.000 | 1.000 | 0.000 | 0.000 | 0.000 | 0.000 | 0.000 | 0.000 | ||
| 24 spectra, AALLTGR | 0.000 | 1.000 | 0.000 | 0.000 | 0.000 | 0.000 | 0.000 | 0.000 | ||
| 6 spectra, QTTFEGGMR | 0.000 | 1.000 | 0.000 | 0.000 | 0.000 | 0.000 | 0.000 | 0.000 | ||
| 11 spectra, ETPNLDR | 0.000 | 1.000 | 0.000 | 0.000 | 0.000 | 0.000 | 0.000 | 0.000 | ||
| 3 spectra, AHLWTWTNSWEEFR | 0.000 | 0.934 | 0.000 | 0.000 | 0.000 | 0.000 | 0.066 | 0.000 | ||
| 4 spectra, VKPNIPVYR | 0.000 | 1.000 | 0.000 | 0.000 | 0.000 | 0.000 | 0.000 | 0.000 |
| Plot | Mito | Lyso or Perox | ER | Golgi | PM | Cytosol | Nucleus | ||||||
| Expt B |
12 peptides |
38 spectra |
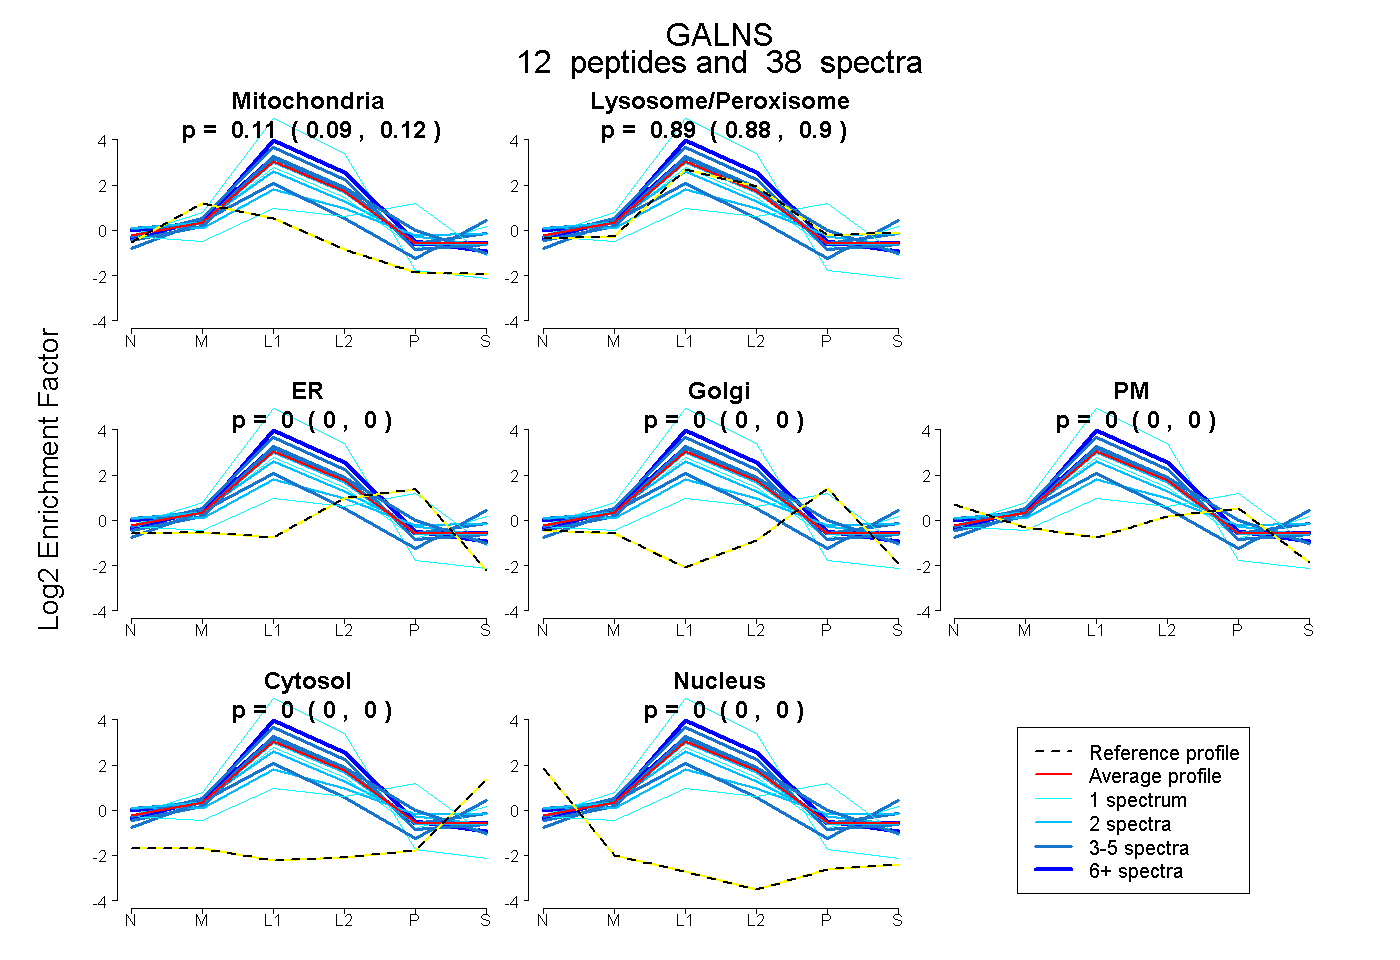 |
0.106 0.093 | 0.117 |
0.894 0.880 | 0.905 |
0.000 0.000 | 0.000 |
0.000 0.000 | 0.000 |
0.000 0.000 | 0.000 |
0.000 0.000 | 0.000 |
0.000 0.000 | 0.000 |
|||
| Plot | Lyso | Other | |||||||||||
| Expt C |
19 peptides |
262 spectra |
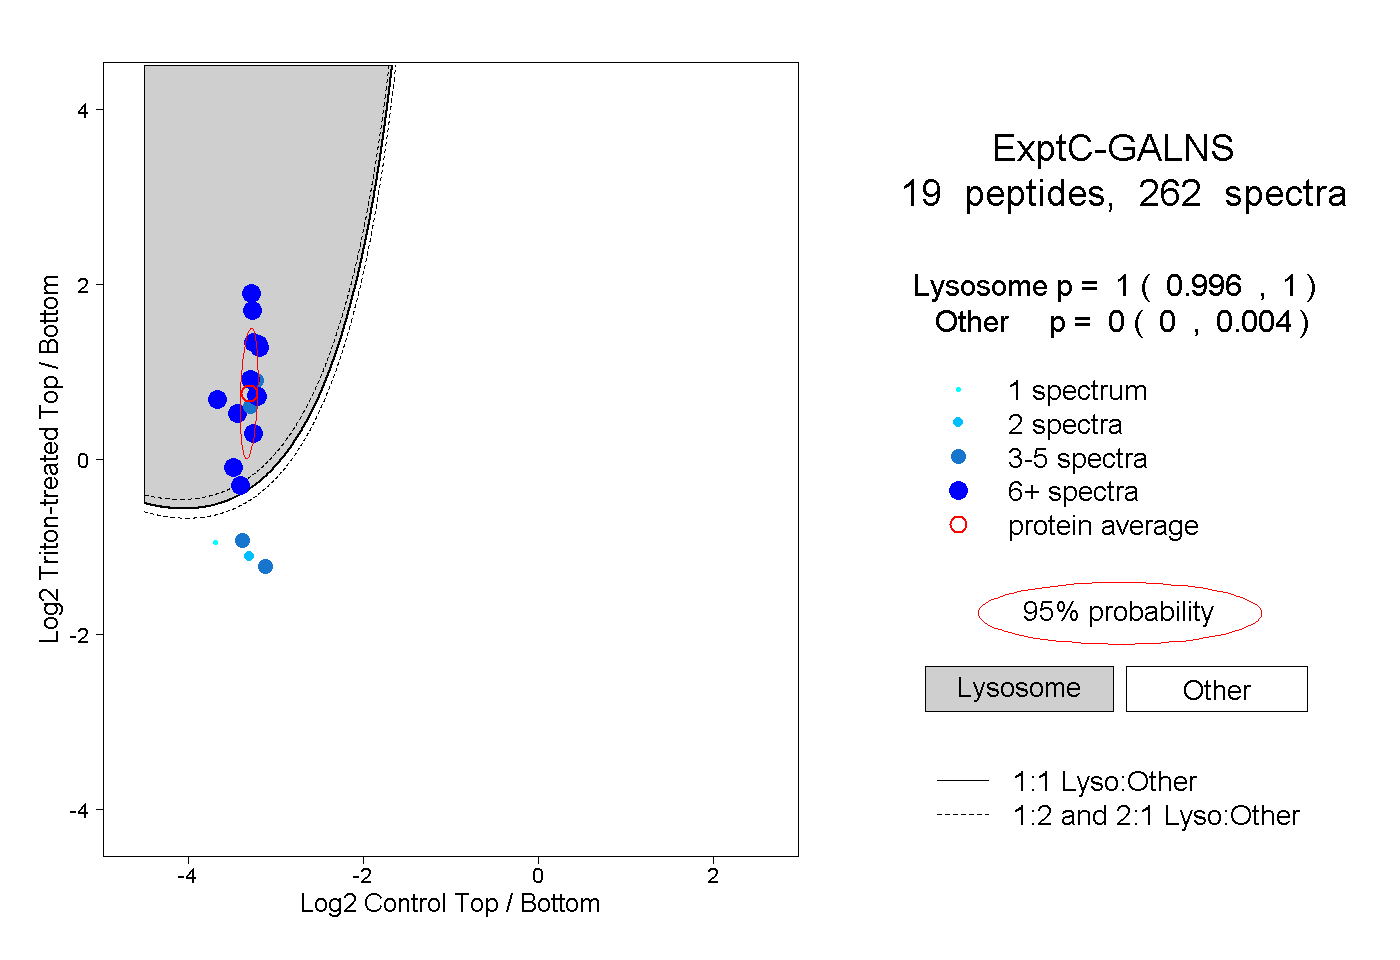 |
1.000 0.996 | 1.000 |
0.000 0.000 | 0.004 |
||||||||
| Plot | Lyso | Other | |||||||||||
| Expt D |
7 peptides |
14 spectra |
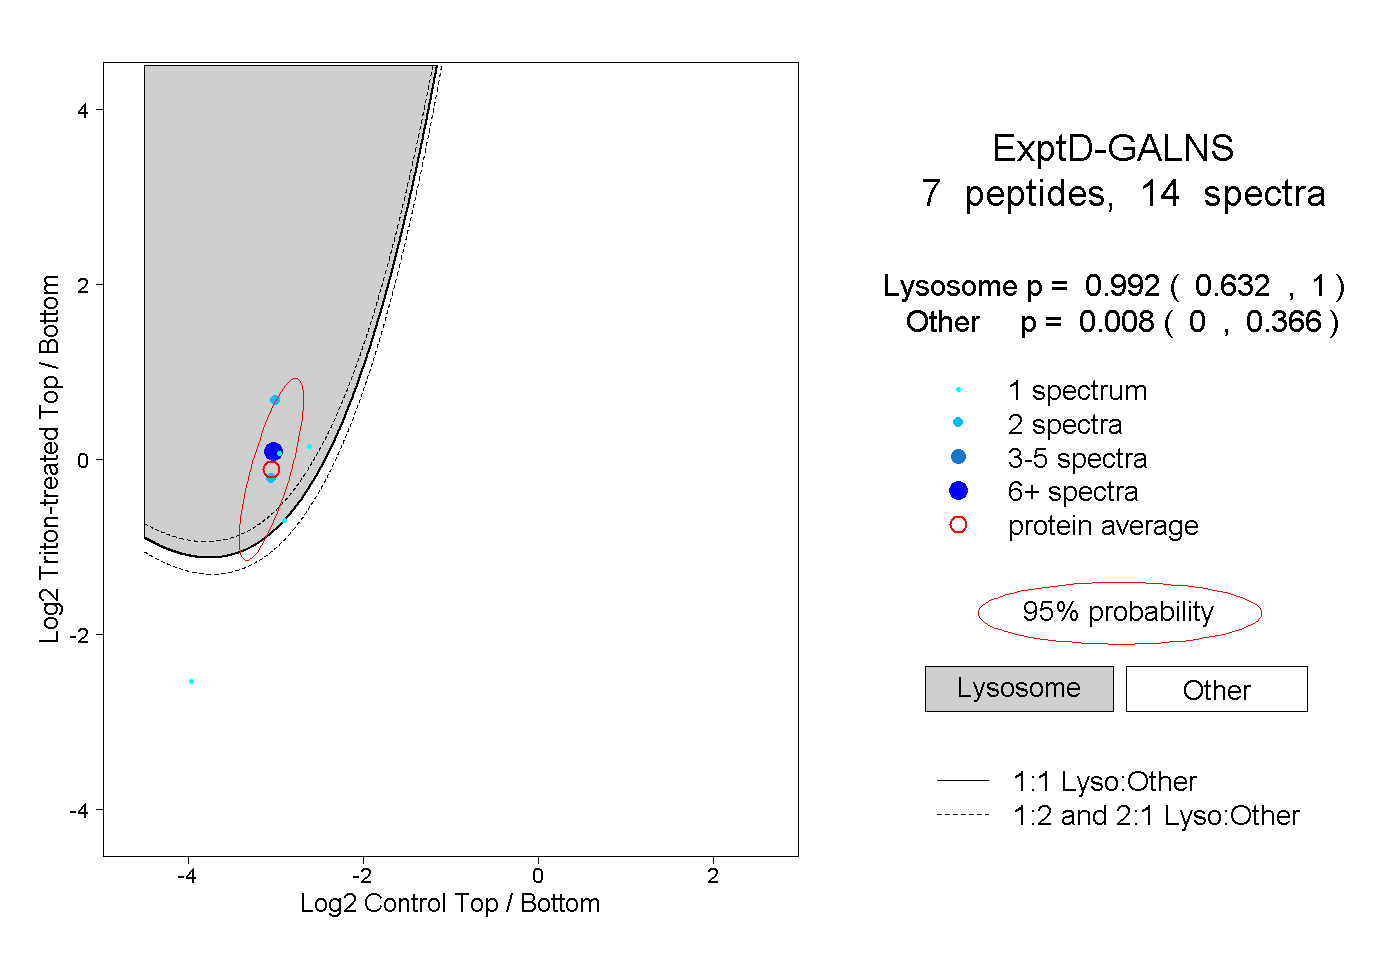 |
0.992 0.632 | 1.000 |
0.008 0.000 | 0.366 |