 28
28peptides
spectra
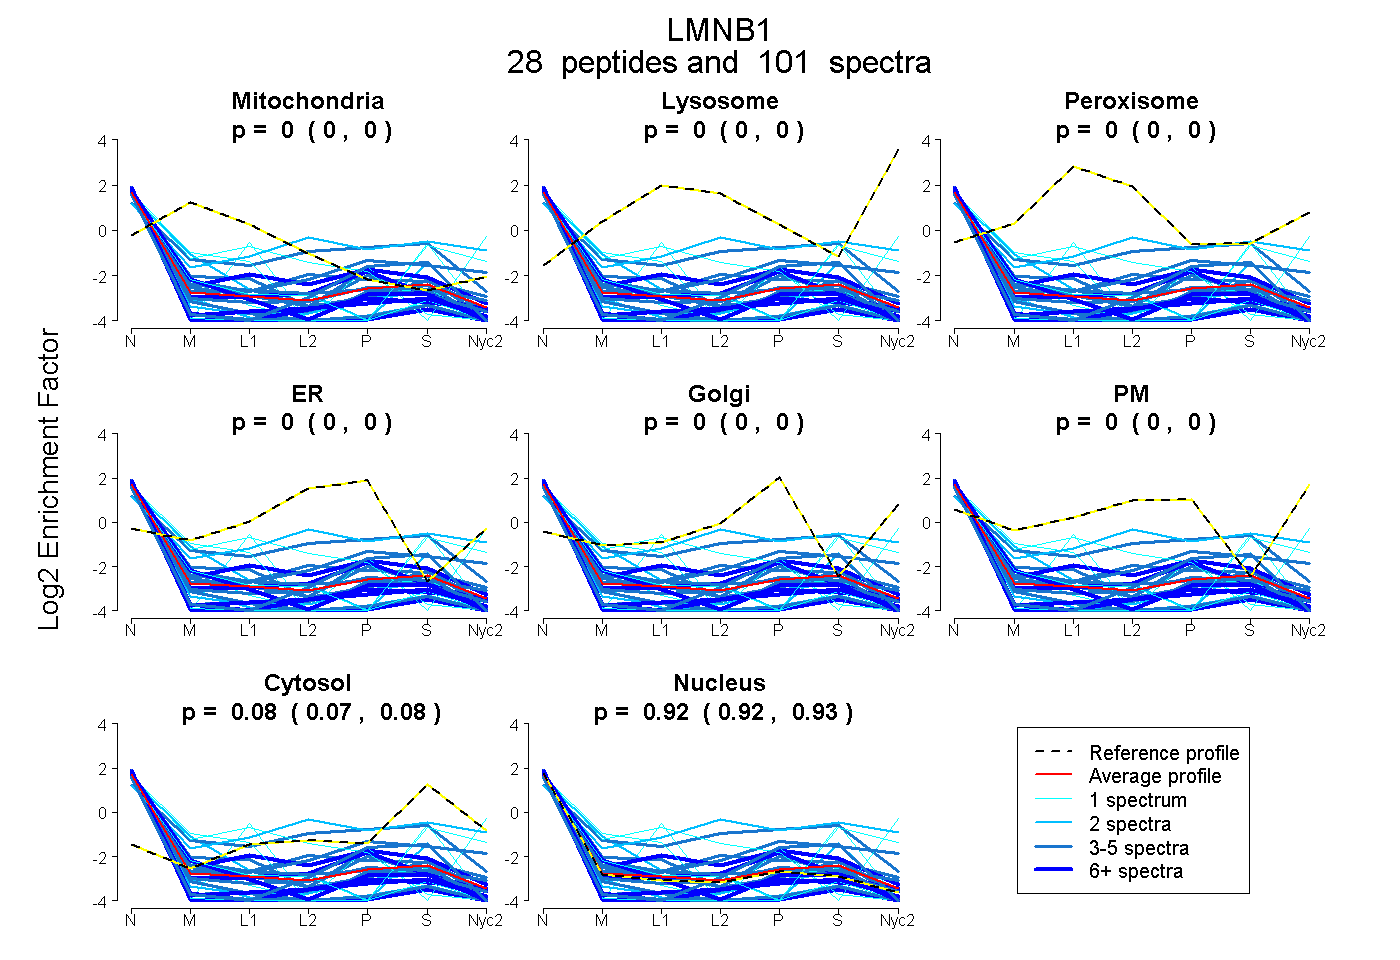
0.000 | 0.000
0.000 | 0.000
0.000 | 0.002
0.000 | 0.000
0.000 | 0.000
0.000 | 0.000
0.073 | 0.081
0.918 | 0.926
8peptides
spectra
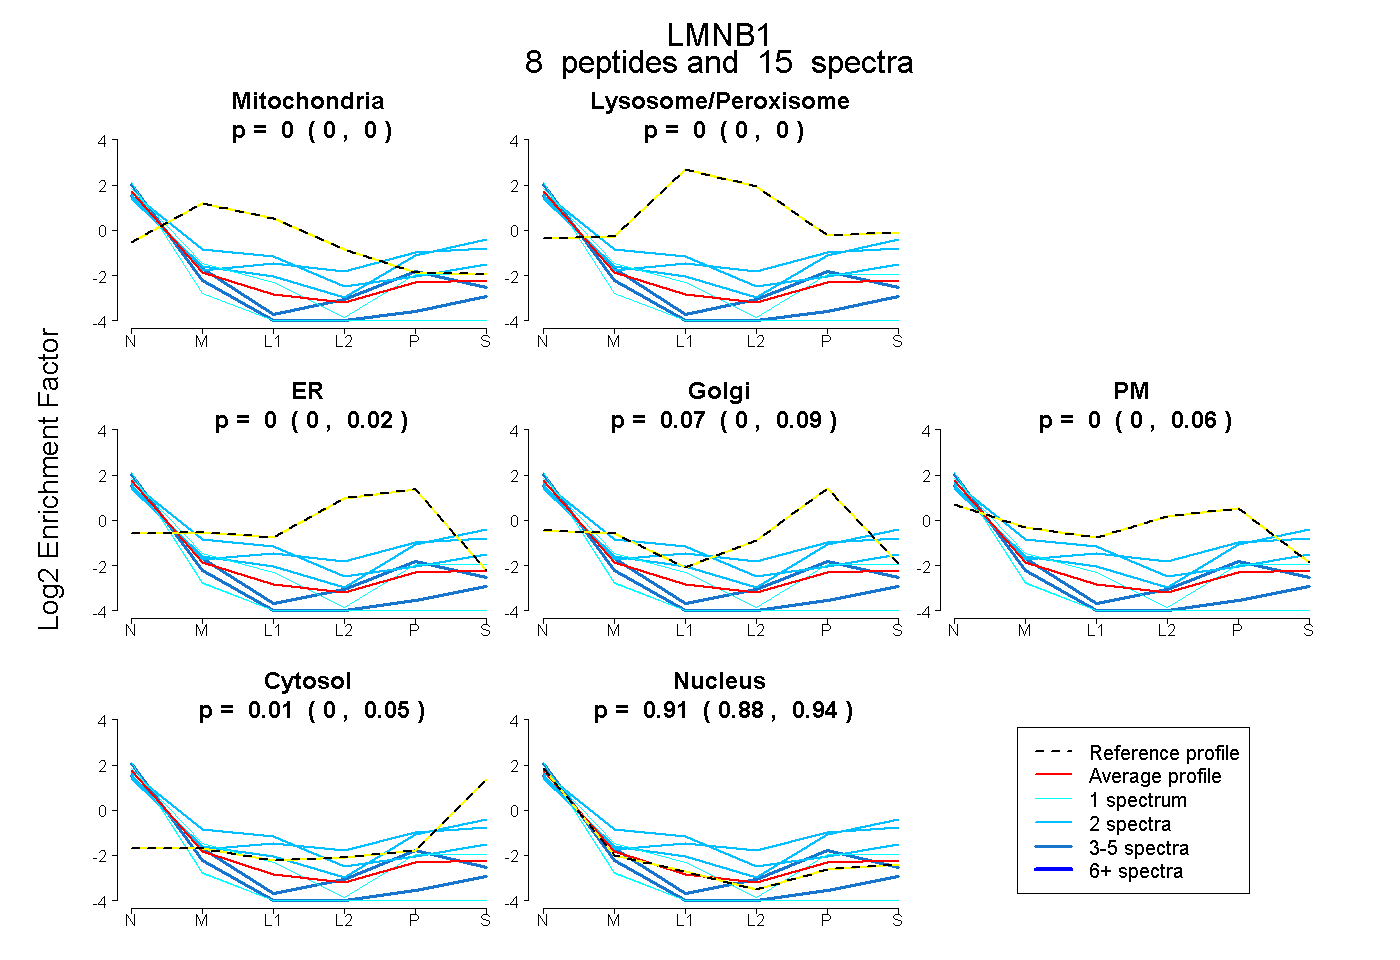
0.000 | 0.000
0.000 | 0.000
0.000 | 0.018
0.000 | 0.094
0.000 | 0.058
0.000 | 0.053
0.878 | 0.942
2peptides
spectra
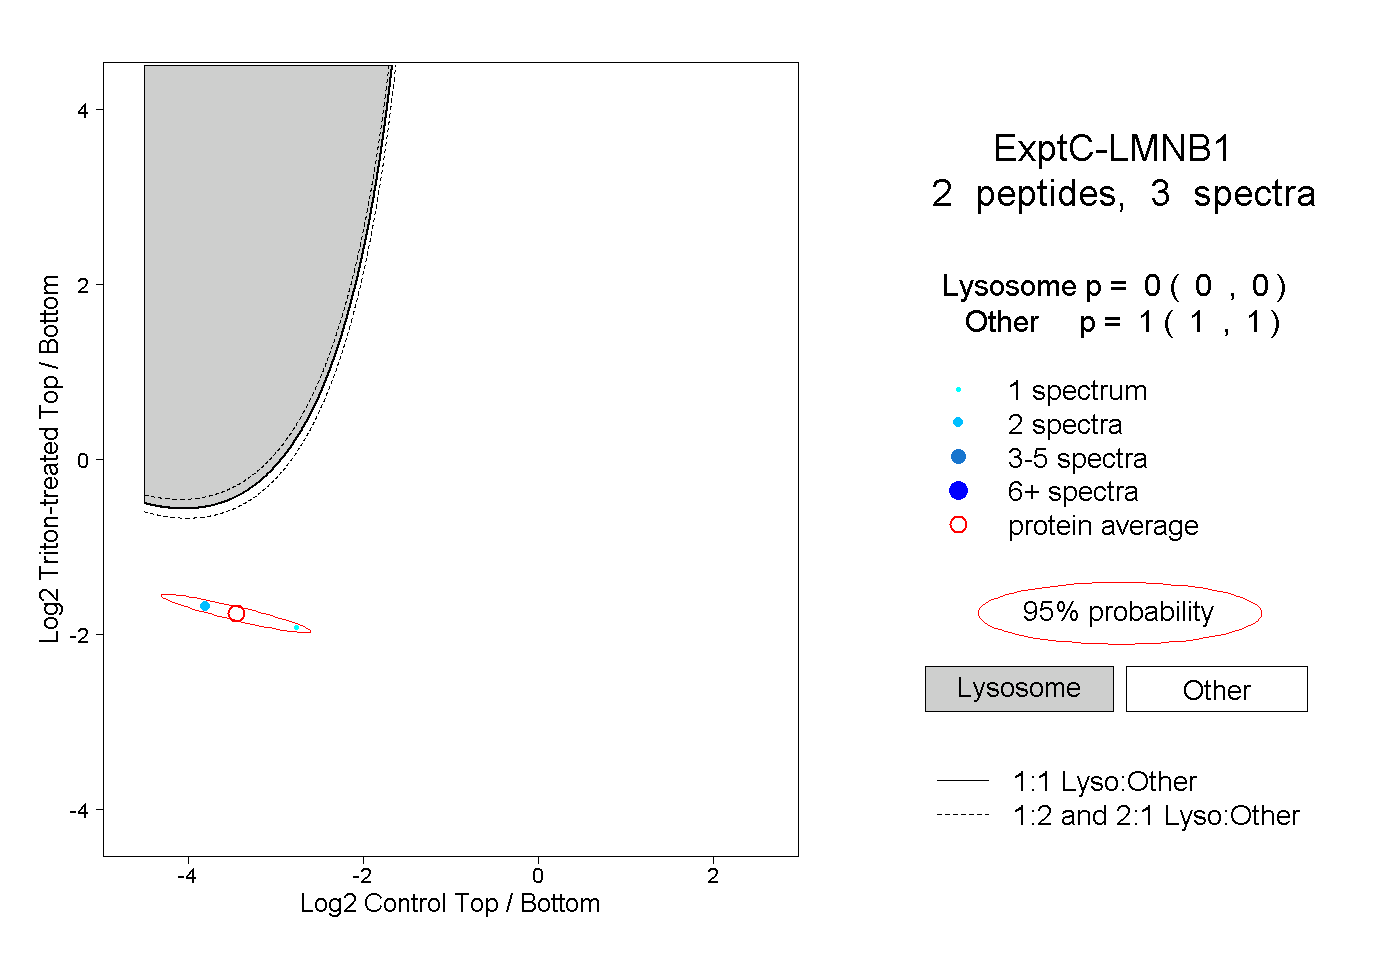
0.000 | 0.000
1.000 | 1.000