LMNB1
[ENSRNOP00000019351]
Main page
| | | Plot |
Mito |
Lyso |
|
Perox |
ER |
Golgi |
PM |
Cytosol |
Nucleus |
|
| Expt A |
 28
28
peptides |
101
spectra |
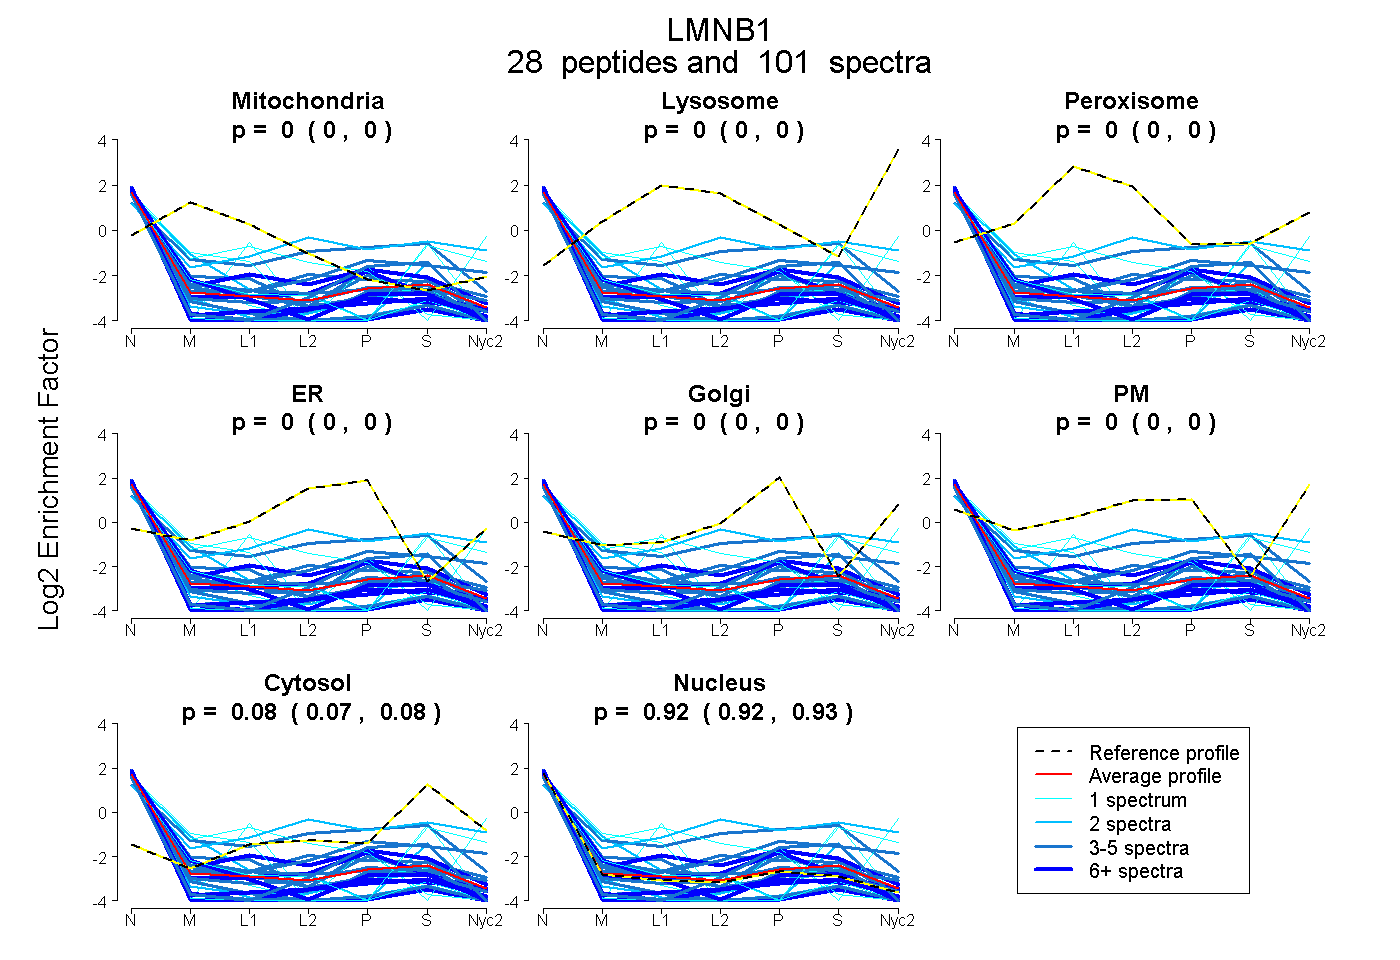 |
0.000
0.000 | 0.000 |
0.000
0.000 | 0.000 |
|
0.000
0.000 | 0.002 |
0.000
0.000 | 0.000 |
0.000
0.000 | 0.000 |
0.000
0.000 | 0.000 |
0.078
0.073 | 0.081 |
0.922
0.918 | 0.926 |
|
| | | Plot |
Mito |
|
Lyso or Perox |
|
ER |
Golgi |
PM |
Cytosol |
Nucleus |
|
| Expt B |
8
peptides |
15
spectra |
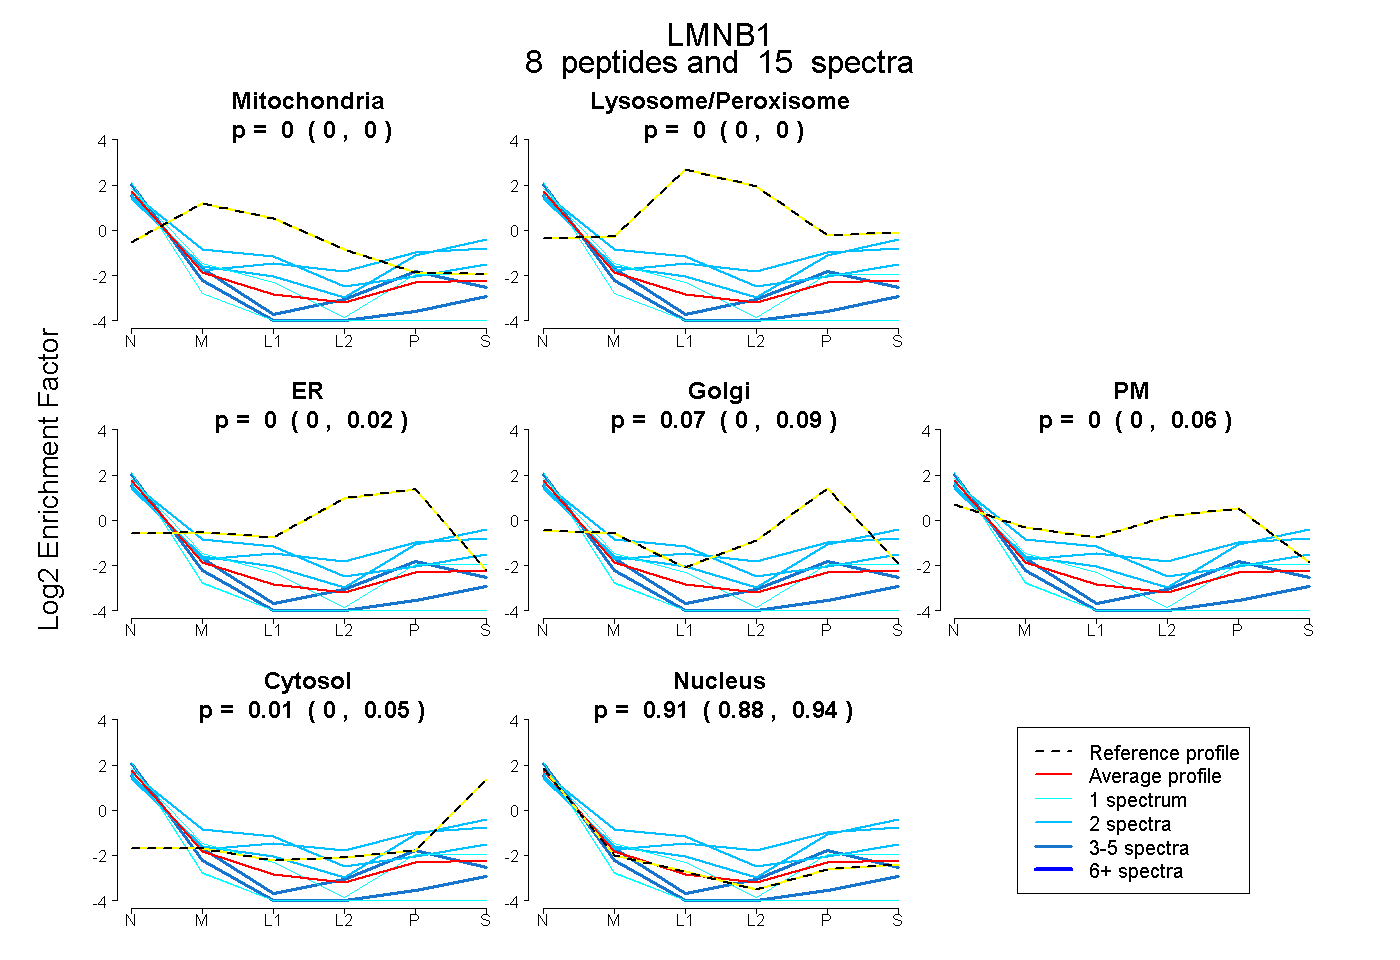 |
0.000
0.000 | 0.000 |
|
0.000
0.000 | 0.000 |
|
0.000
0.000 | 0.018 |
0.070
0.000 | 0.094 |
0.002
0.000 | 0.058 |
0.014
0.000 | 0.053 |
0.914
0.878 | 0.942 |
|
| 2 spectra, LVEVDSGR |
0.000 |
|
0.133 |
|
0.000 |
0.000 |
0.230 |
0.137 |
0.500 |
|
| 3 spectra, IQELEDMLAK |
0.000 |
|
0.000 |
|
0.000 |
0.000 |
0.000 |
0.000 |
1.000 |
|
| 3 spectra, ALYETELADAR |
0.000 |
|
0.000 |
|
0.000 |
0.155 |
0.000 |
0.000 |
0.845 |
|
| 1 spectrum, VDLENR |
0.025 |
|
0.000 |
|
0.000 |
0.064 |
0.000 |
0.016 |
0.895 |
|
| 2 spectra, EELMESR |
0.000 |
|
0.000 |
|
0.000 |
0.002 |
0.178 |
0.295 |
0.525 |
|
| 2 spectra, LAQALHEMR |
0.141 |
|
0.167 |
|
0.000 |
0.000 |
0.000 |
0.000 |
0.692 |
|
| 1 spectrum, NSQGEEVAQR |
0.000 |
|
0.000 |
|
0.000 |
0.000 |
0.000 |
0.000 |
1.000 |
|
| 1 spectrum, ASAPATPLSPTR |
0.000 |
|
0.000 |
|
0.000 |
0.000 |
0.000 |
0.000 |
1.000 |
|
| | | Plot |
|
Lyso |
|
|
|
|
|
|
|
Other |
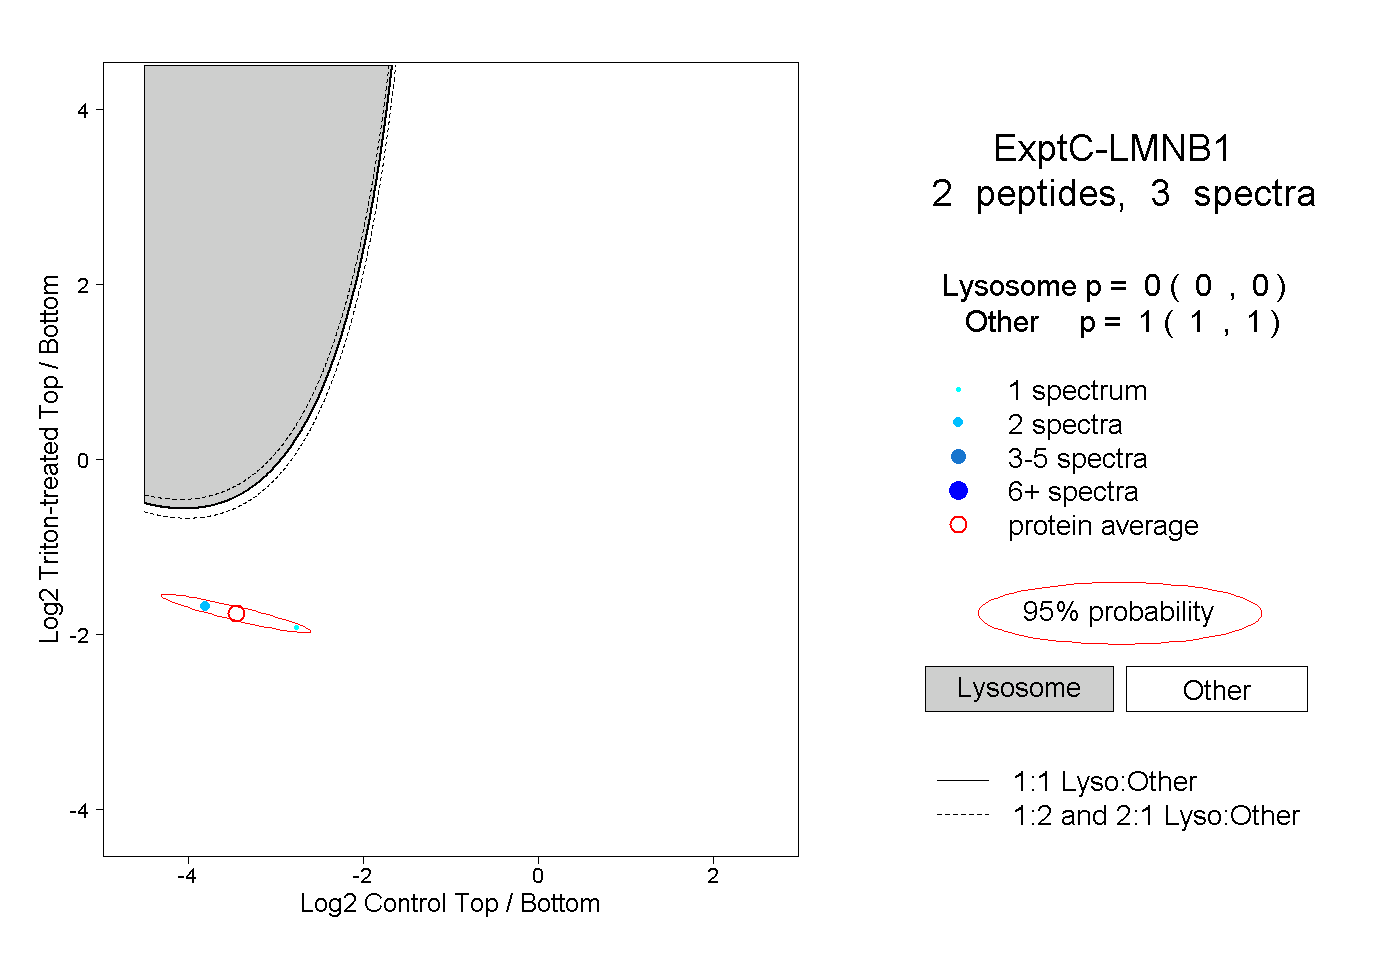
| Expt C |
2
peptides |
3
spectra |
 |
|
0.000
0.000 | 0.000 |
|
|
|
|
|
|
|
1.000
1.000 | 1.000 |