 28
28peptides
spectra
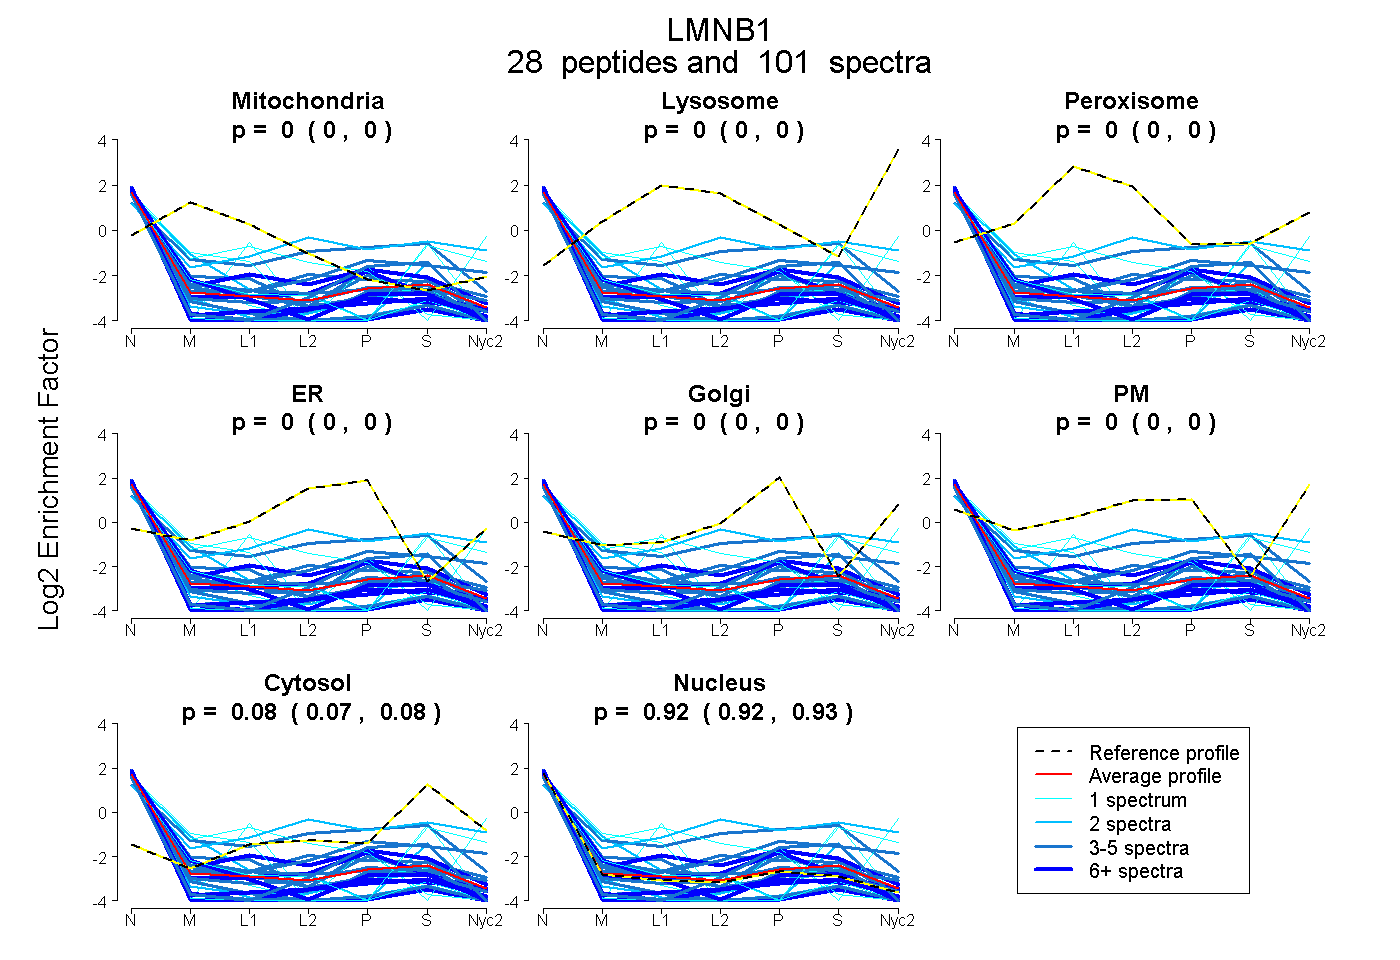
0.000 | 0.000
0.000 | 0.000
0.000 | 0.002
0.000 | 0.000
0.000 | 0.000
0.000 | 0.000
0.073 | 0.081
0.918 | 0.926
| Plot | Mito | Lyso | Perox | ER | Golgi | PM | Cytosol | Nucleus | |||||
| Expt A |
28 peptides |
101 spectra |
|
0.000 0.000 | 0.000 |
0.000 0.000 | 0.000 |
0.000 0.000 | 0.002 |
0.000 0.000 | 0.000 |
0.000 0.000 | 0.000 |
0.000 0.000 | 0.000 |
0.078 0.073 | 0.081 |
0.922 0.918 | 0.926 |
| 4 spectra, LVEVDSGR | 0.091 | 0.000 | 0.010 | 0.000 | 0.000 | 0.000 | 0.000 | 0.899 | ||
| 2 spectra, LALDMEISAYR | 0.000 | 0.000 | 0.000 | 0.000 | 0.000 | 0.000 | 0.000 | 1.000 | ||
| 3 spectra, NMYEEEINETR | 0.000 | 0.000 | 0.000 | 0.000 | 0.000 | 0.000 | 0.000 | 1.000 | ||
| 1 spectrum, IESLSSQLSNLQK | 0.116 | 0.000 | 0.000 | 0.000 | 0.000 | 0.298 | 0.000 | 0.586 | ||
| 3 spectra, SLETENSALQLQVTER | 0.000 | 0.000 | 0.000 | 0.000 | 0.000 | 0.000 | 0.128 | 0.872 | ||
| 3 spectra, ALDDTAR | 0.000 | 0.000 | 0.000 | 0.007 | 0.013 | 0.000 | 0.082 | 0.899 | ||
| 9 spectra, ESDLSGAQIK | 0.000 | 0.000 | 0.091 | 0.063 | 0.000 | 0.000 | 0.058 | 0.788 | ||
| 4 spectra, LAQALHEMR | 0.000 | 0.000 | 0.000 | 0.000 | 0.098 | 0.080 | 0.196 | 0.625 | ||
| 3 spectra, CQSLTEDLEFR | 0.140 | 0.000 | 0.000 | 0.000 | 0.000 | 0.000 | 0.020 | 0.839 | ||
| 5 spectra, EQHDAQVR | 0.000 | 0.000 | 0.064 | 0.034 | 0.000 | 0.054 | 0.040 | 0.807 | ||
| 1 spectrum, AEHDQLLLNYAK | 0.000 | 0.000 | 0.000 | 0.000 | 0.000 | 0.000 | 0.227 | 0.773 | ||
| 6 spectra, NSQGEEVAQR | 0.000 | 0.000 | 0.000 | 0.000 | 0.000 | 0.000 | 0.000 | 1.000 | ||
| 3 spectra, EELEQTYHAK | 0.033 | 0.000 | 0.106 | 0.182 | 0.000 | 0.000 | 0.242 | 0.437 | ||
| 9 spectra, ASAPATPLSPTR | 0.000 | 0.000 | 0.000 | 0.000 | 0.000 | 0.000 | 0.000 | 1.000 | ||
| 1 spectrum, NQNSWGTGEDVK | 0.000 | 0.000 | 0.000 | 0.000 | 0.000 | 0.000 | 0.000 | 1.000 | ||
| 7 spectra, LSSEMNTSTVNSAR | 0.000 | 0.000 | 0.000 | 0.000 | 0.000 | 0.000 | 0.000 | 1.000 | ||
| 5 spectra, ALYETELADAR | 0.000 | 0.000 | 0.000 | 0.000 | 0.000 | 0.000 | 0.000 | 1.000 | ||
| 1 spectrum, EMAEIR | 0.000 | 0.000 | 0.000 | 0.000 | 0.000 | 0.000 | 0.000 | 1.000 | ||
| 4 spectra, EYEAALNSK | 0.005 | 0.000 | 0.000 | 0.025 | 0.000 | 0.000 | 0.000 | 0.970 | ||
| 6 spectra, IQELEDMLAK | 0.000 | 0.000 | 0.000 | 0.080 | 0.005 | 0.000 | 0.000 | 0.915 | ||
| 1 spectrum, QLADETLLK | 0.000 | 0.000 | 0.000 | 0.000 | 0.000 | 0.000 | 0.362 | 0.638 | ||
| 3 spectra, LAVYIDK | 0.000 | 0.000 | 0.000 | 0.000 | 0.000 | 0.000 | 0.000 | 1.000 | ||
| 2 spectra, NTSEQDQPMGGWEMIR | 0.000 | 0.000 | 0.126 | 0.000 | 0.000 | 0.277 | 0.306 | 0.291 | ||
| 4 spectra, LQIEIGK | 0.000 | 0.000 | 0.000 | 0.000 | 0.011 | 0.000 | 0.052 | 0.937 | ||
| 6 spectra, QIEYEYK | 0.014 | 0.000 | 0.000 | 0.000 | 0.000 | 0.000 | 0.000 | 0.986 | ||
| 2 spectra, EELMESR | 0.000 | 0.000 | 0.000 | 0.000 | 0.000 | 0.000 | 0.000 | 1.000 | ||
| 2 spectra, DAALATALGDK | 0.213 | 0.000 | 0.000 | 0.000 | 0.000 | 0.000 | 0.028 | 0.760 | ||
| 1 spectrum, LSPSPSSR | 0.358 | 0.000 | 0.000 | 0.098 | 0.000 | 0.000 | 0.000 | 0.543 |
| Plot | Mito | Lyso or Perox | ER | Golgi | PM | Cytosol | Nucleus | ||||||
| Expt B |
8 peptides |
15 spectra |
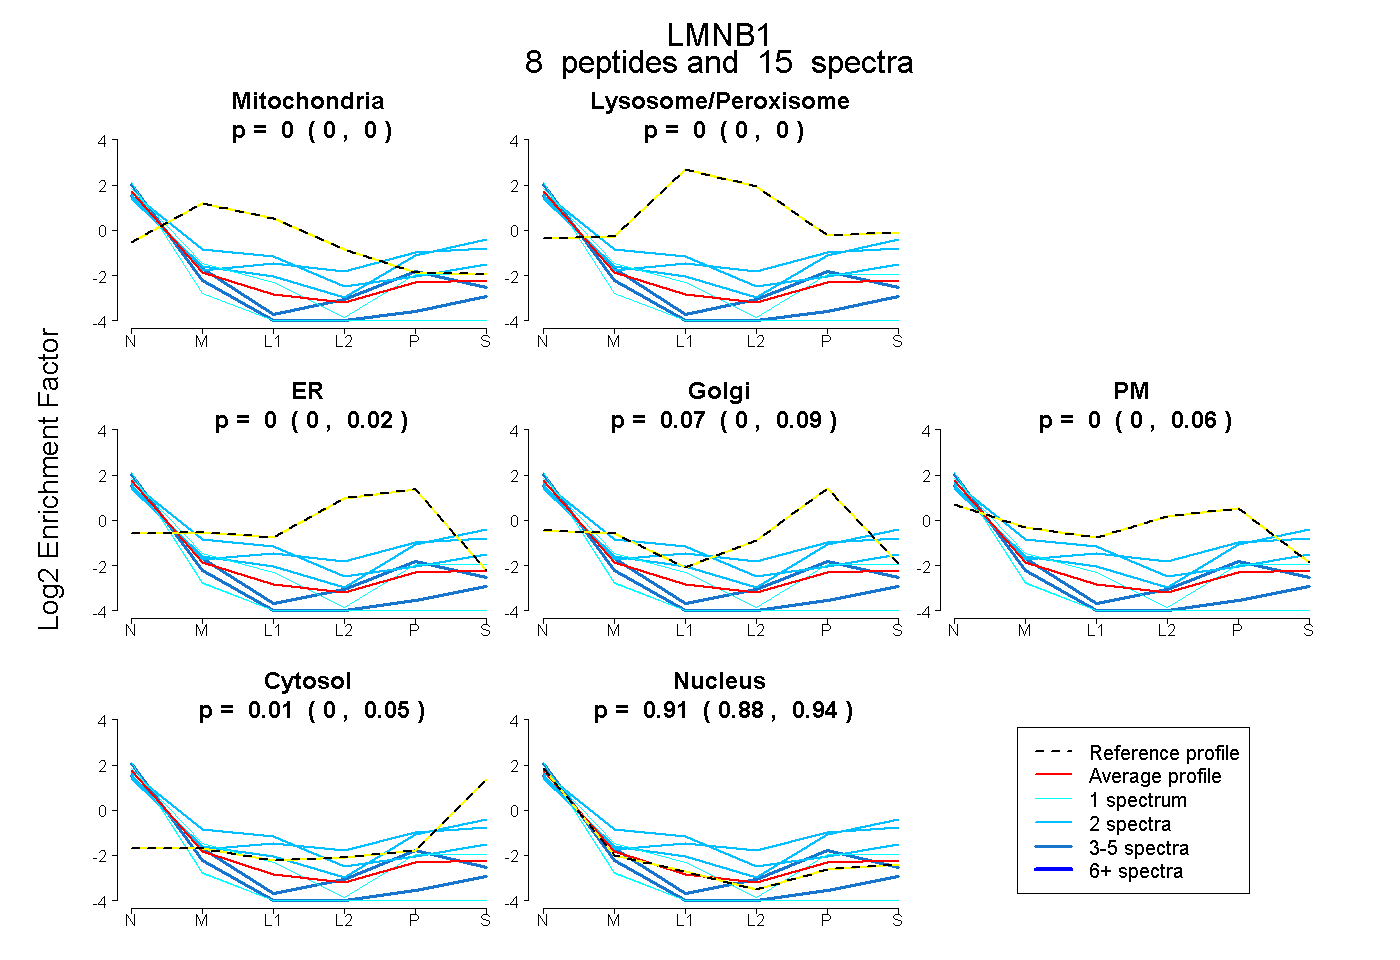 |
0.000 0.000 | 0.000 |
0.000 0.000 | 0.000 |
0.000 0.000 | 0.018 |
0.070 0.000 | 0.094 |
0.002 0.000 | 0.058 |
0.014 0.000 | 0.053 |
0.914 0.878 | 0.942 |
|||
| Plot | Lyso | Other | |||||||||||
| Expt C |
2 peptides |
3 spectra |
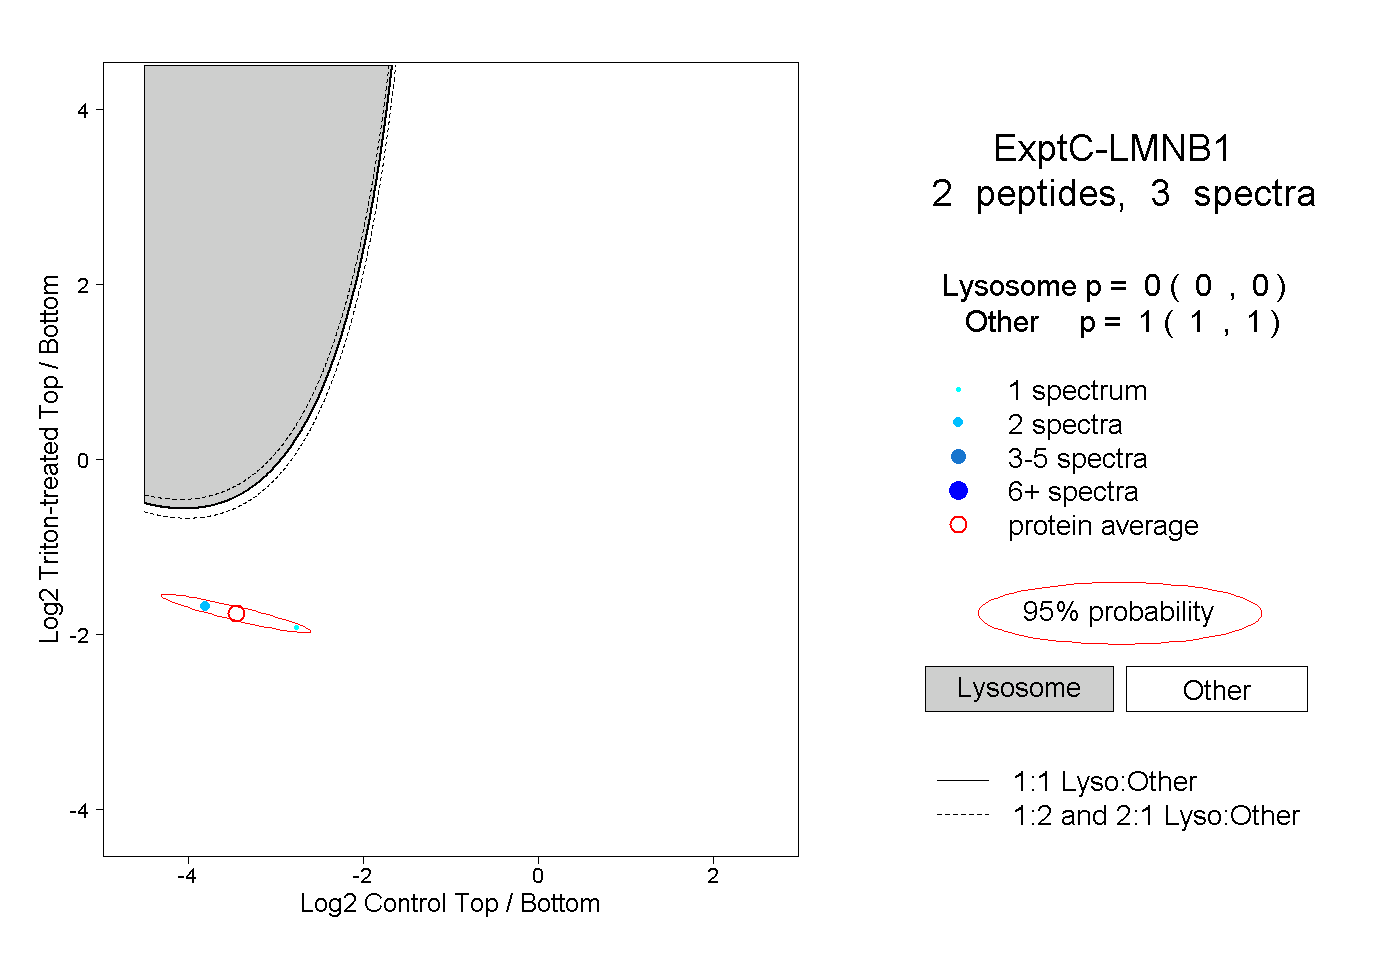 |
0.000 0.000 | 0.000 |
1.000 1.000 | 1.000 |