 8
8peptides
spectra
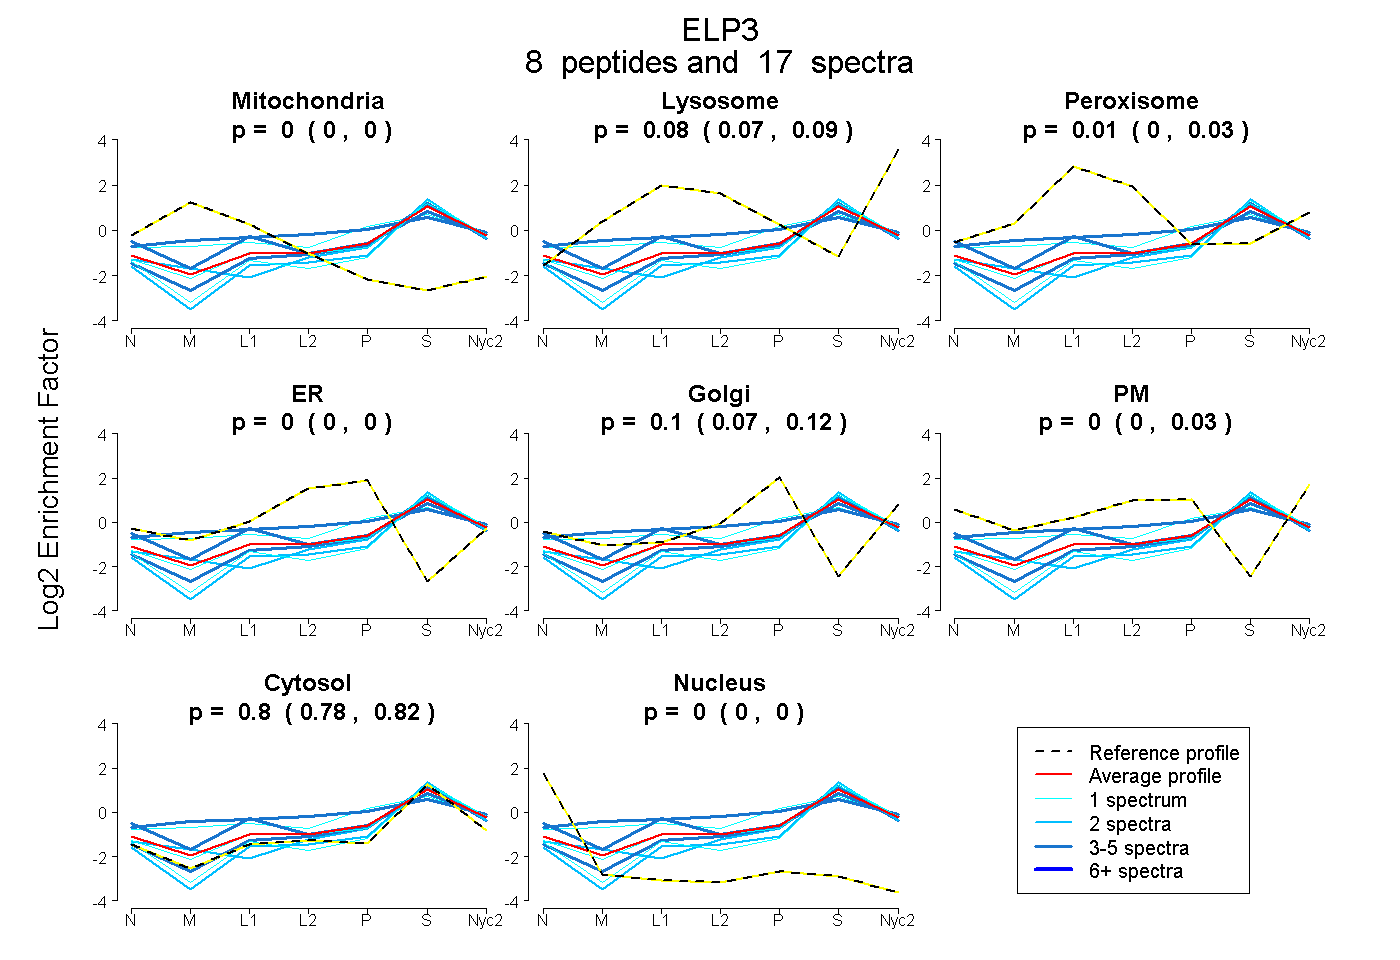
0.000 | 0.000
0.067 | 0.092
0.000 | 0.034
0.000 | 0.000
0.071 | 0.118
0.000 | 0.027
0.783 | 0.816
0.000 | 0.000
3peptides
spectra
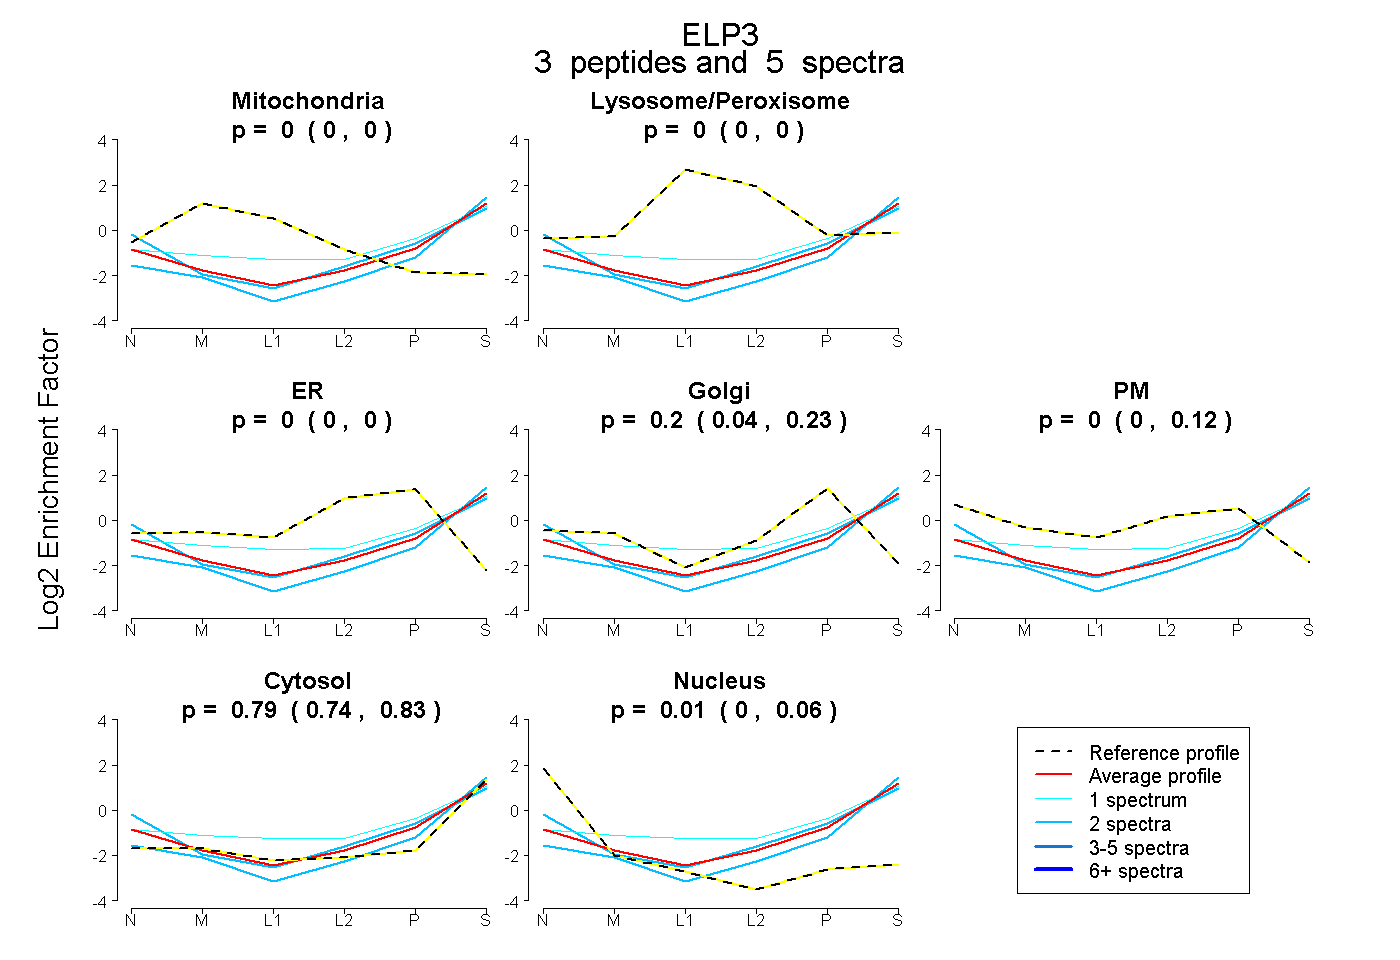
0.000 | 0.000
0.000 | 0.001
0.000 | 0.000
0.036 | 0.226
0.000 | 0.125
0.741 | 0.831
0.000 | 0.056
5peptides
spectra
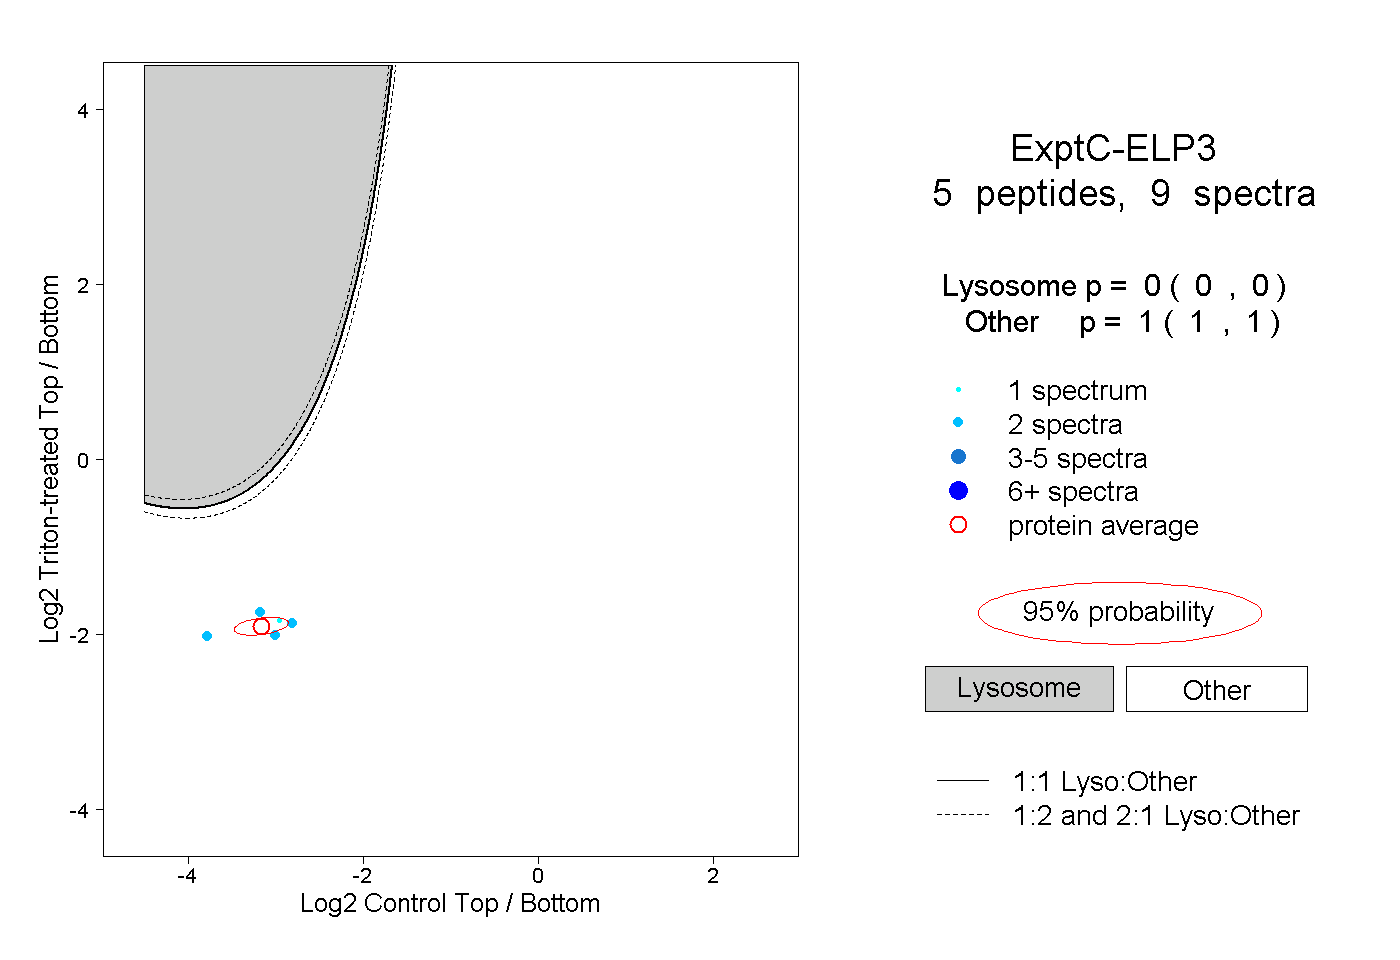
0.000 | 0.000
1.000 | 1.000
1peptide
spectrum
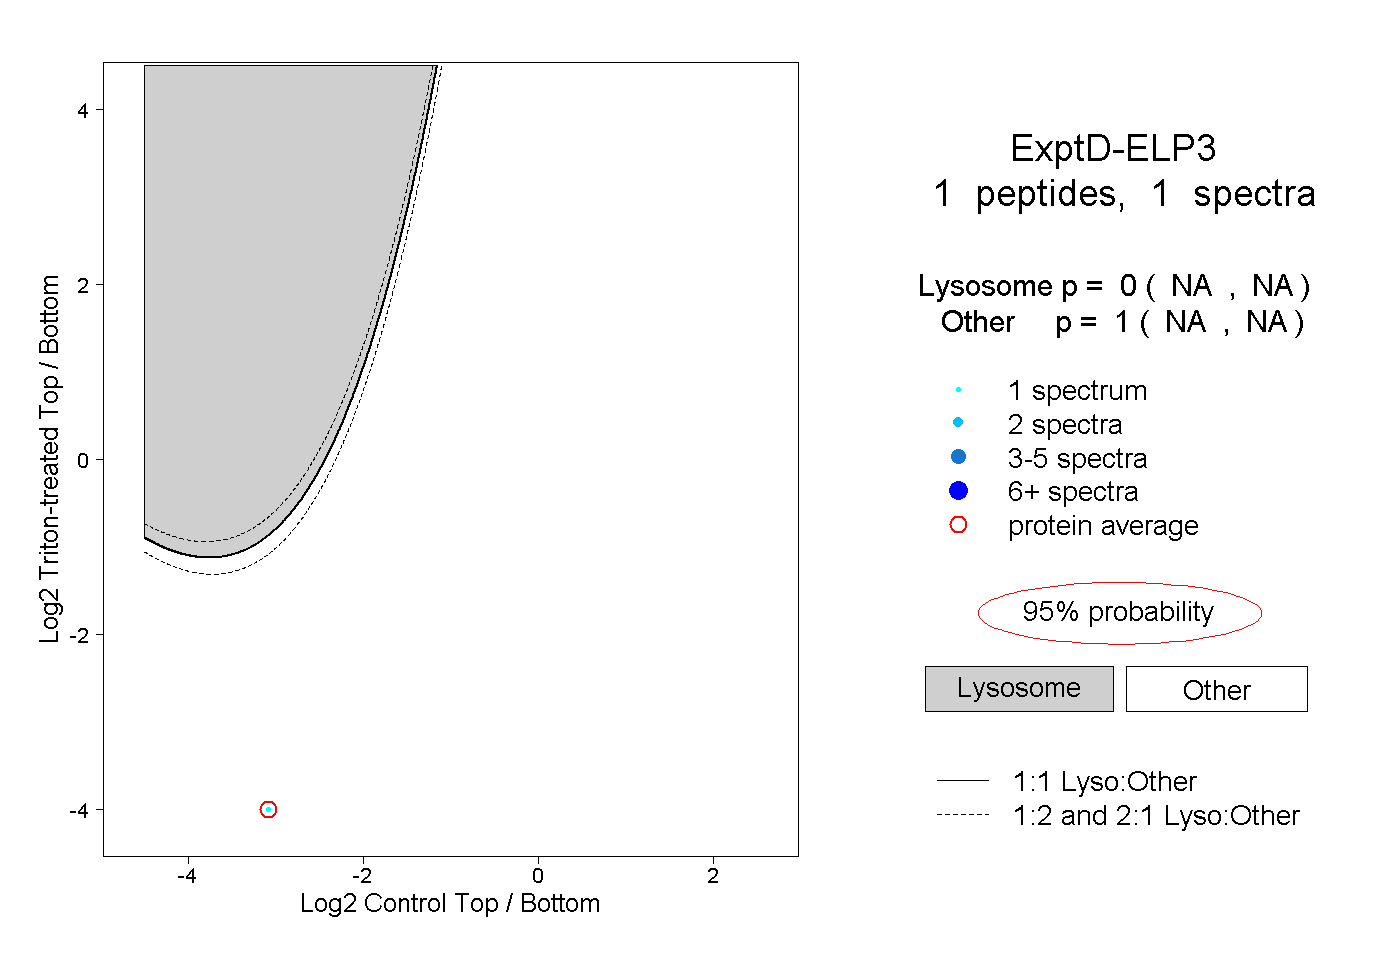
NA | NA
NA | NA