 8
8peptides
spectra
0.000 | 0.000
0.067 | 0.092
0.000 | 0.034
0.000 | 0.000
0.071 | 0.118
0.000 | 0.027
0.783 | 0.816
0.000 | 0.000
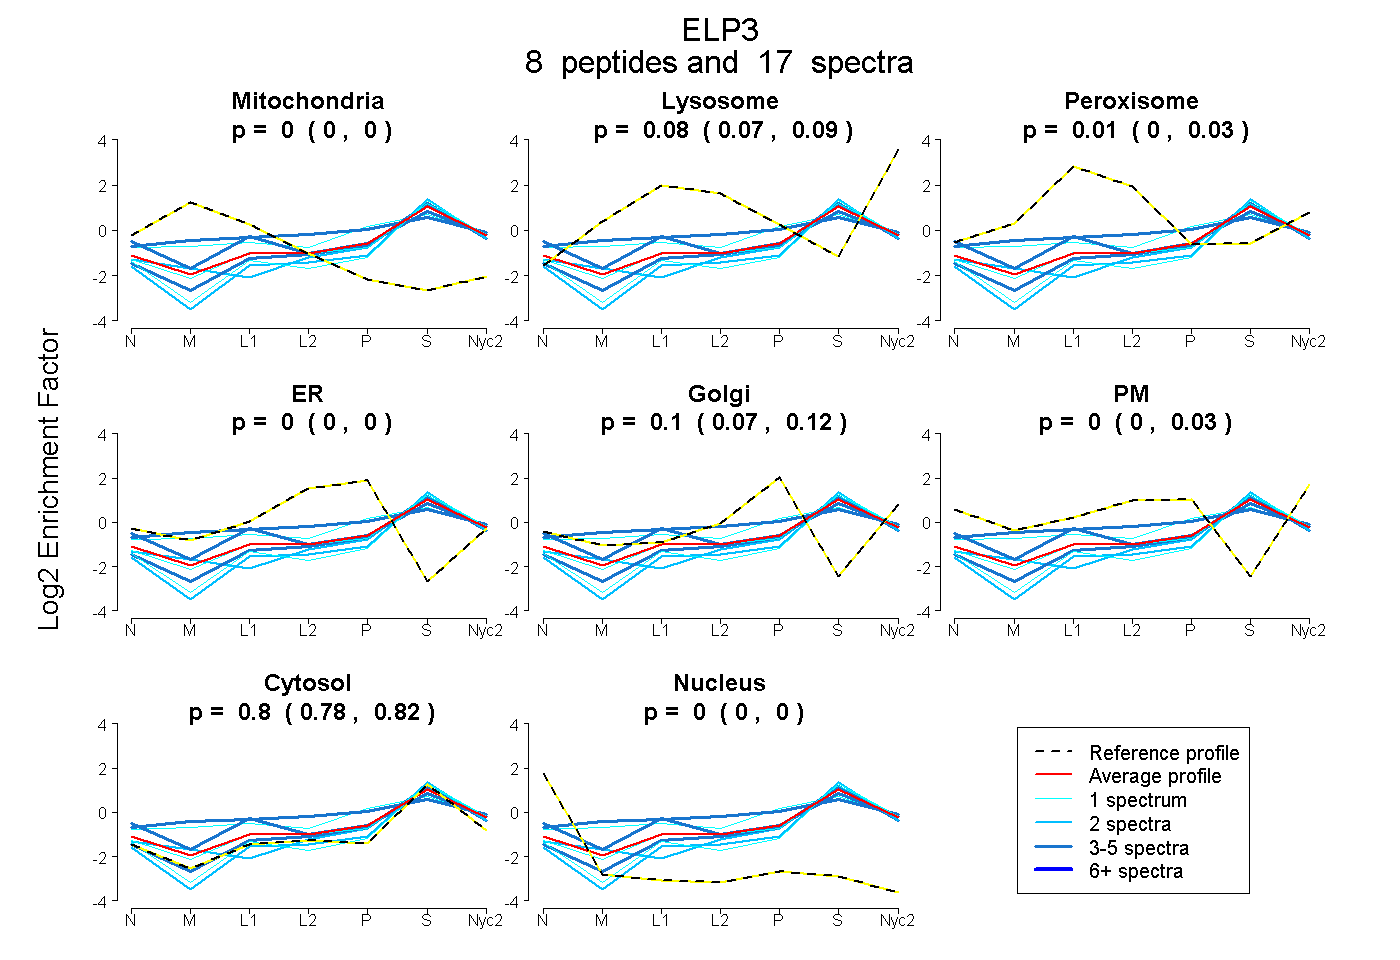
| Plot | Mito | Lyso | Perox | ER | Golgi | PM | Cytosol | Nucleus | |||||
| Expt A |
8 peptides |
17 spectra |
|
0.000 0.000 | 0.000 |
0.083 0.067 | 0.092 |
0.012 0.000 | 0.034 |
0.000 0.000 | 0.000 |
0.104 0.071 | 0.118 |
0.000 0.000 | 0.027 |
0.801 0.783 | 0.816 |
0.000 0.000 | 0.000 |
| 3 spectra, IAVISGVGTR | 0.000 | 0.032 | 0.000 | 0.000 | 0.081 | 0.000 | 0.888 | 0.000 | ||
| 1 spectrum, SYSPSDLIELVAR | 0.000 | 0.003 | 0.000 | 0.000 | 0.000 | 0.000 | 0.997 | 0.000 | ||
| 2 spectra, FELGGGVSIVR | 0.000 | 0.002 | 0.000 | 0.000 | 0.138 | 0.000 | 0.860 | 0.000 | ||
| 1 spectrum, ELHVYGSVVPVSSR | 0.010 | 0.000 | 0.195 | 0.000 | 0.250 | 0.000 | 0.544 | 0.000 | ||
| 2 spectra, LYPTLVIR | 0.000 | 0.000 | 0.000 | 0.000 | 0.000 | 0.000 | 1.000 | 0.000 | ||
| 1 spectrum, YDPYLQTR | 0.000 | 0.110 | 0.000 | 0.000 | 0.041 | 0.000 | 0.848 | 0.000 | ||
| 3 spectra, LVDIIAAVPPHYR | 0.000 | 0.000 | 0.145 | 0.000 | 0.000 | 0.147 | 0.708 | 0.000 | ||
| 4 spectra, EVGIQEIHHR | 0.019 | 0.000 | 0.292 | 0.000 | 0.216 | 0.000 | 0.473 | 0.000 |
| Plot | Mito | Lyso or Perox | ER | Golgi | PM | Cytosol | Nucleus | ||||||
| Expt B |
3 peptides |
5 spectra |
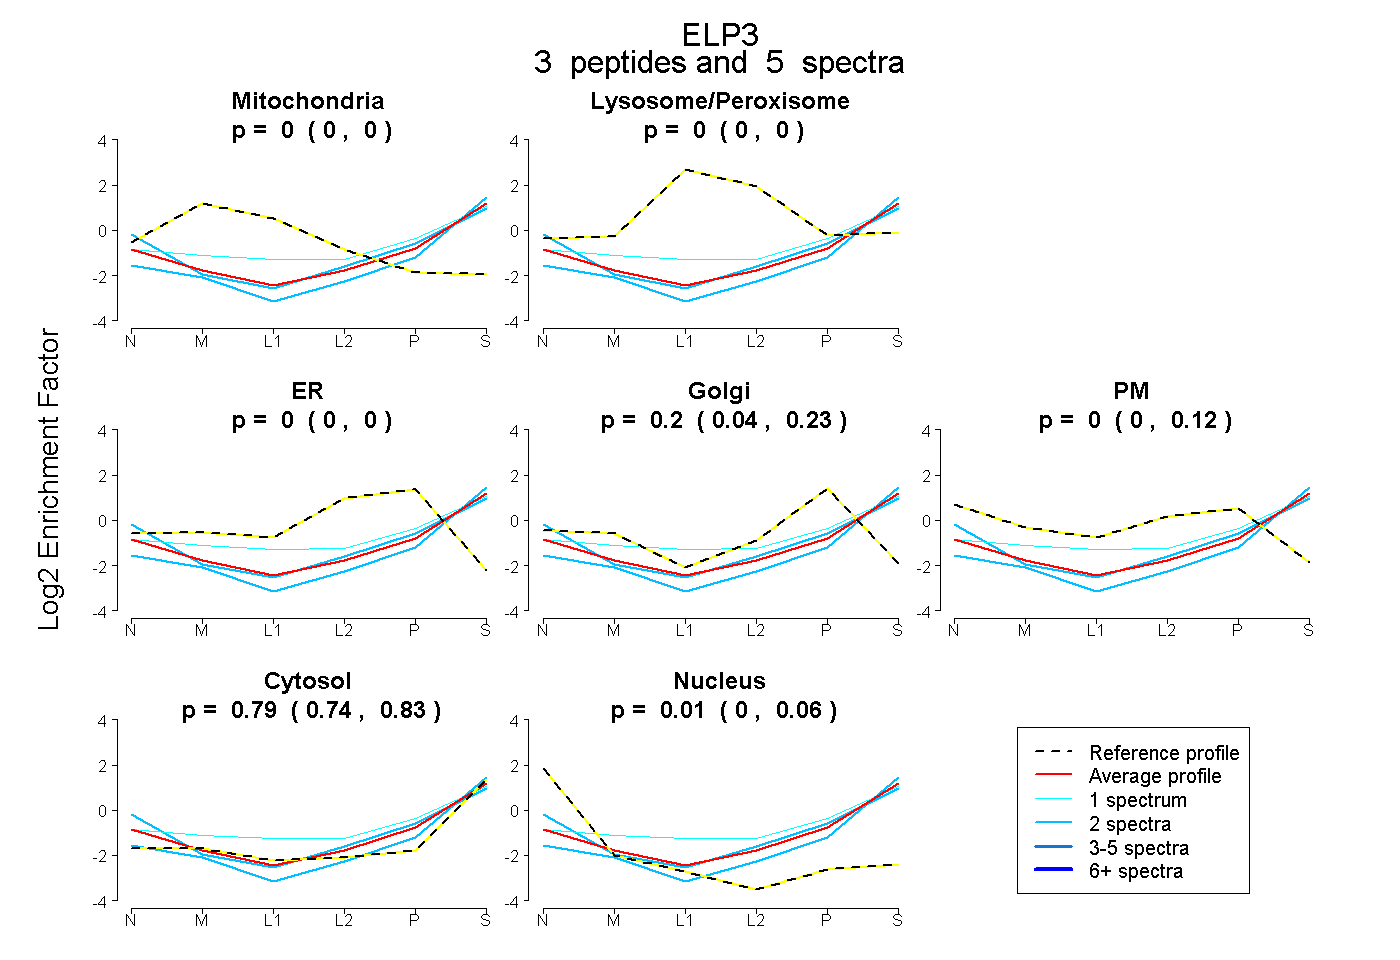 |
0.000 0.000 | 0.000 |
0.000 0.000 | 0.001 |
0.000 0.000 | 0.000 |
0.195 0.036 | 0.226 |
0.003 0.000 | 0.125 |
0.795 0.741 | 0.831 |
0.007 0.000 | 0.056 |
|||
| Plot | Lyso | Other | |||||||||||
| Expt C |
5 peptides |
9 spectra |
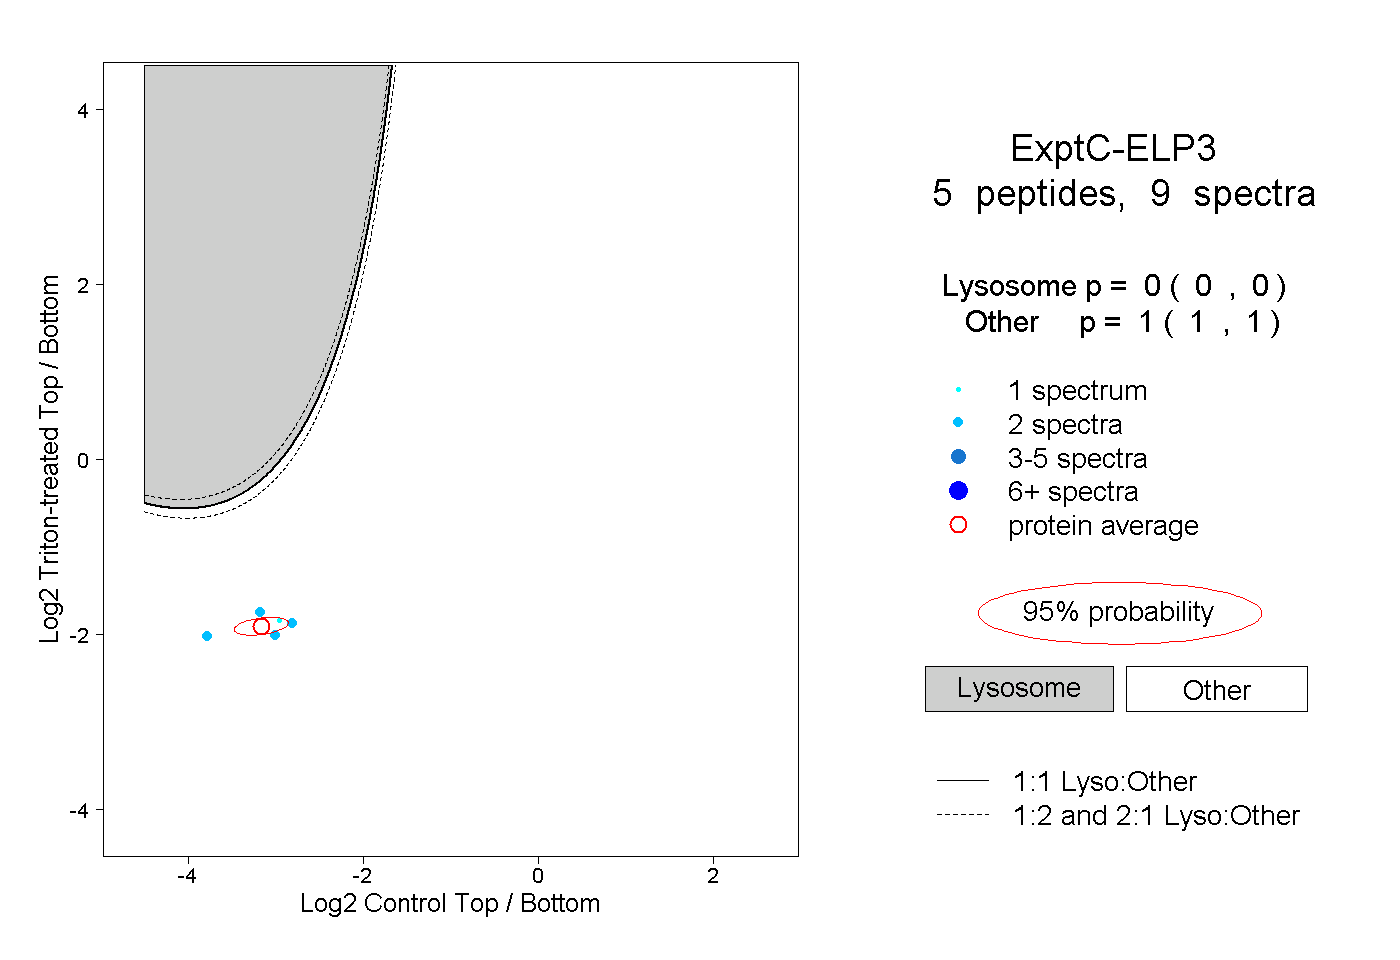 |
0.000 0.000 | 0.000 |
1.000 1.000 | 1.000 |
||||||||
| Plot | Lyso | Other | |||||||||||
| Expt D |
1 peptide |
1 spectrum |
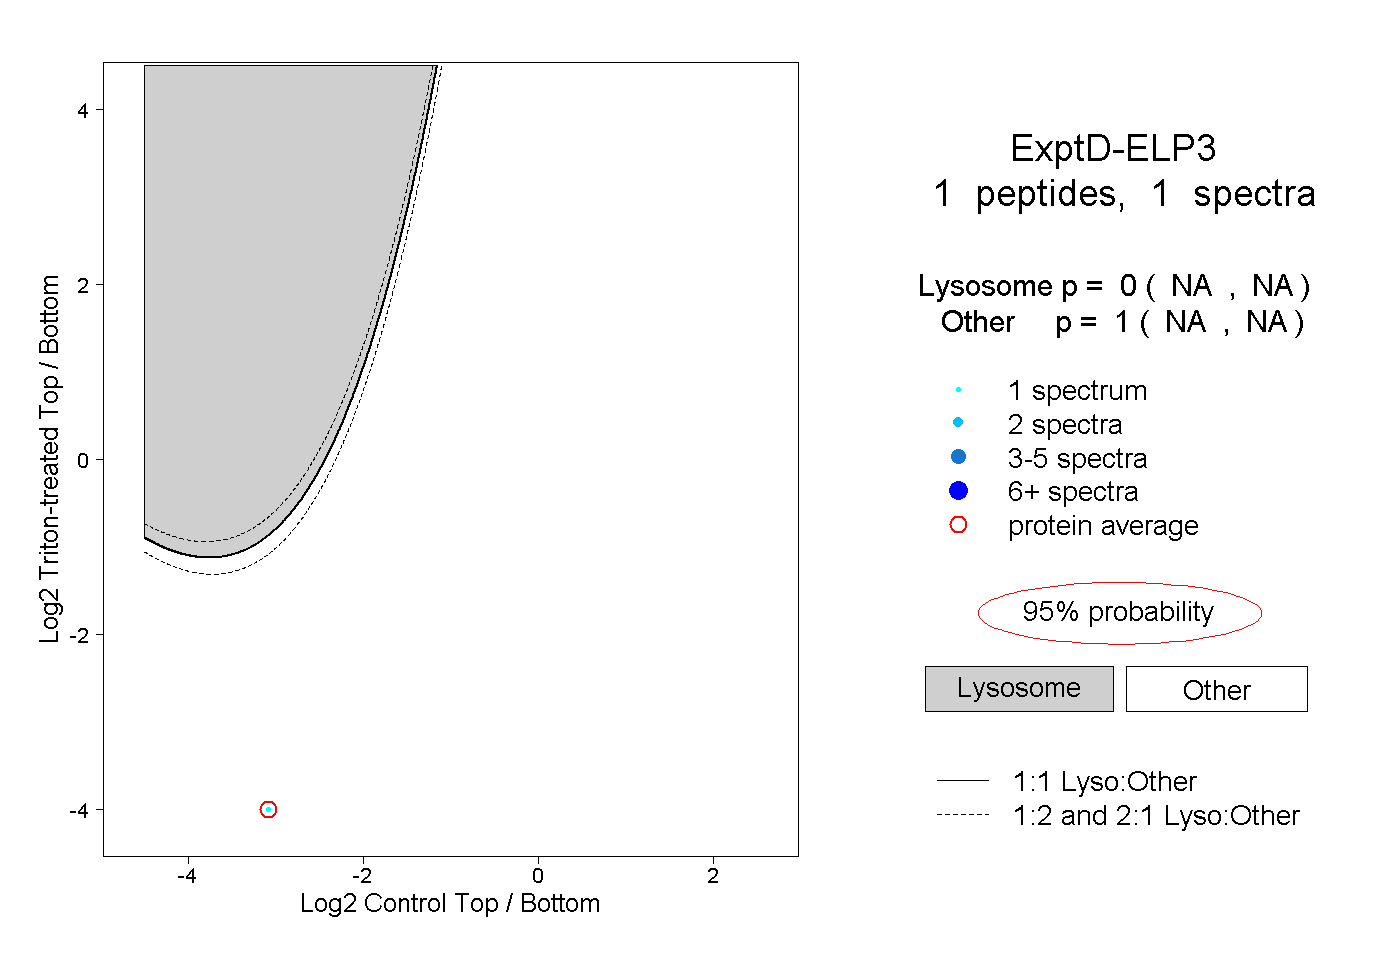 |
0.000 NA | NA |
1.000 NA | NA |