ELP3
[ENSRNOP00000019262]
Main page
| | | Plot |
Mito |
Lyso |
|
Perox |
ER |
Golgi |
PM |
Cytosol |
Nucleus |
|
| Expt A |
 8
8
peptides |
17
spectra |
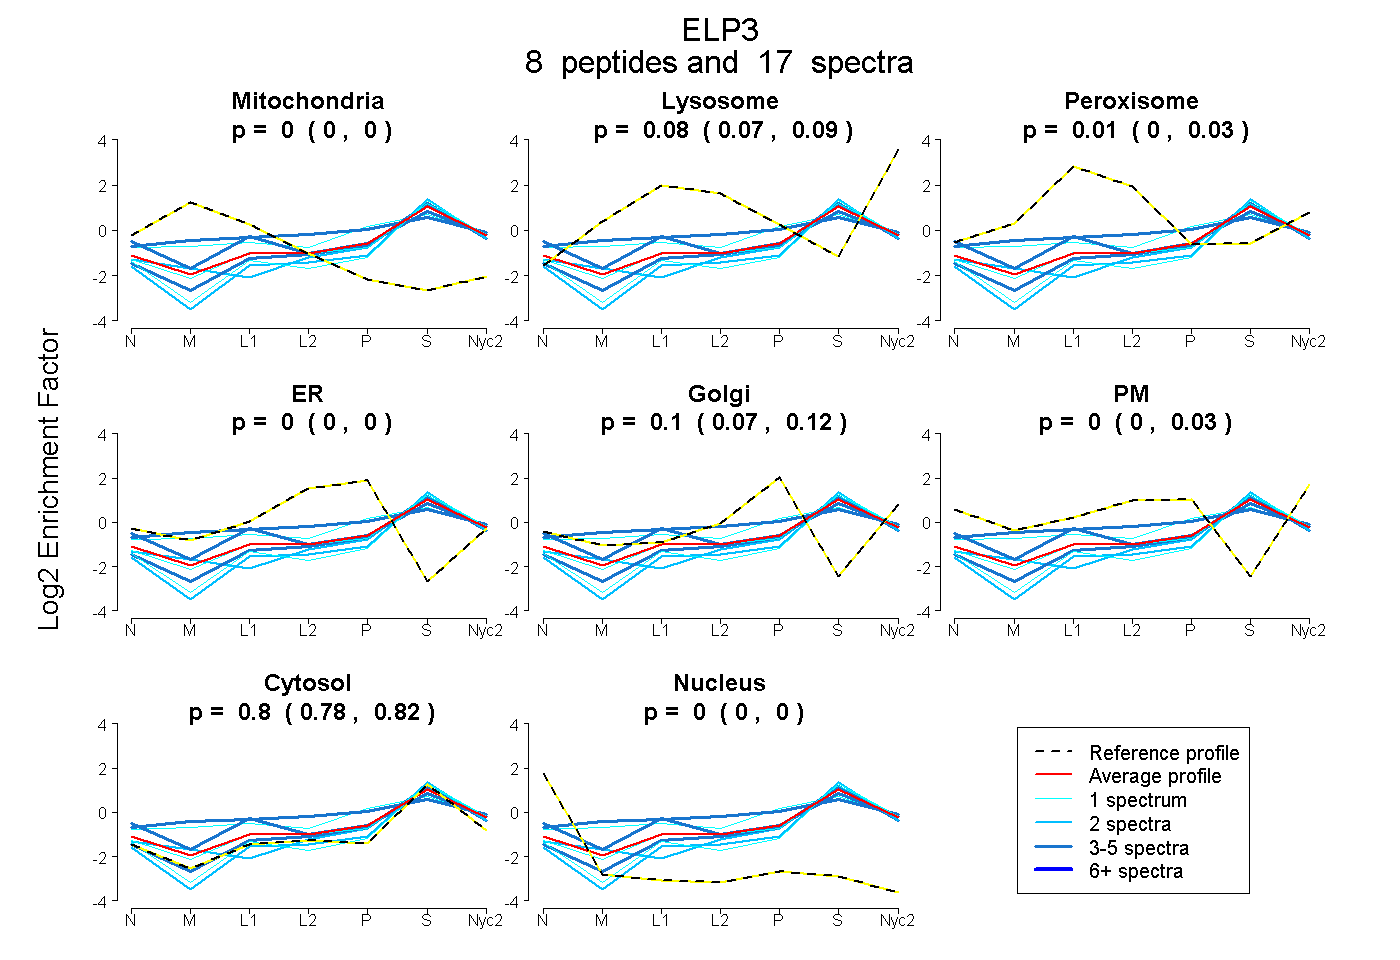 |
0.000
0.000 | 0.000 |
0.083
0.067 | 0.092 |
|
0.012
0.000 | 0.034 |
0.000
0.000 | 0.000 |
0.104
0.071 | 0.118 |
0.000
0.000 | 0.027 |
0.801
0.783 | 0.816 |
0.000
0.000 | 0.000 |
|
| | | Plot |
Mito |
|
Lyso or Perox |
|
ER |
Golgi |
PM |
Cytosol |
Nucleus |
|
| Expt B |
3
peptides |
5
spectra |
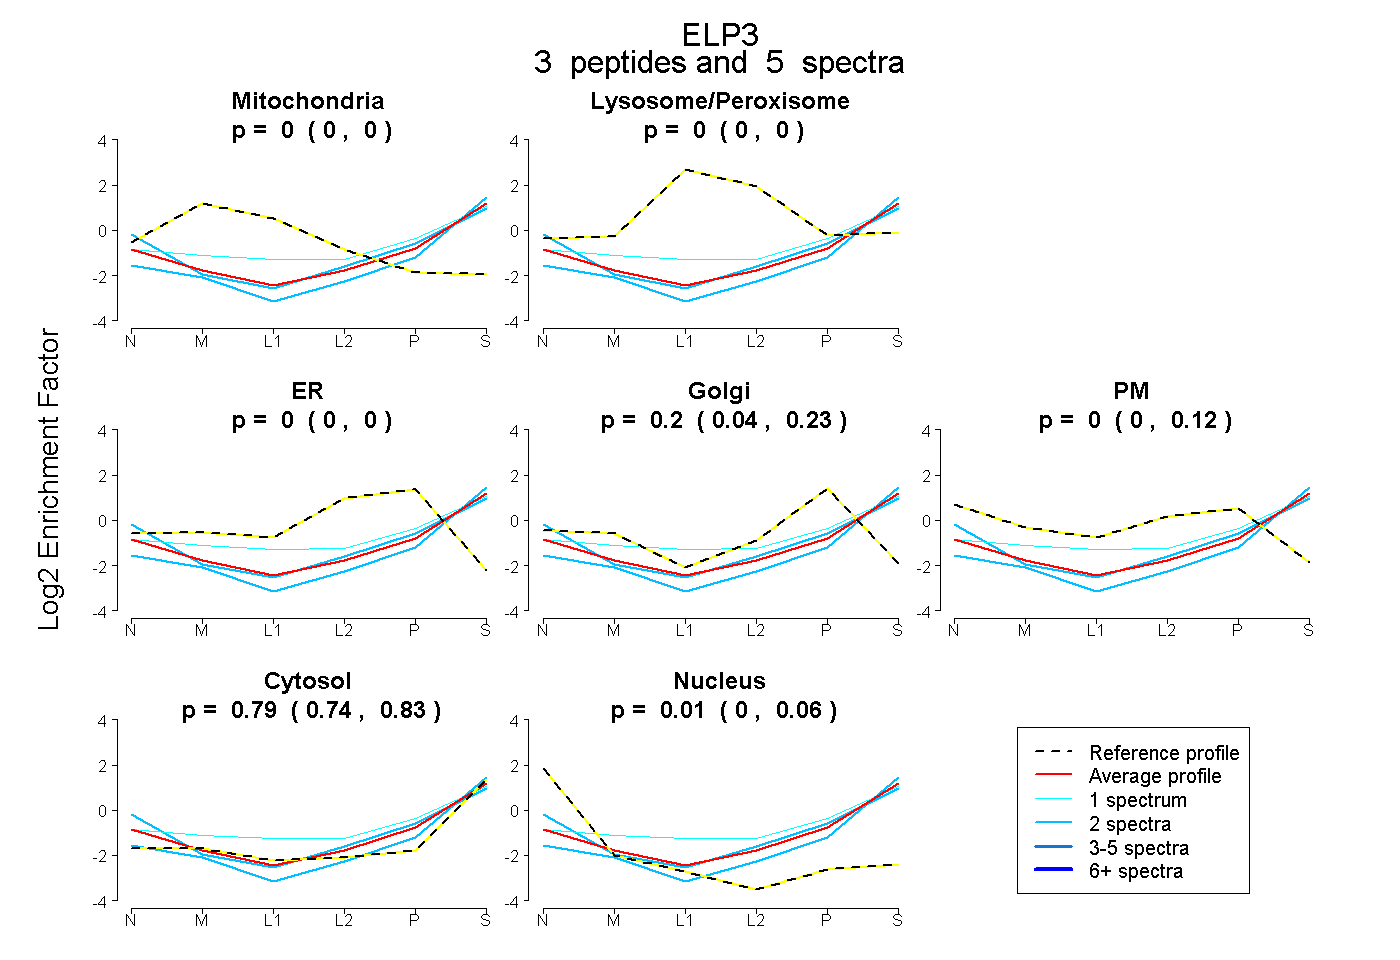 |
0.000
0.000 | 0.000 |
|
0.000
0.000 | 0.001 |
|
0.000
0.000 | 0.000 |
0.195
0.036 | 0.226 |
0.003
0.000 | 0.125 |
0.795
0.741 | 0.831 |
0.007
0.000 | 0.056 |
|
| 2 spectra, IAVISGVGTR |
0.000 |
|
0.000 |
|
0.000 |
0.031 |
0.000 |
0.961 |
0.008 |
|
| 1 spectrum, VRPYQVELVR |
0.000 |
|
0.183 |
|
0.000 |
0.200 |
0.000 |
0.617 |
0.000 |
|
| 2 spectra, LYPTLVIR |
0.000 |
|
0.000 |
|
0.000 |
0.165 |
0.089 |
0.675 |
0.070 |
|
| | | Plot |
|
Lyso |
|
|
|
|
|
|
|
Other |
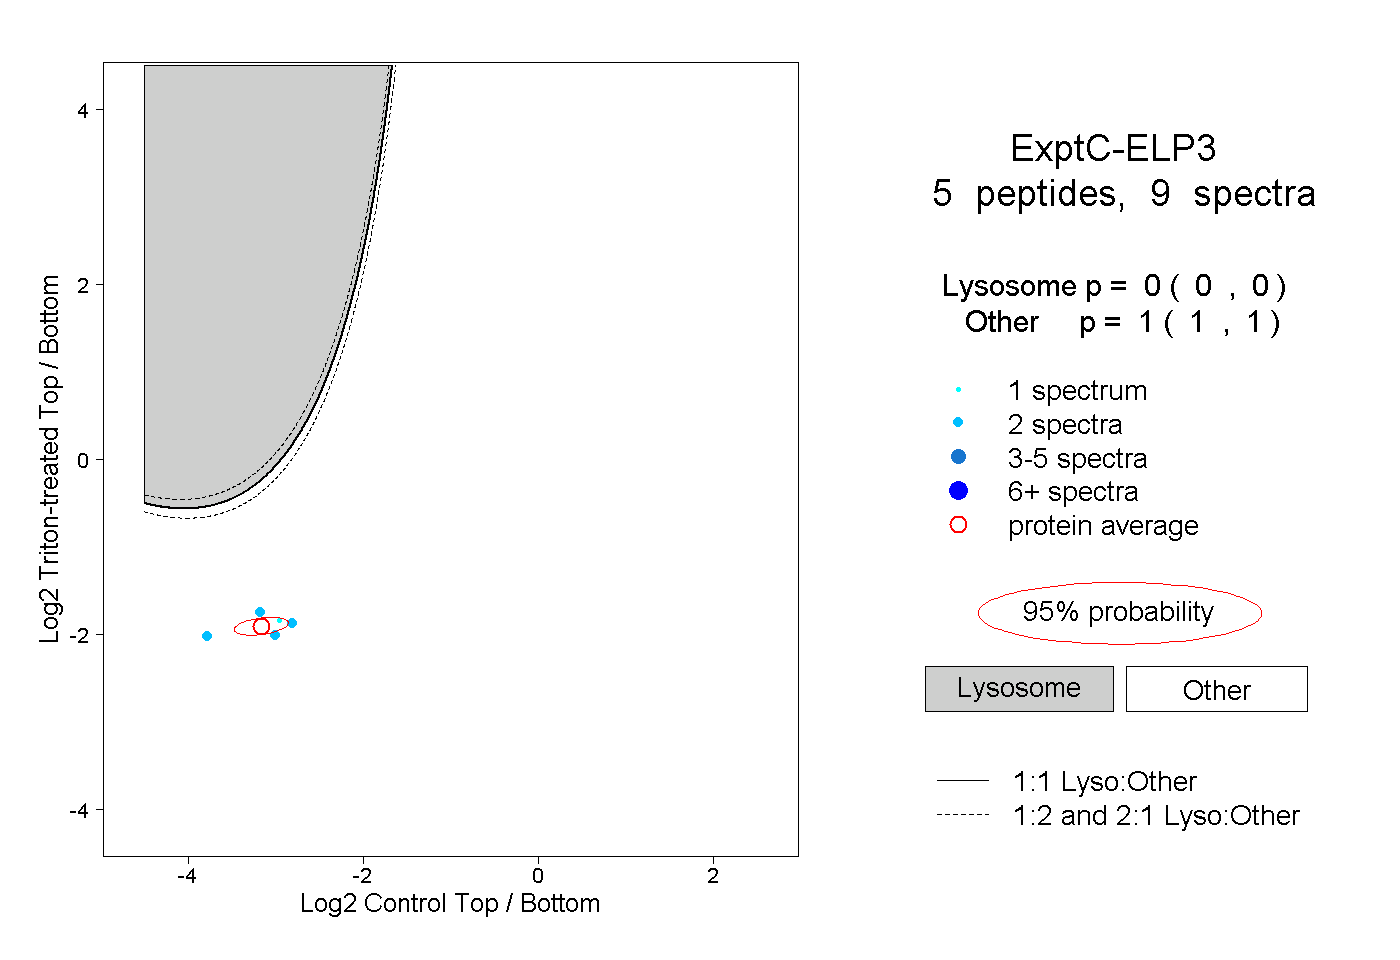
| Expt C |
5
peptides |
9
spectra |
 |
|
0.000
0.000 | 0.000 |
|
|
|
|
|
|
|
1.000
1.000 | 1.000 |
| | | Plot |
|
Lyso |
|
|
|
|
|
|
|
Other |
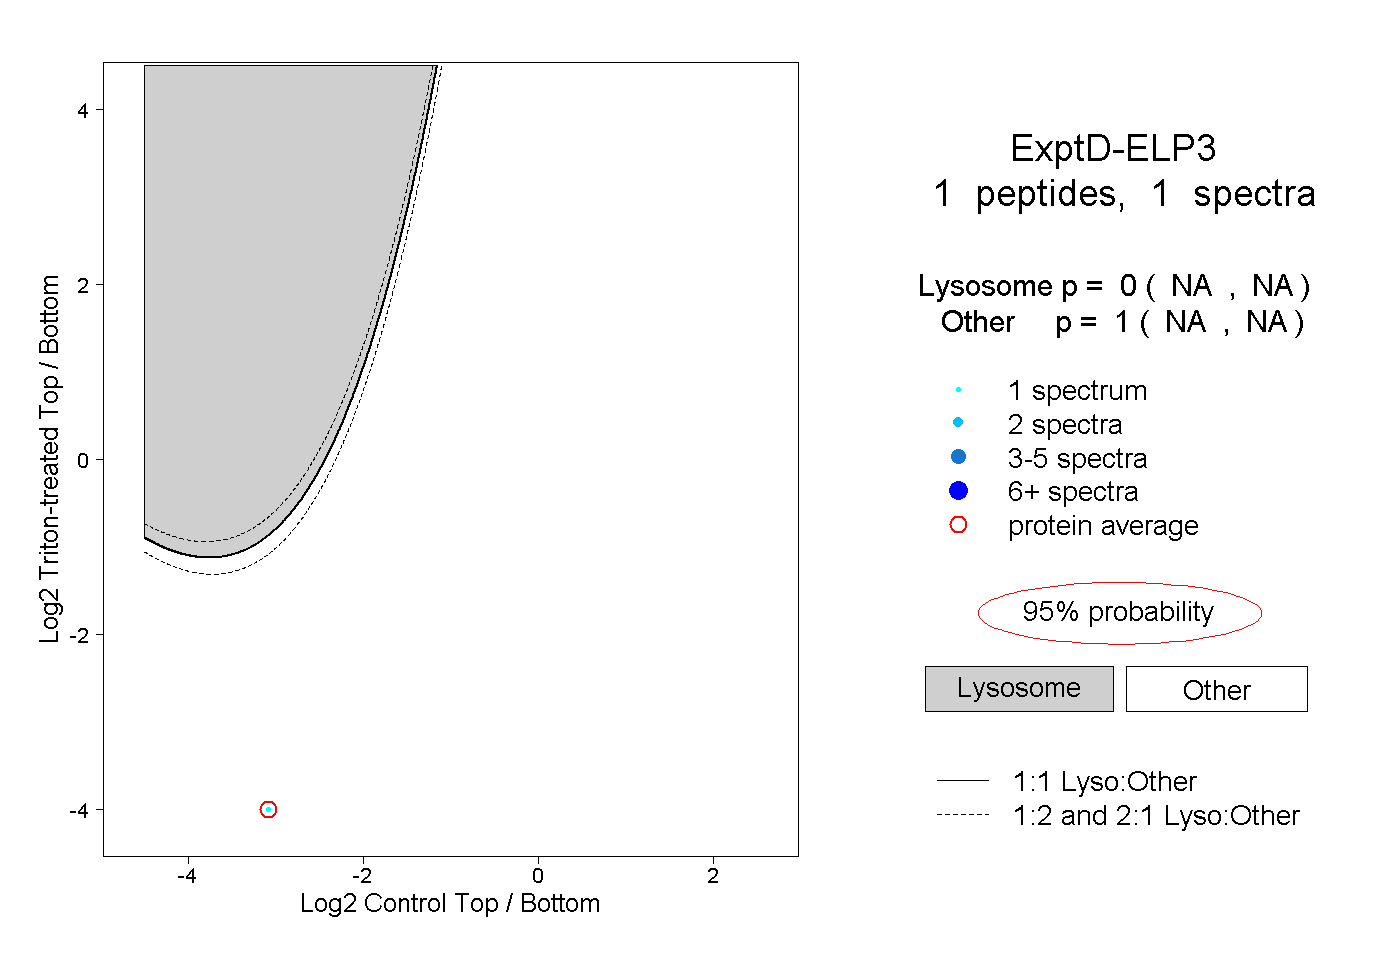
| Expt D |
1
peptide |
1
spectrum |
 |
|
0.000
NA | NA |
|
|
|
|
|
|
|
1.000
NA | NA |