 12
12peptides
spectra
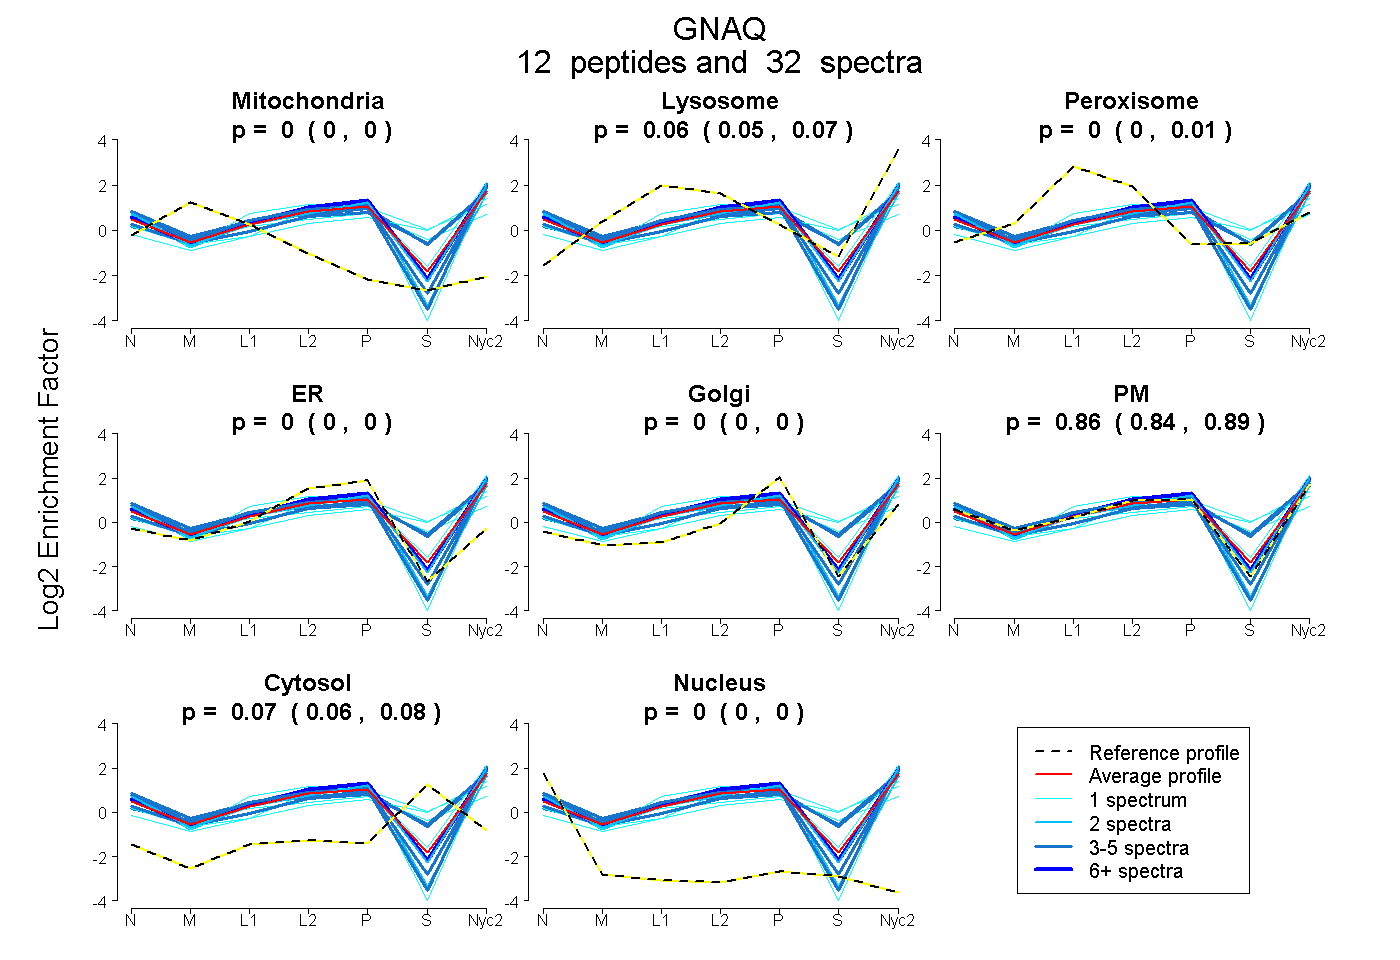
0.000 | 0.000
0.047 | 0.073
0.000 | 0.009
0.000 | 0.000
0.000 | 0.000
0.838 | 0.885
0.060 | 0.083
0.000 | 0.000
7peptides
spectra
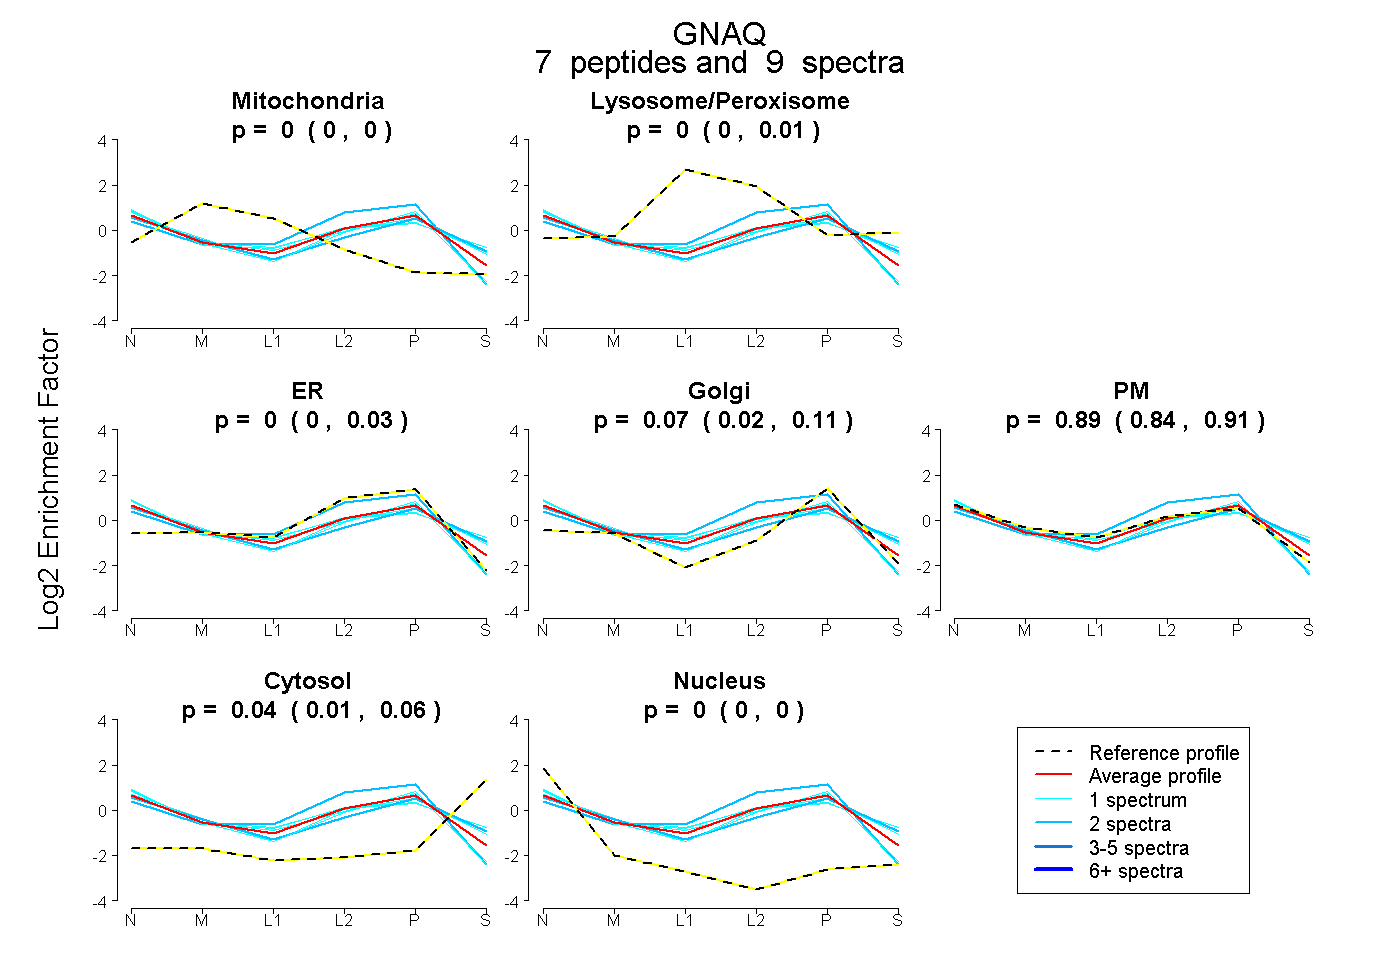
0.000 | 0.000
0.000 | 0.015
0.000 | 0.030
0.020 | 0.111
0.838 | 0.912
0.012 | 0.065
0.000 | 0.004
7peptides
spectra
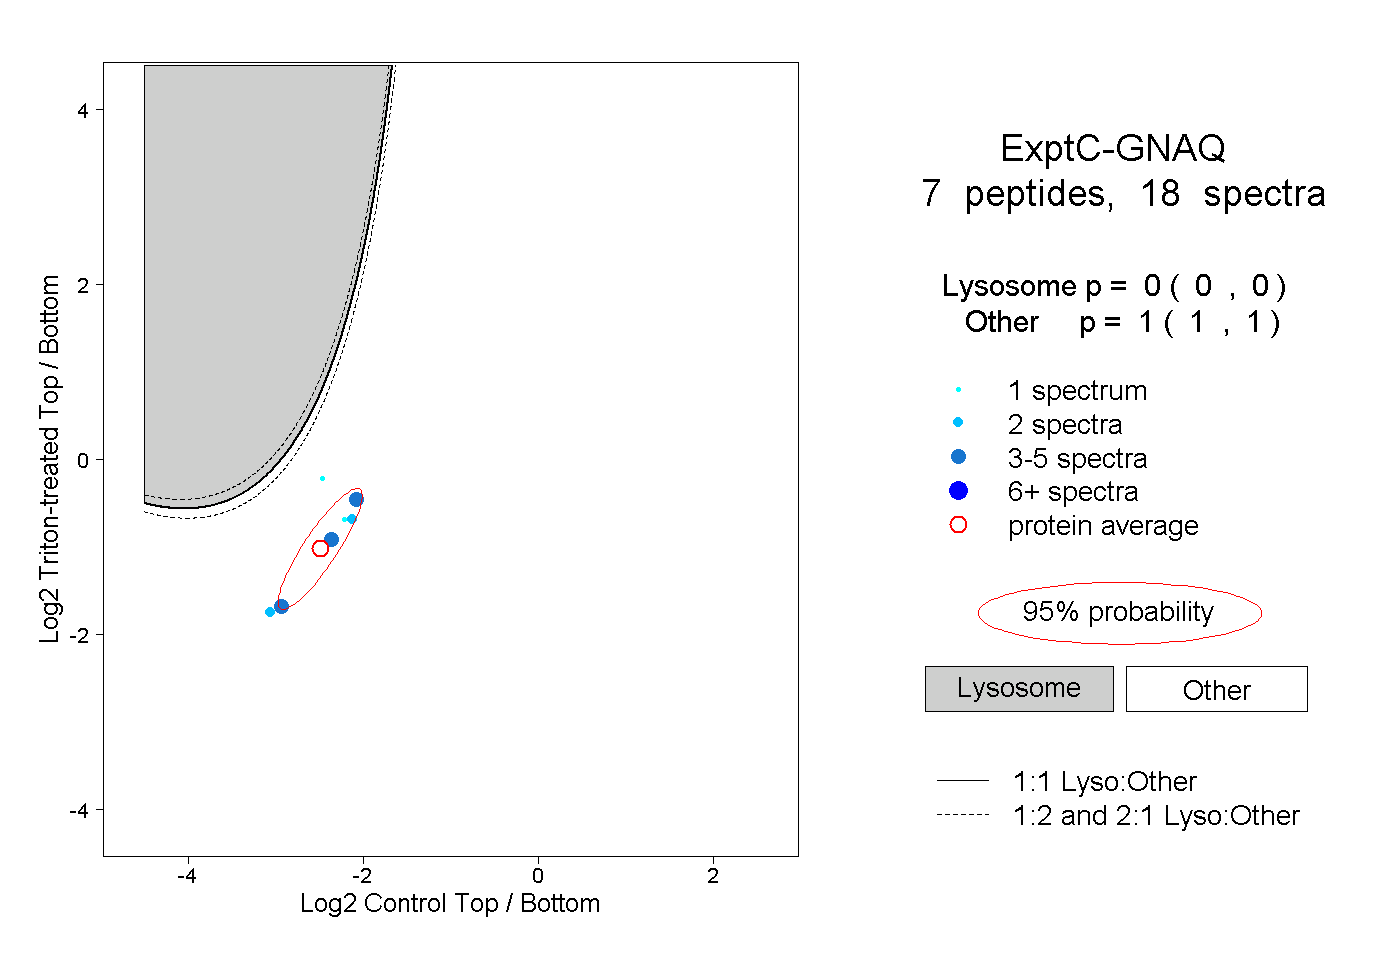
0.000 | 0.000
1.000 | 1.000
4peptides
spectra
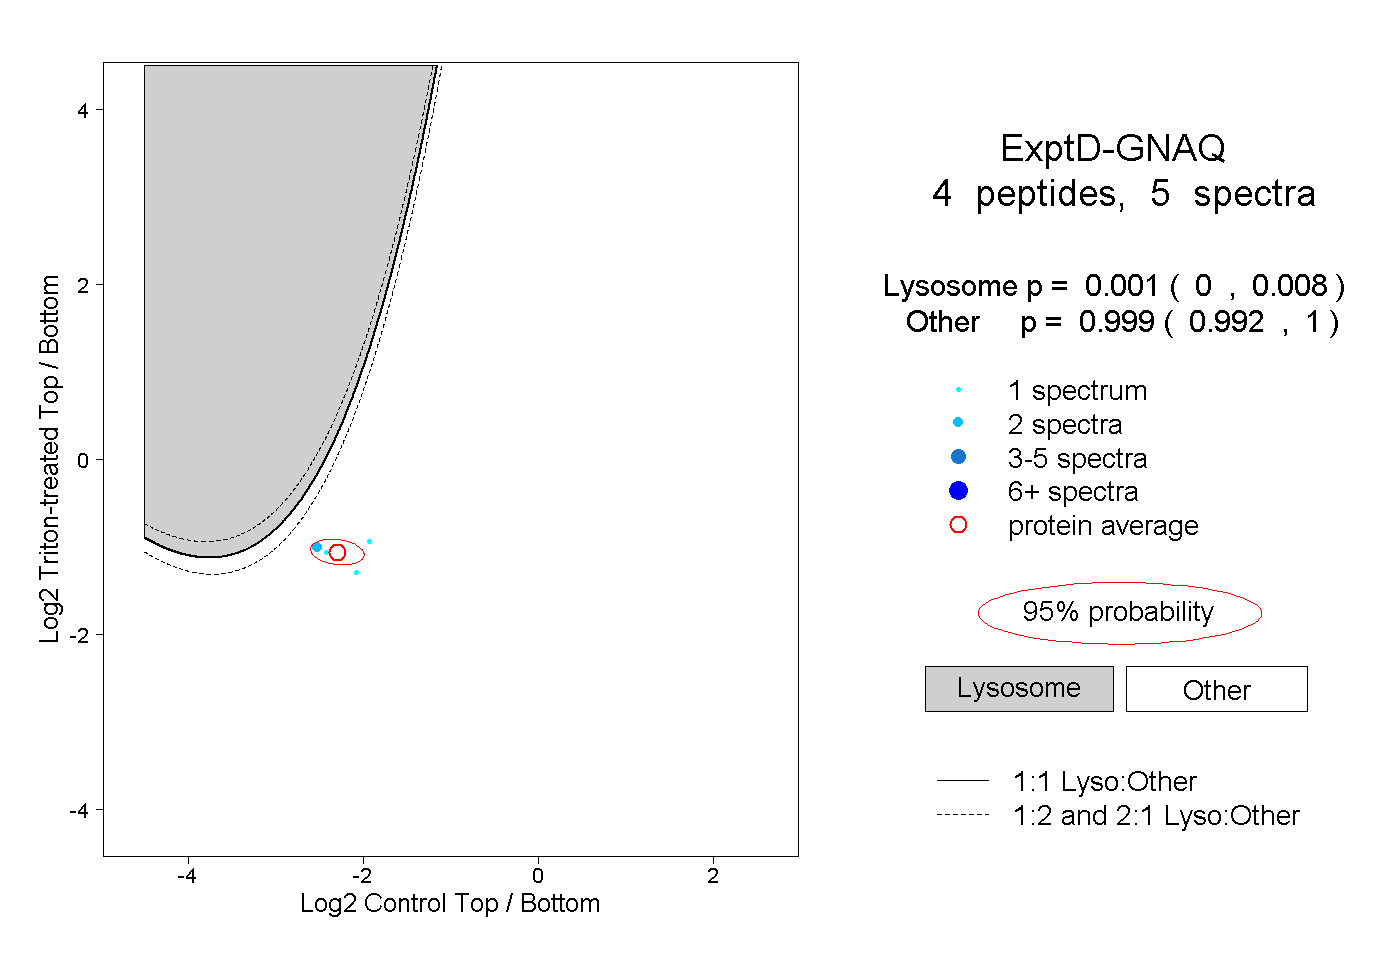
0.000 | 0.008
0.992 | 1.000