 12
12peptides
spectra
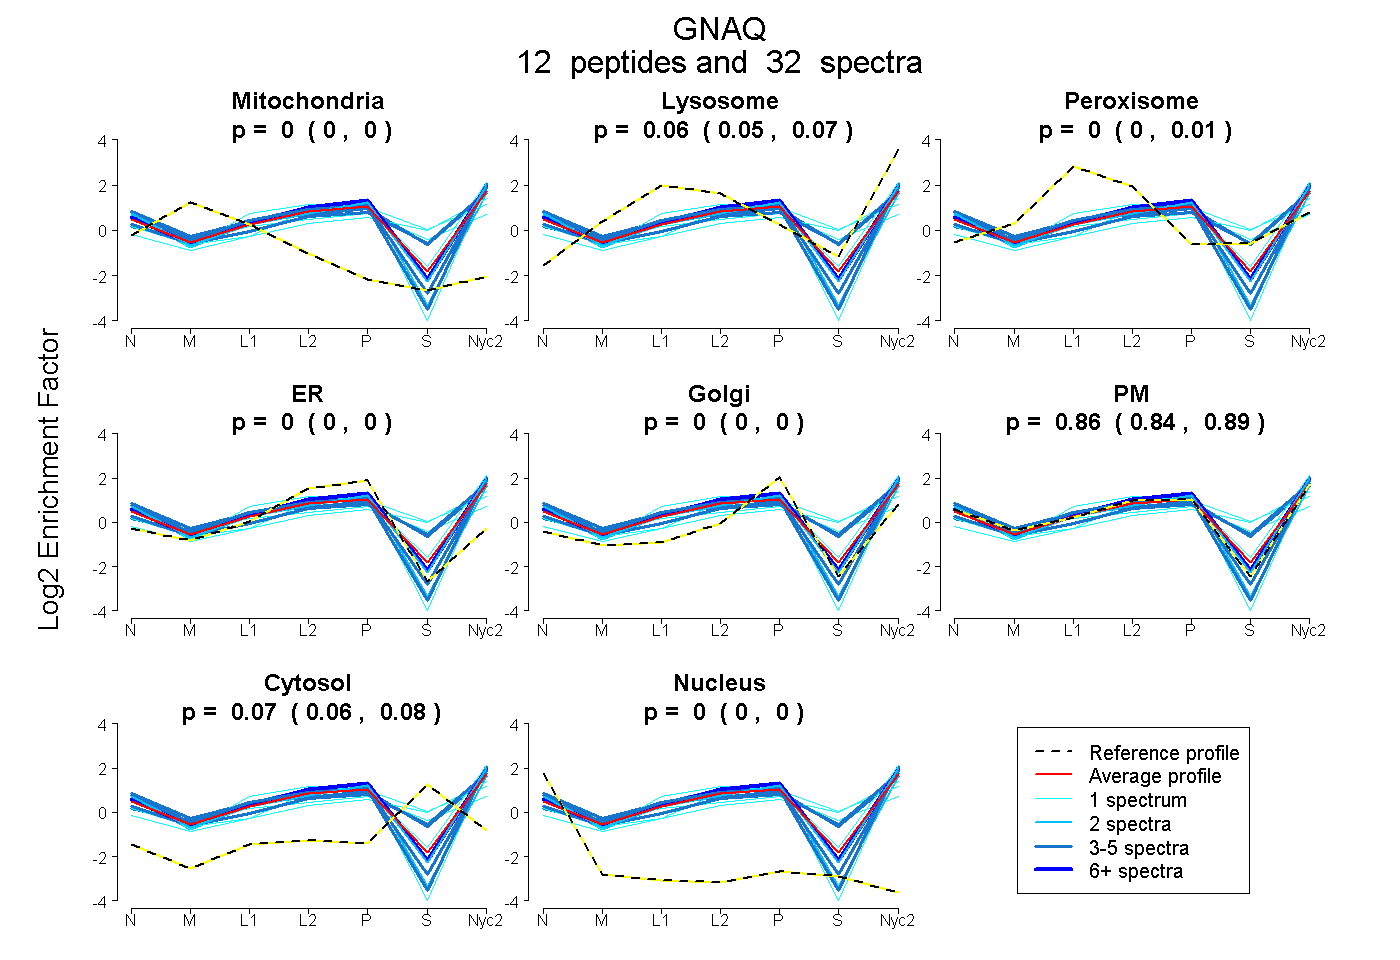
0.000 | 0.000
0.047 | 0.073
0.000 | 0.009
0.000 | 0.000
0.000 | 0.000
0.838 | 0.885
0.060 | 0.083
0.000 | 0.000
| Plot | Mito | Lyso | Perox | ER | Golgi | PM | Cytosol | Nucleus | |||||
| Expt A |
12 peptides |
32 spectra |
|
0.000 0.000 | 0.000 |
0.062 0.047 | 0.073 |
0.000 0.000 | 0.009 |
0.000 0.000 | 0.000 |
0.000 0.000 | 0.000 |
0.864 0.838 | 0.885 |
0.073 0.060 | 0.083 |
0.000 0.000 | 0.000 |
| 4 spectra, VSAFENPYVDAIK | 0.000 | 0.000 | 0.000 | 0.000 | 0.000 | 1.000 | 0.000 | 0.000 | ||
| 2 spectra, YYLNDLDR | 0.000 | 0.010 | 0.000 | 0.000 | 0.028 | 0.959 | 0.003 | 0.000 | ||
| 7 spectra, MVDVGGQR | 0.000 | 0.057 | 0.000 | 0.000 | 0.041 | 0.903 | 0.000 | 0.000 | ||
| 4 spectra, MFVDLNPDSDK | 0.000 | 0.174 | 0.000 | 0.000 | 0.000 | 0.596 | 0.230 | 0.000 | ||
| 1 spectrum, EYQLSDSTK | 0.000 | 0.157 | 0.000 | 0.000 | 0.000 | 0.501 | 0.342 | 0.000 | ||
| 1 spectrum, LLLLGTGESGK | 0.000 | 0.201 | 0.000 | 0.132 | 0.000 | 0.344 | 0.323 | 0.000 | ||
| 2 spectra, EVDVEK | 0.000 | 0.000 | 0.000 | 0.120 | 0.000 | 0.880 | 0.000 | 0.000 | ||
| 1 spectrum, INDEIER | 0.000 | 0.115 | 0.059 | 0.000 | 0.000 | 0.801 | 0.024 | 0.000 | ||
| 4 spectra, FVFAAVK | 0.000 | 0.000 | 0.000 | 0.000 | 0.000 | 1.000 | 0.000 | 0.000 | ||
| 1 spectrum, DTILQLNLK | 0.000 | 0.000 | 0.000 | 0.000 | 0.000 | 1.000 | 0.000 | 0.000 | ||
| 1 spectrum, AHAQLVR | 0.000 | 0.000 | 0.221 | 0.000 | 0.106 | 0.430 | 0.243 | 0.000 | ||
| 4 spectra, AMDTLK | 0.000 | 0.181 | 0.073 | 0.000 | 0.004 | 0.561 | 0.181 | 0.000 |
| Plot | Mito | Lyso or Perox | ER | Golgi | PM | Cytosol | Nucleus | ||||||
| Expt B |
7 peptides |
9 spectra |
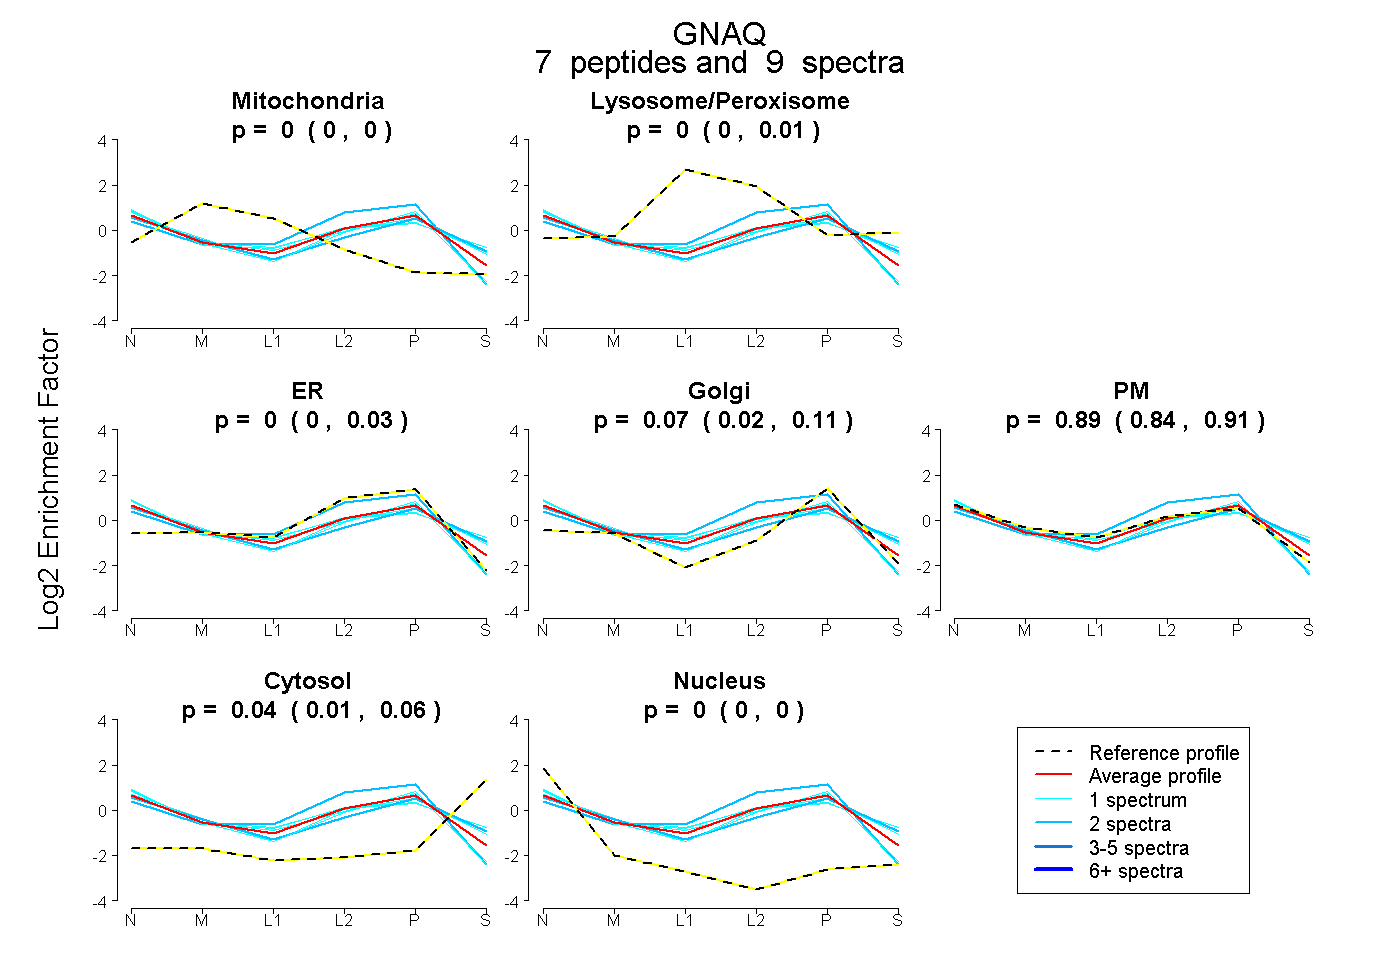 |
0.000 0.000 | 0.000 |
0.000 0.000 | 0.015 |
0.000 0.000 | 0.030 |
0.067 0.020 | 0.111 |
0.890 0.838 | 0.912 |
0.043 0.012 | 0.065 |
0.000 0.000 | 0.004 |
|||
| Plot | Lyso | Other | |||||||||||
| Expt C |
7 peptides |
18 spectra |
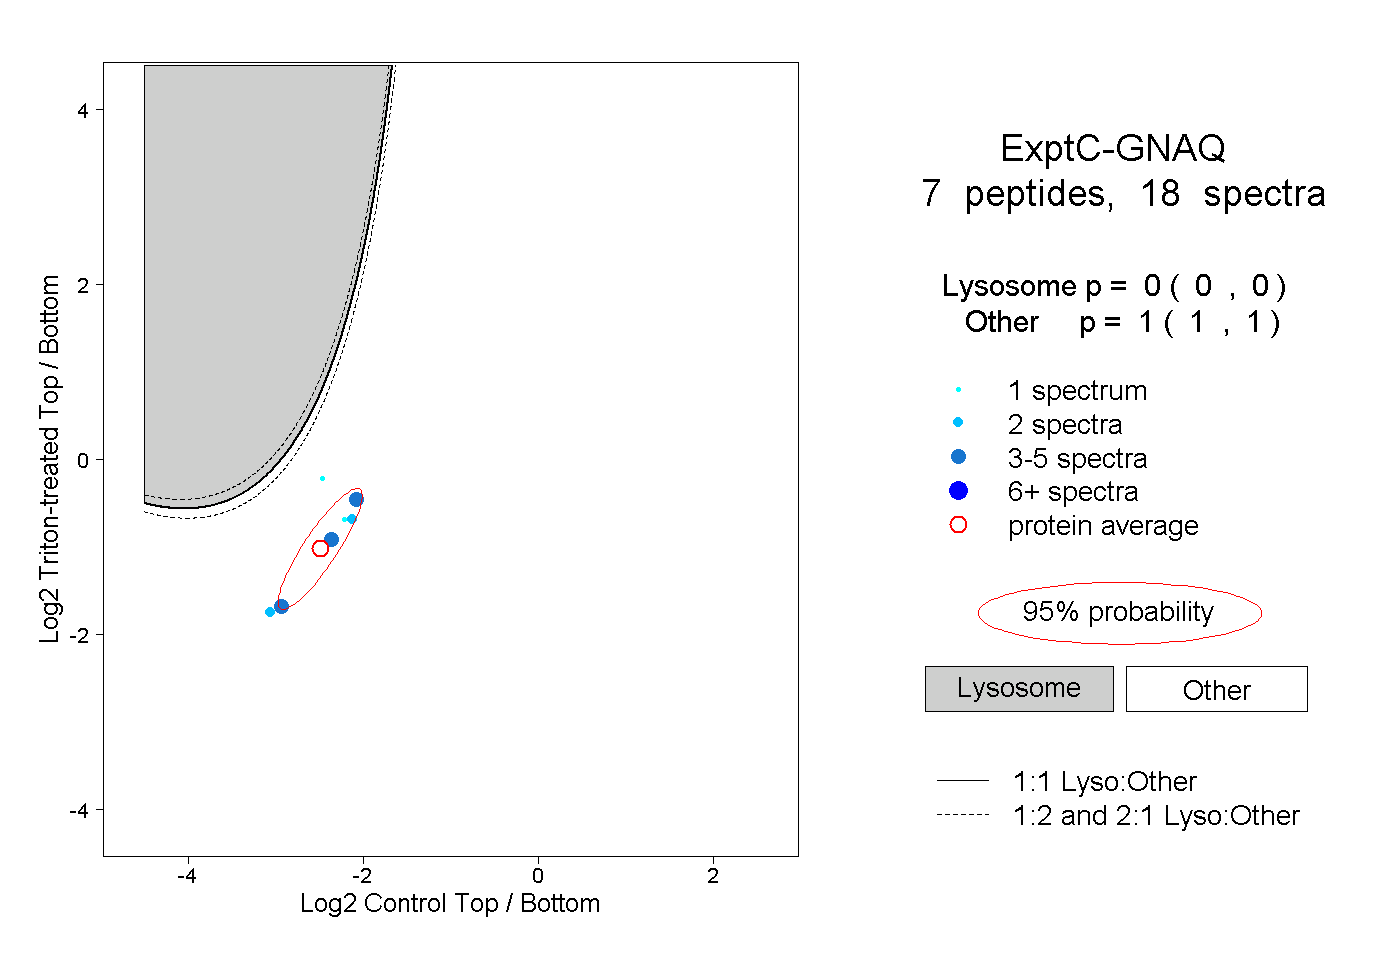 |
0.000 0.000 | 0.000 |
1.000 1.000 | 1.000 |
||||||||
| Plot | Lyso | Other | |||||||||||
| Expt D |
4 peptides |
5 spectra |
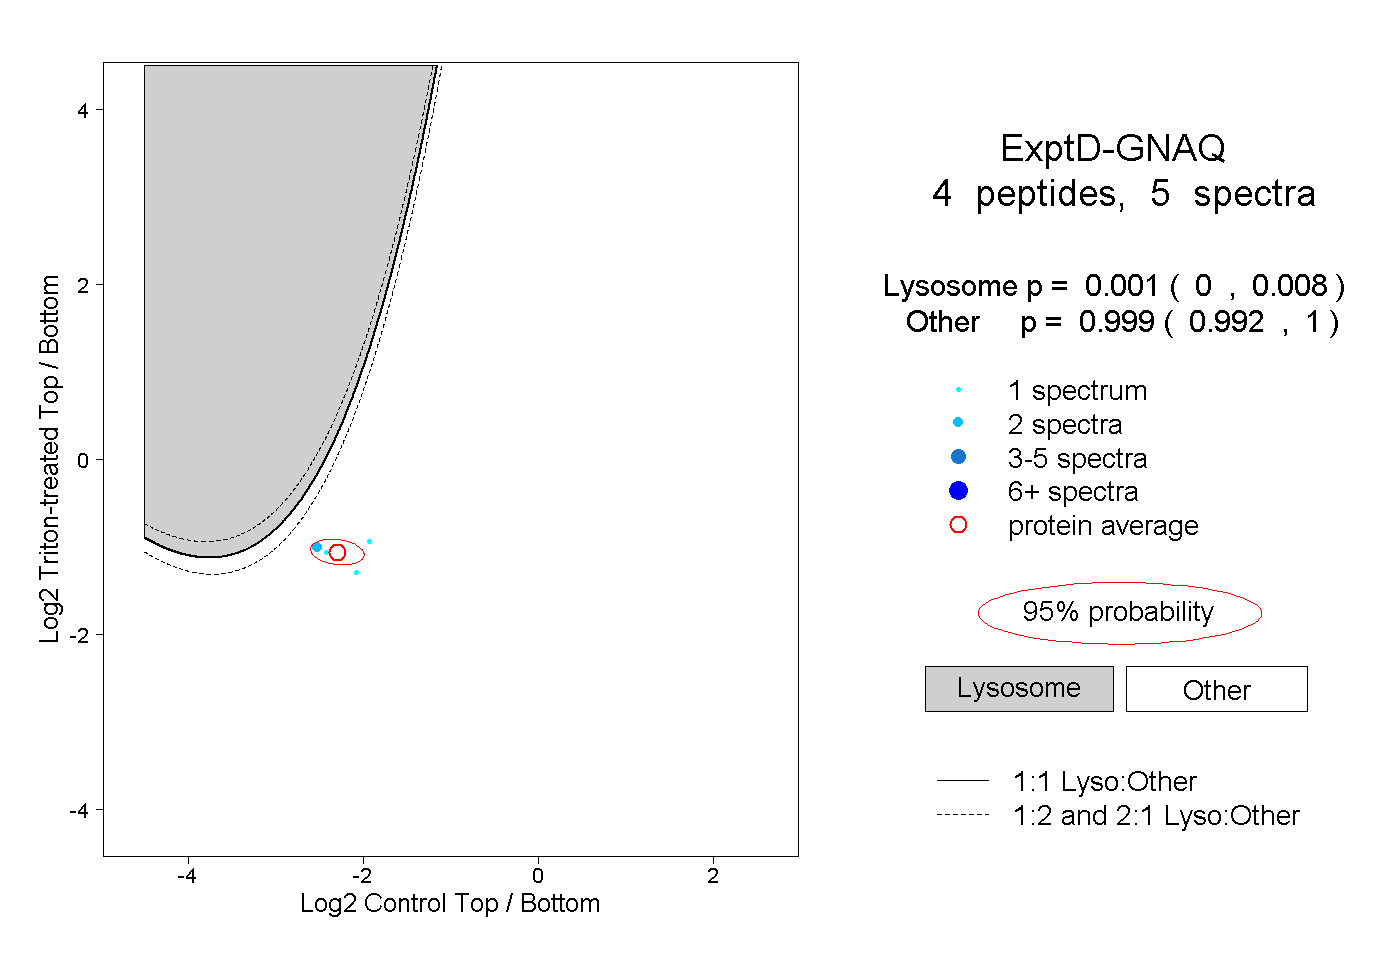 |
0.001 0.000 | 0.008 |
0.999 0.992 | 1.000 |